One of my attributes (maybe handicaps) is that I often tend to look at things through a political lens. Once upon a time I was assistant to the chair of the Democratic National Committee.
So when DHS issued a series of nicely laid-out naturalization fact sheets for 22 different locations in the U.S., a thought hit me: These would be very valuable to a political party seeking to naturalize green card holders in order to make them voting citizens. (My speculation and the true motivation for the publication of these reports may have nothing to do with each other, but hear me out.)
Some of the fact sheets show, by zip code, exactly where most of those in the area eligible for citizenship live, as well as useful data on the nations of origin. Were I involved in the Democratic Committee in Lehigh County, Pa., for example, I would learn that the non-naturalized are heavily concentrated geographically. There are 37 zip codes in the county, but 69 percent of those eligible live in three adjacent zip codes, with 39 percent of them in 18102 in Allentown. There are about 8,500 potential naturalization candidates in the county, and the largest group (2,690) of these are from the Dominican Republic. Coming in second is Syria with 720.
Women outnumber men 54 percent to 46 percent among those eligible; and the largest age group within it consists of aliens 30 to 39 years of age. This means that women are a little less likely, at least in Lehigh County, to naturalize than men.
If I were planning a campaign to naturalize aliens, I would have a handy tool in the fact sheet, including this map:
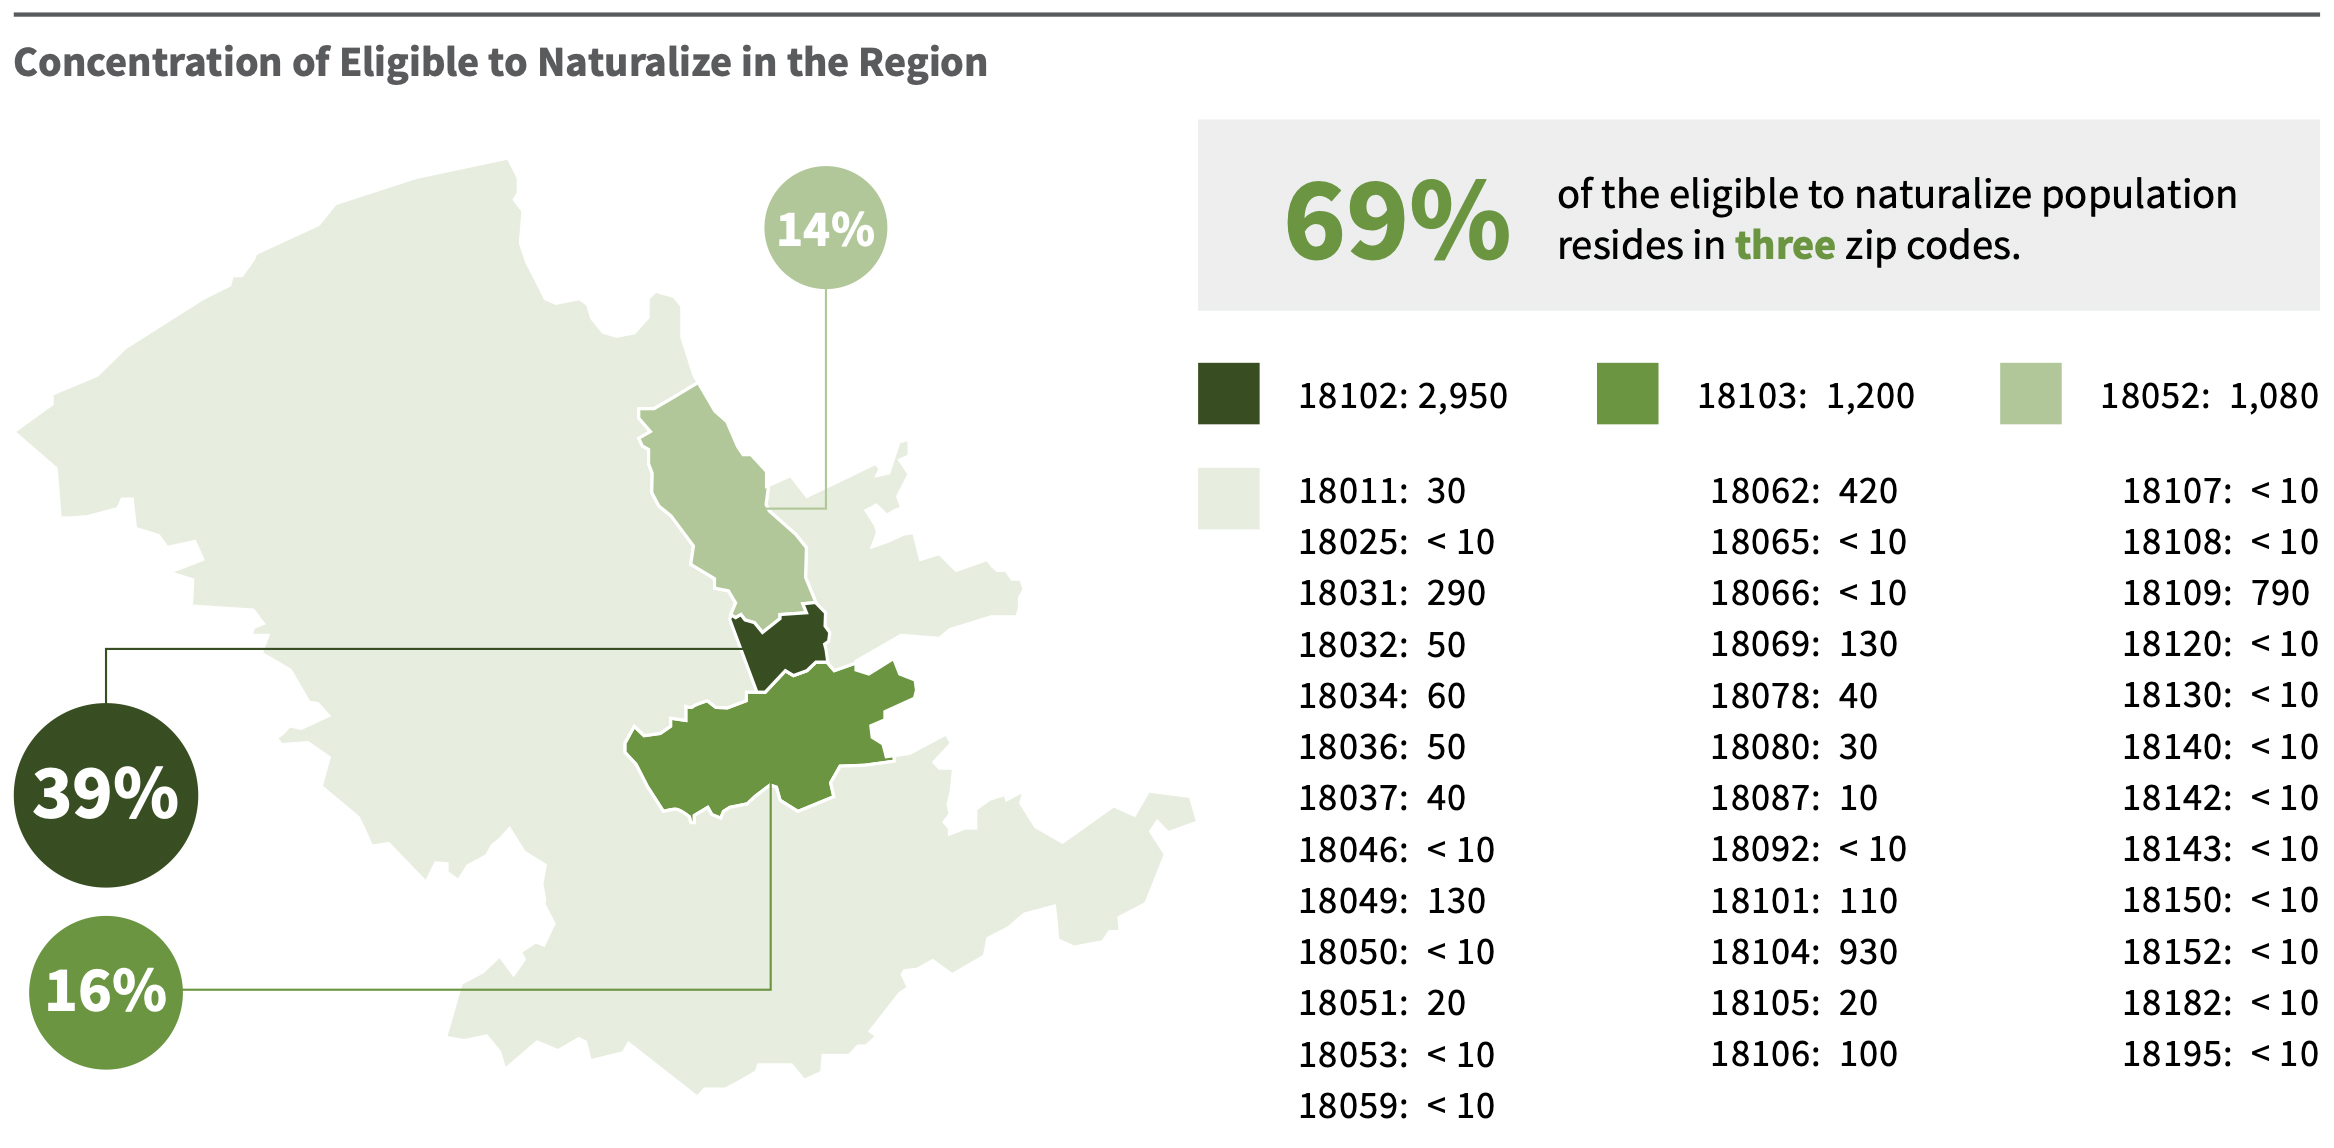 |
The other 21 fact sheets cover areas within California, Florida, Michigan, Texas, and other locations in Pennsylvania. There are also reports on multi-state areas in Chicagoland and in the Carolinas. The bigger the region, the less useful the data. For example, the greatest concentration of those eligible for naturalization in the greater Chicago area is in Cook County; not a surprise.
I learned in the course of researching this posting that census data are available by zip codes, but the data do not include any information on the number of those eligible for naturalization.