Download a pdf of this Memorandum
Steven A. Camarota is the Director of Research and Ashley Webster is a Demographer at the Center for Immigration
Before the 2010 election some commentators argued that the failure to address immigration would increase Hispanic turnout, while others argued it would cause them to stay home. New Census Bureau voting data show that neither of these predictions was correct. Hispanic turnout conformed to the pattern of recent mid-term elections.
Among the findings:
- Prior to the 2010 election, the Center for Immigration Studies projected that Hispanics would comprise 6.8 percent of the national electorate in congressional elections. The new data from the Census Bureau almost exactly match this projection, with Hispanics comprising 6.9 percent of the vote.
- Our projection was correct because it was based on the assumption that Hispanic turnout would follow past patterns for mid-term elections and that Hispanics would neither be especially animated nor especially disengaged in 2010.
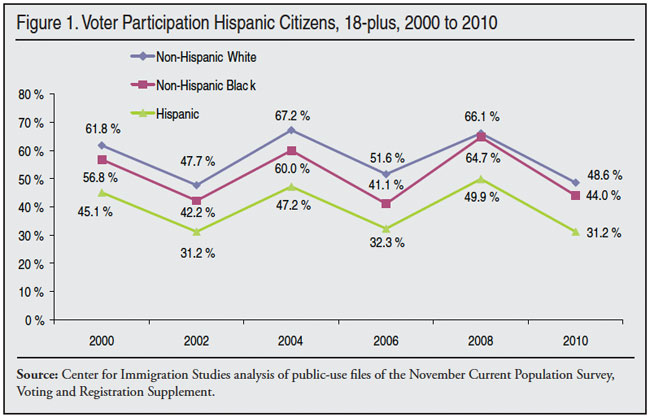
- The 31.2 percent of Hispanic citizens who voted in 2010 matches the 31.2 percent who voted in the 2002 mid-term election, and is very similar to the 32.3 percent who voted in 2006. All of these values fall within the margin of error of ± 1.7 percentage points and indicate that 2010 was not unusual.
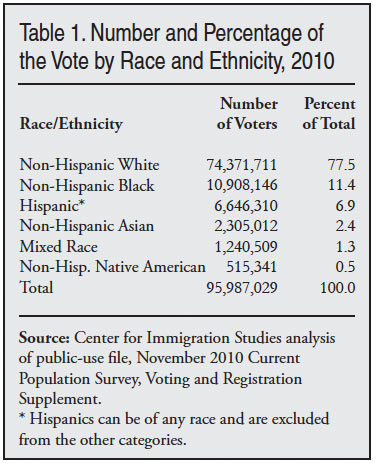
- In addition to the 6.9 percent of voters who identified as Hispanic in the 2010 election, 77.5 percent of voters identified as non-Hispanic white, 11.5 percent as non-Hispanic black, and 2.4 percent identified as non-Hispanic Asian.
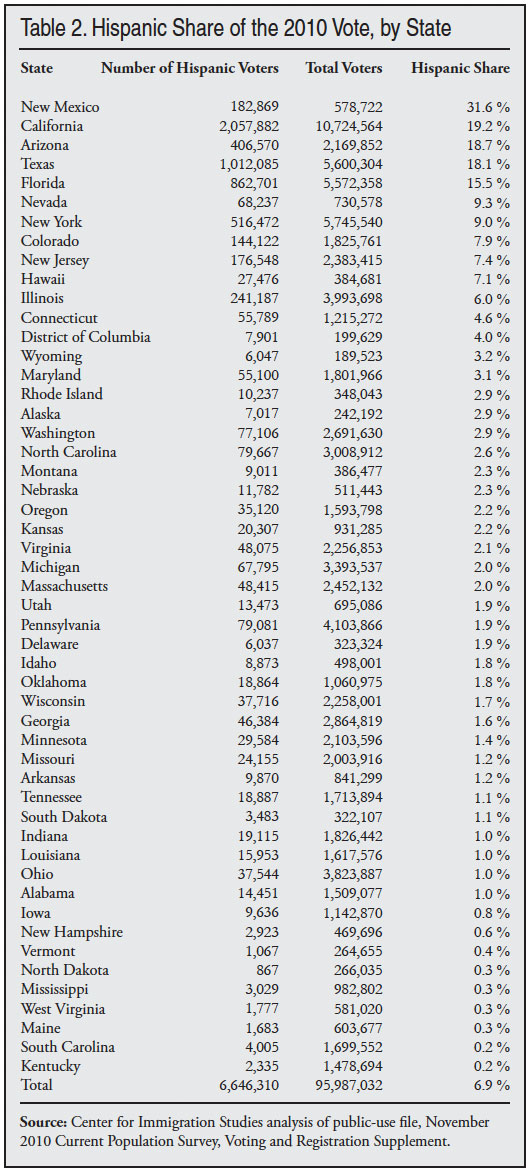
- The size of the Hispanic vote varied significantly by state. In 2010, Hispanics were less than 5 percent of the vote in 39 states plus the District of Columbia, and more than 10 percent of the vote in only five states (New Mexico, California, Arizona, Texas, and Florida).
- Polling of Hispanics indicates that immigration is not one of the top issues for Hispanics. Similar to other voters, education, jobs, health care, and the federal deficit all rank above immigration in importance.1
- This does not mean immigration is unimportant to Hispanics. What is does mean is that it was not an issue that was important enough in 2010 to have a discernible impact on their overall turnout.
- Only 27 percent of Hispanic voters in the 2010 election were immigrants themselves (naturalized U.S. citizens) and just 14.9 percent lived in the same households as a non-citizen. The lack of direct personal experience with immigration may explain why the issue does not rank higher in importance to Hispanic voters.
- CNN’s national exit polls showed that, in 2010, 60 percent of Hispanics voted for Democrats and 38 percent voted for Republicans. This compares to 69 percent and 30 percent in the last mid-term election in 2006. If the failure to address immigration played a role in Hispanic voting, it seems to have helped Republicans.2
- However, the increase in the Republican share of the Hispanic vote in 2010 is almost certainly related to general voter dissatisfaction with the economy, and parallels gains that Republicans made among many demographic groups.
Discussion
In a report published in October 2010, the Center for Immigration Studies stated that, “Based on past patterns, we project that Hispanics will comprise 6.8 percent of the electorate in November 2010.”3 This projection turned out to almost exactly match the 6.9 percent share shown by recently released Census Bureau data collected for the November 2010 elections. To arrive at our estimate, we projected the size of the Hispanic population in November 2010 and then assumed that the share of eligible voters who would go to the polls would be the same as for prior mid-term elections. Since the share of eligible Hispanic voters who turned out followed past patterns, the projection was correct.
In our October 2010 report we summarized some of the commentators who argued that Hispanic turnout would be strong and others who argued it would be weak. Those that thought it would be high generally argued that the heightened visibility of new enforcement efforts in Arizona and elsewhere, coupled with the failure of Congress to pass an amnesty for illegal immigrants, would cause Hispanics to turn out in large numbers to express their dissatisfaction. Others argued that turnout would be low because of the failure to deal with the immigration issue. The new data from the Census Bureau show that neither was the case.
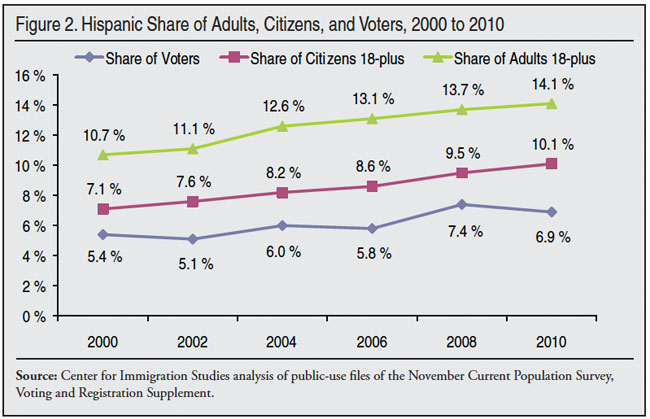
Figure 1 shows participation rates for Hispanics, non-Hispanic whites, and non-Hispanic blacks from 2000 to 2010. Figure 1 shows that Hispanic participation in 2010 looked very much like it did in other recent off-year elections. The share of eligible Hispanics who voted was a little less than one-third, as it had been in 2006 and 2002. Figure 2 reports the Hispanic share of adults, as well as their share of adult citizens and their share of the overall vote. Figure 2 shows that while lower than in the 2008 presidential elections, the Hispanic share of the vote total was higher than in 2002 and 2006.


The Hispanic share of the vote will continue to slowly and steady increase. In November 2010, the Census Bureau data used for this report show that Hispanics were 16.3 of the total U.S. population, 14.1 percent of the adult population, and 10.1 percent of the adult citizen population. Their relatively low 6.9 percent of the total electorate in 2010 reflects in part the larger share of Hispanics who are under age 18 and the large share of adults who are not U.S. citizens (34.4 percent). These two facts coupled with their relatively low participation rate among eligible voters explain why Hispanics represent such a modest fraction of the overall electorate relative to their share of the total U.S. population. Among those eligible to vote in 2010, 48.6 percent of eligible non-Hispanic whites voted, as did 44 percent of non-Hispanic black voters.4
Table 1 reports the size and percentage of racial ethnic groups in the 2010 election. In addition to the 6.9 percent of voters who identified as Hispanic in the 2010 election, 77.5 percent of voters identified as non-Hispanic white, 11.5 percent as non-Hispanic black (single race), 2.4 percent identified as non-Hispanic Asian, and .5 percent identified as non-Hispanic American Indian. The remaining 1.3 percent of voters identified as mixed race. Figure 2 and Table 1 make clear that the Hispanic share of the electorate is steadily increasing; but it is still a relatively modest share of the total. Using the 2010 election as an example, the white electorate was 11 times larger in 2010 than the Hispanic electorate. This means that 1 percent of the white electorate equals 11 percent of the Hispanic electorate. Or put a different way, if a national candidate increased his or her share of the Hispanic vote by 11 percentage points, but in the process lost one percentage point of the white vote, there would no net gain in votes. Although the overall Hispanic population is now significantly larger than the overall black population, the black electorate is still much larger. In 2010, the black electorate was 64 percent larger than the Hispanic electorate.

Table 2 reports the Hispanic share of the vote for 2010 by state. The size of the Hispanic vote varied significantly by state. Hispanic voters are concentrated in a handful of states. The five states (California, Texas, Florida, New York, and Arizona) with the largest number of Hispanic voters, accounted for 73 percent of all Hispanic voters in 2010. Of these, only Florida is generally regarded as a battleground state. As a share of voters, Hispanics were more than 30 percent of the 2010 vote in New Mexico and were between 10 and 20 percent of the vote in California, Arizona, Texas, and Florida. Of these, Florida and New Mexico are traditional battleground states in many elections. There were six states (Nevada, New York, Colorado, New Jersey, Hawaii, and Illinois) in which Hispanics were between 5 and 10 percent of the electorate in 2010. Of these, Nevada and Colorado are often considered battleground states. In most of the other traditional battleground states such as Ohio, Wisconsin, Iowa, West Virginia, Virginia, North Carolina, Pennsylvania, Missouri, and New Hampshire, Hispanics are a small fraction of voters.

Methods and Data
The data for this analysis come from the Voting and Registration Supplement of the Current Population Survey (CPS) collected by Census Bureau, which contains about 100,000 adults. The Voting and Registration Supplement is conducted in November every other year after Election Day. The public-use file of this data was recently released. Among other questions, the survey asks individuals if they are registered to vote and if they voted. The Hispanic and race questions are separate. Hispanics are individuals in the CPS who self-identify as Hispanic or Latino, which means that they or their ancestors come from a country that derives its language and culture from Spain.
End Notes
1 See “Latinos and the 2010 Elections: Strong Support for Democrats; Weak Voter Motivation,” http://pewresearch.org/pubs/1752/poll-latinos-and-the-2010-midterm-elect...
2 CNN exit polling for 2010 can be found at http://www.cnn.com/ELECTION/2010/results/polls/#USH00p1. Exit polling for 2006 can be found at http://www.cnn.com/ELECTION/2006/pages/results/states/US/H/00/epolls.0.html. Figures for 2006 and 2010 are for the House of Representatives, as this in the only election that takes place throughout the country in off-year elections. In the 2008 presidential election, CNN reported that Obama received 67 percent of the Hispanic vote while McCain received 31 percent. See http://www.cnn.com/ELECTION/2008/results/polls/#USP00p1.
3 See “The Hispanic Vote in the Upcoming 2010 Elections,” http://www.cis.org/hispanic-vote-pre-2010.
4 All racial figures in this report are for persons who chose a single race.
