Steven A. Camarota is the director of research and Karen Zeigler is a demographer at the Center.
The labor force participation rate — the share working or looking for work — of U.S.-born men has declined dramatically since the 1960s, particularly for those without a bachelor’s degree. While participation has roughly returned to pre-pandemic levels, the rate in 2019 was extremely low by historical standards. This is relevant to the immigration debate because one of the arguments for allowing in so many legal immigrants, or even tolerating illegal immigration, is that the low unemployment rate, along with the aging of the U.S. population, means there are not enough workers. But this ignores the enormous increase in the number of working-age people not in the labor force who do not show up as unemployed because they are not actively looking for work. Further, being out of the labor force is associated with a host of profound social problems, from crime and social isolation to overdose deaths and welfare dependency. Policy-makers should consider encouraging work among the millions on the economic sidelines rather than ignoring the problem and continuing to allow in large numbers of immigrants.
Excel sheets with detailed labor force participation statistics can be found here.
- Traditionally labor force participation — the share working or at least looking for work — of men is higher than it is for women. While still true, the share of U.S.-born, working-age men in the labor force has declined for six decades. Participation of U.S.-born women peaked in 2000, but has declined some since, particularly for those without a bachelor’s.
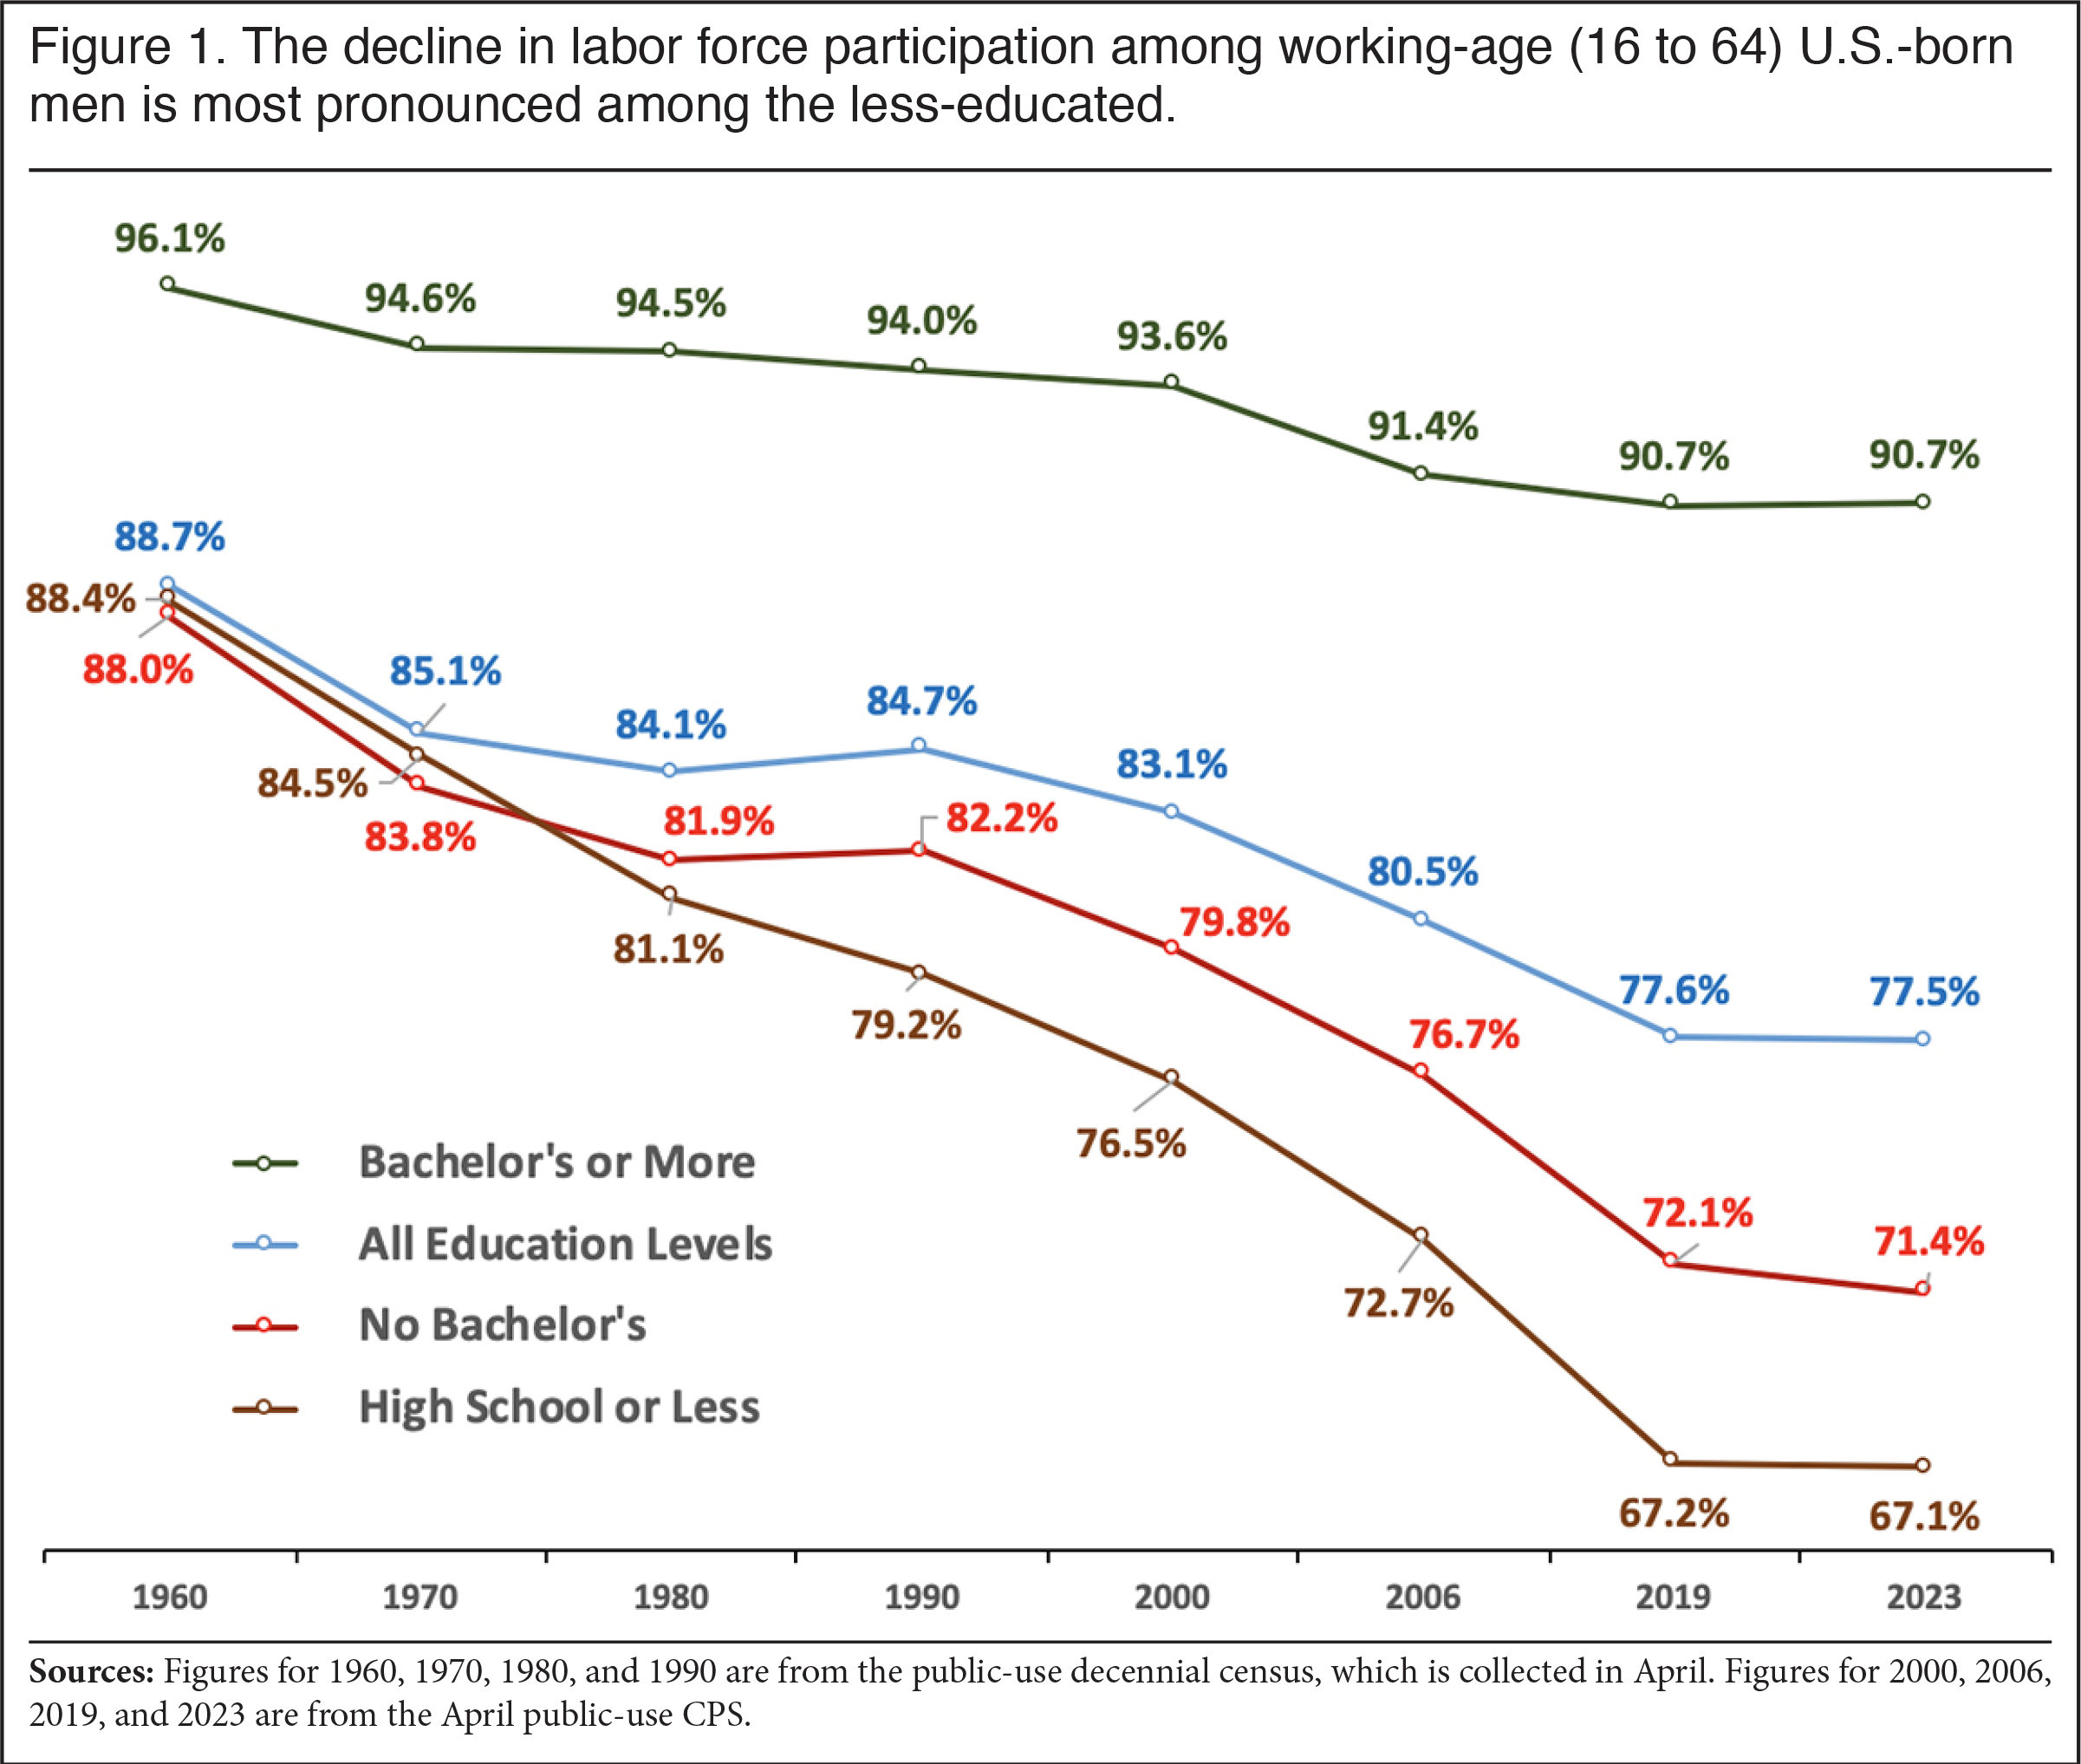
- Using a broad definition of working age (16 to 64), the share of U.S.-born men in the labor force was 77.5 percent in April 2023, nearly the same as in 2019, pre-Covid. But this is significantly lower than the 83.1 percent in April 2000 and the 88.7 percent in 1960.
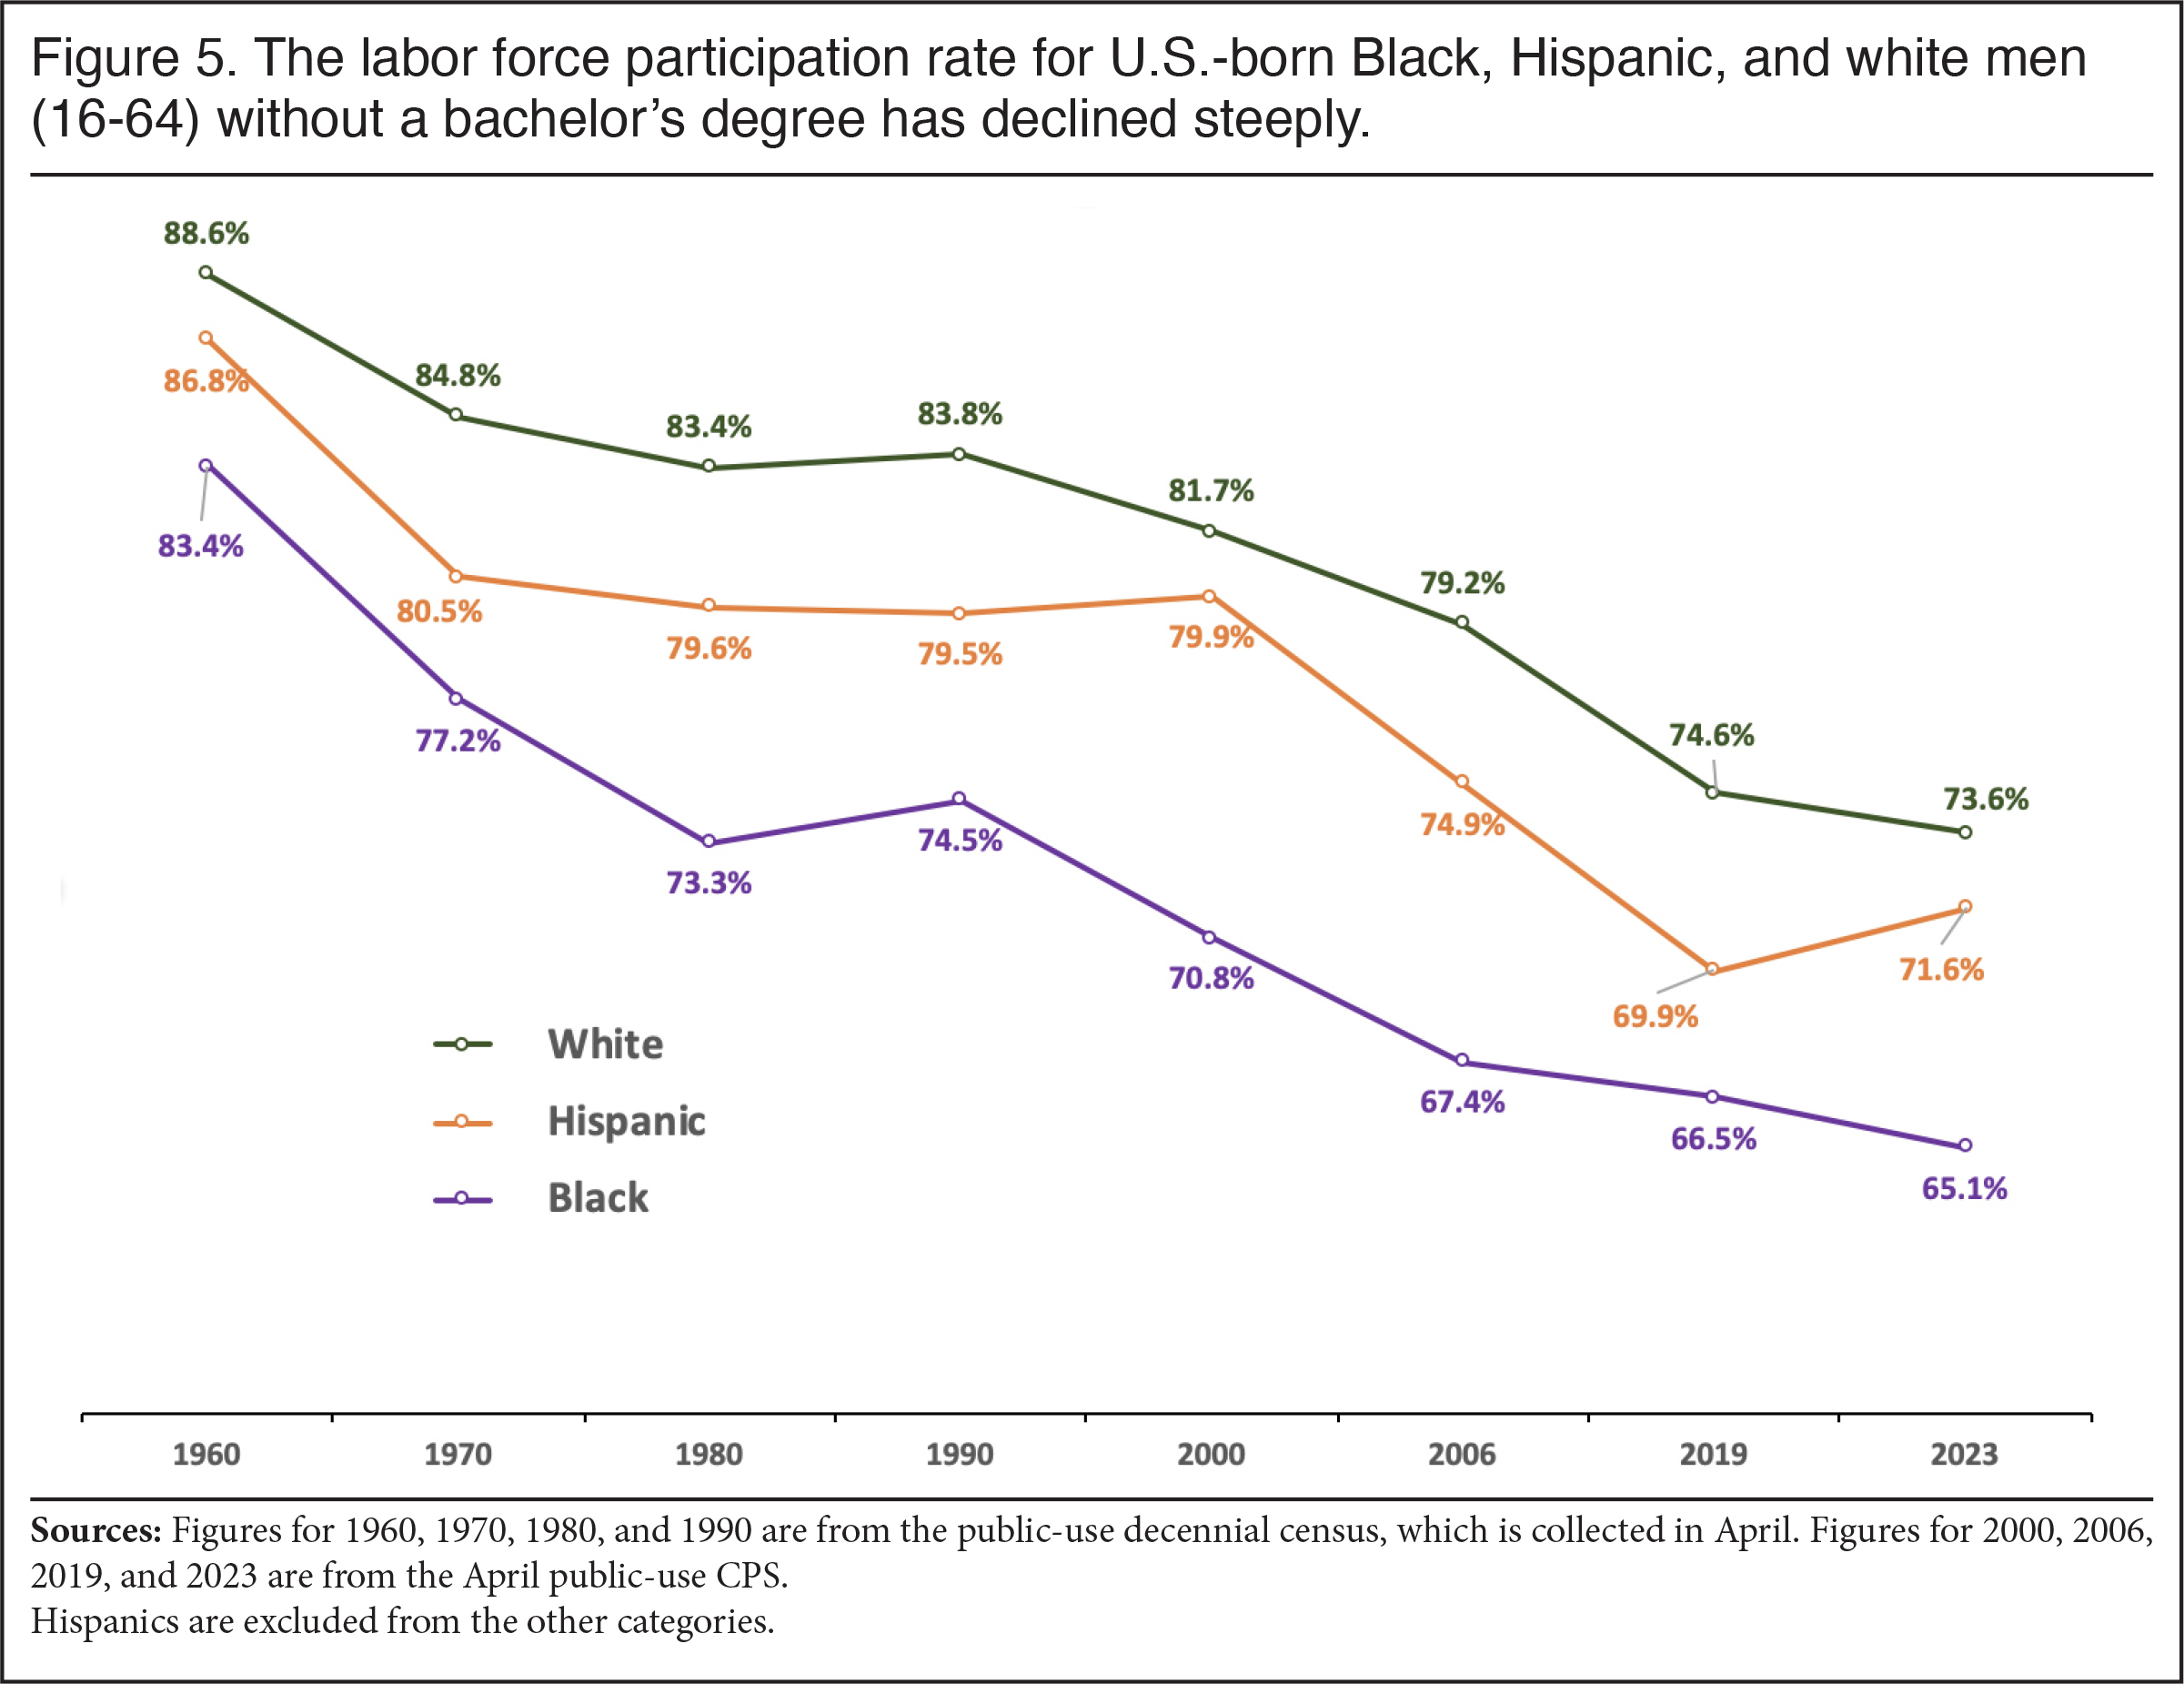
- While the participation for U.S.-born Black men has been lower than U.S.-born white and Hispanic men for decades, the rate for all three groups has fallen significantly since the 1960s.
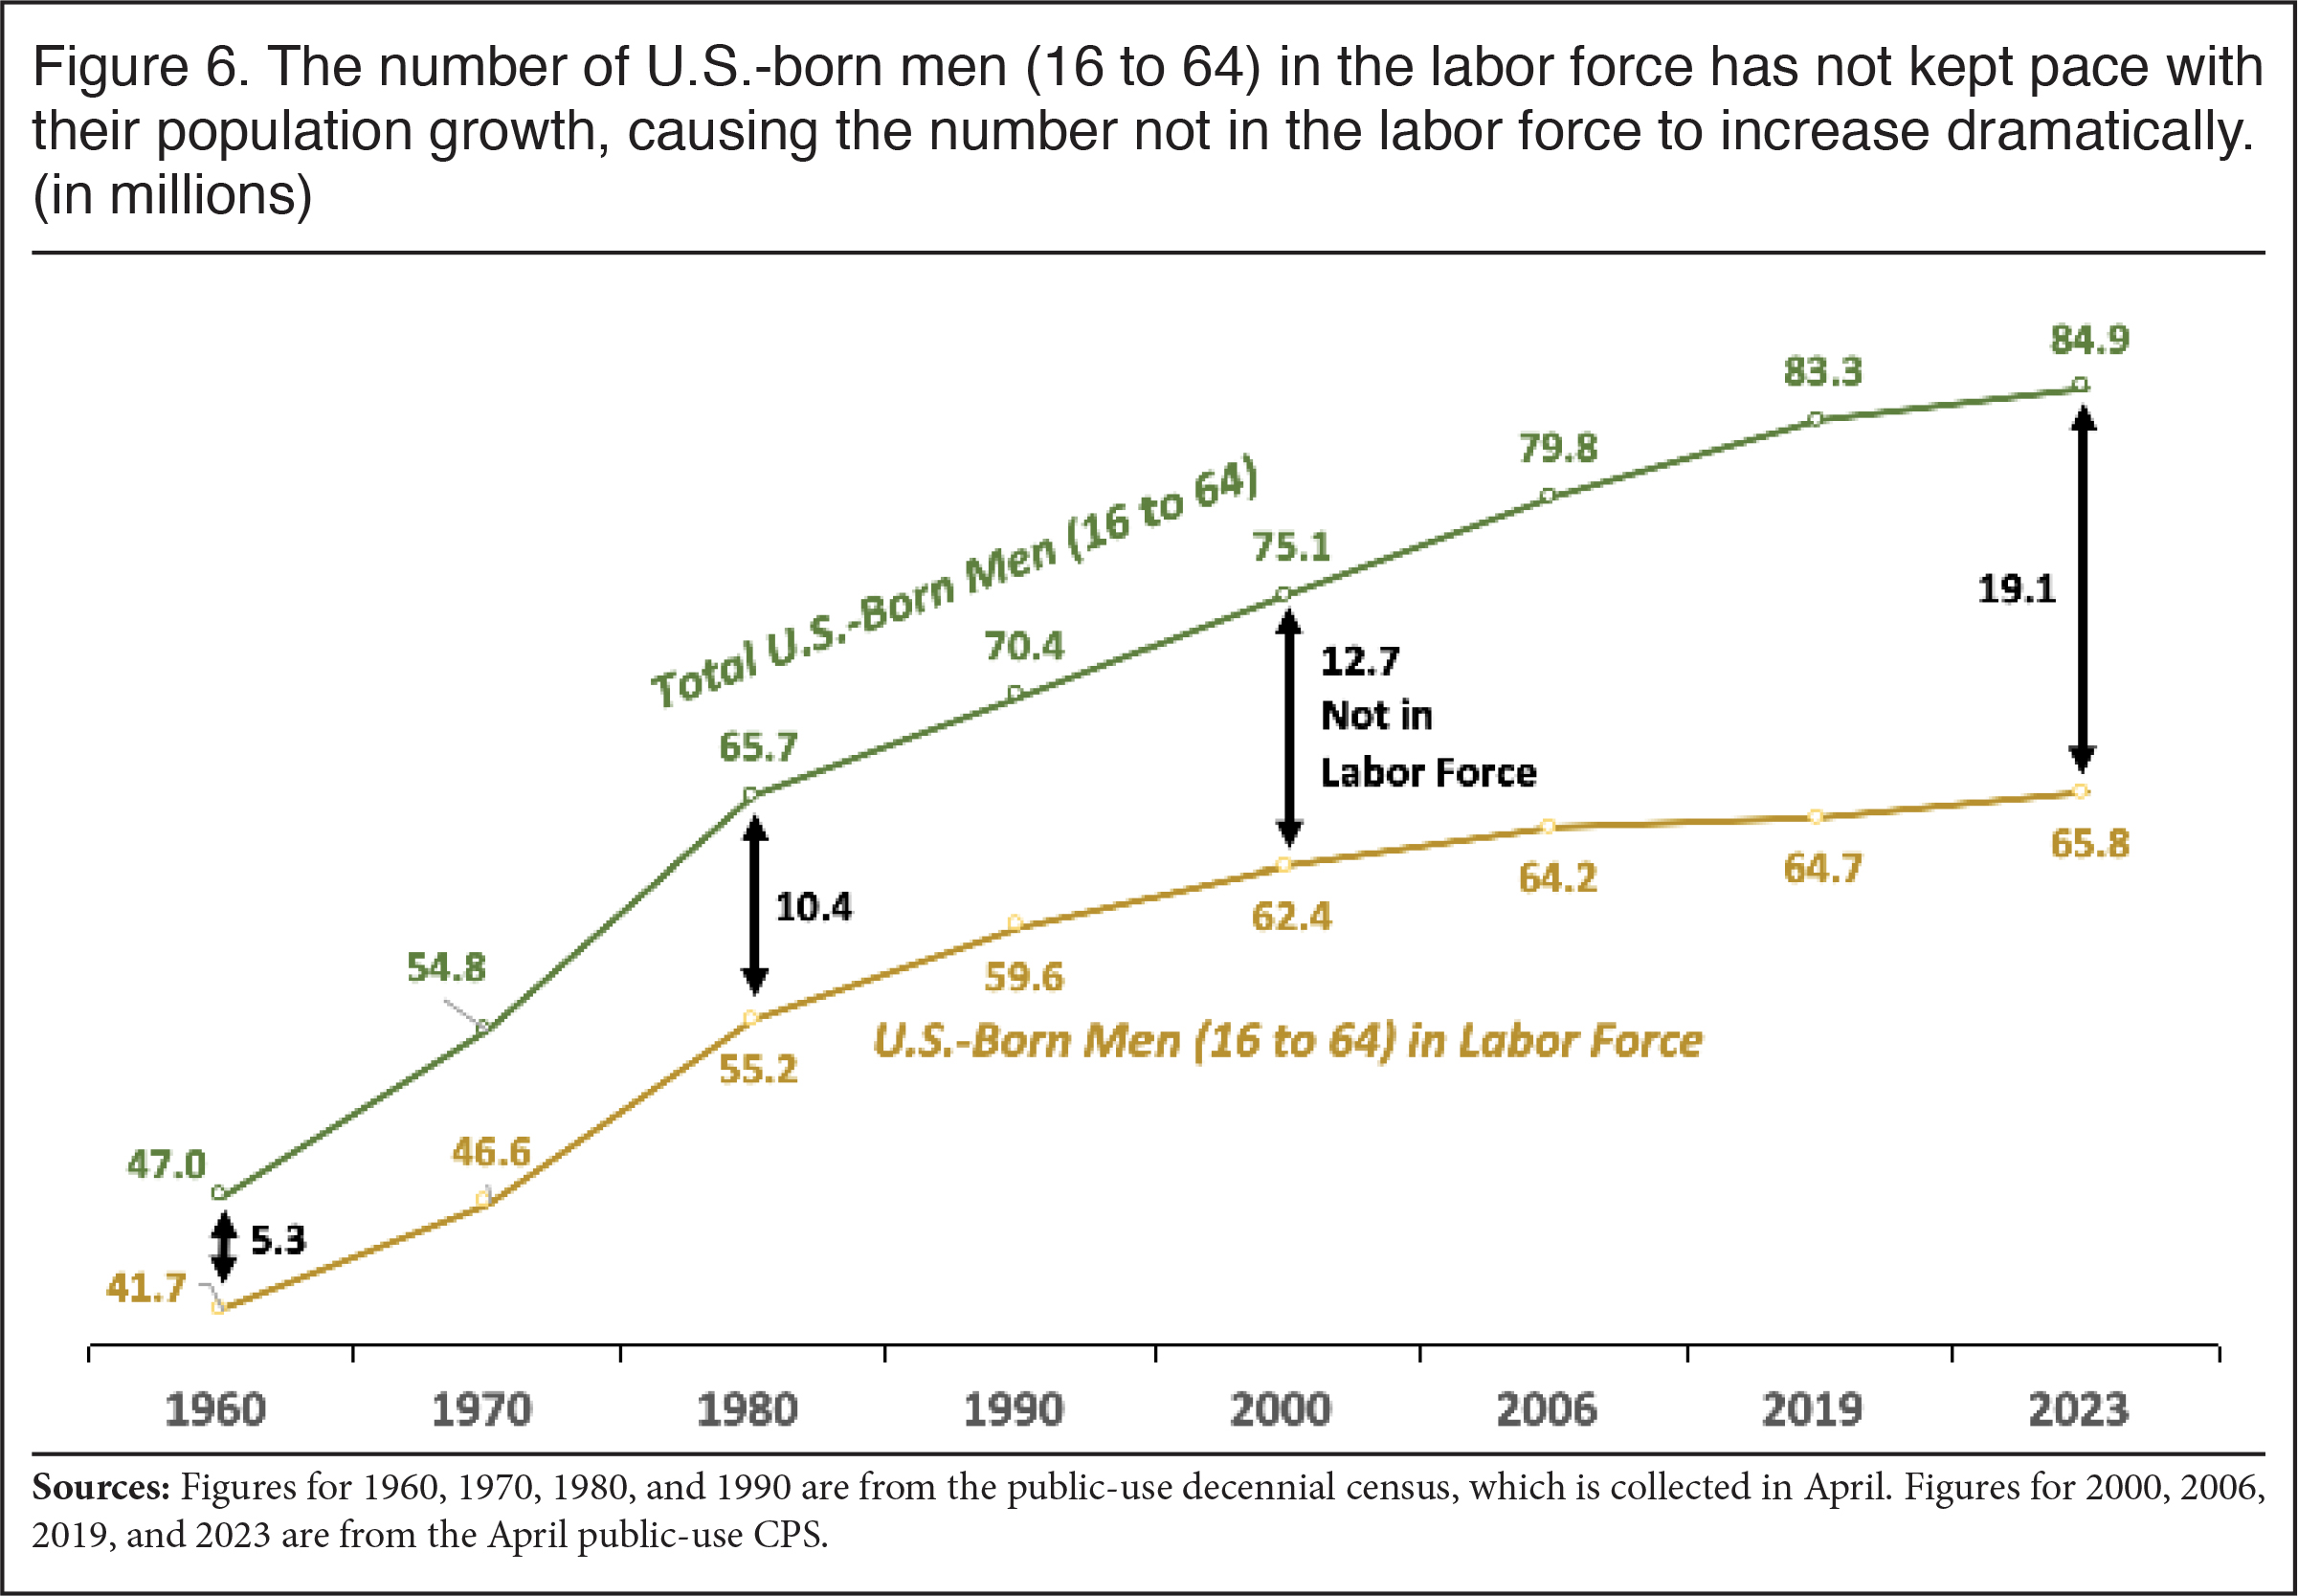
- If the same share of U.S.-born men (16 to 64) were in the labor force in 2023 as in 1960 there would be 9.5 million more U.S.-born men in the labor force. Even if the share returned to the 2000 level, it would still add 4.8 million men to the labor force.
- The number of U.S.-born men (16 to 64) not in the labor force increased by 13.8 million from 1960 to 2023. At the same time the number of working-age immigrant men in the labor force increased by 13.7 million.
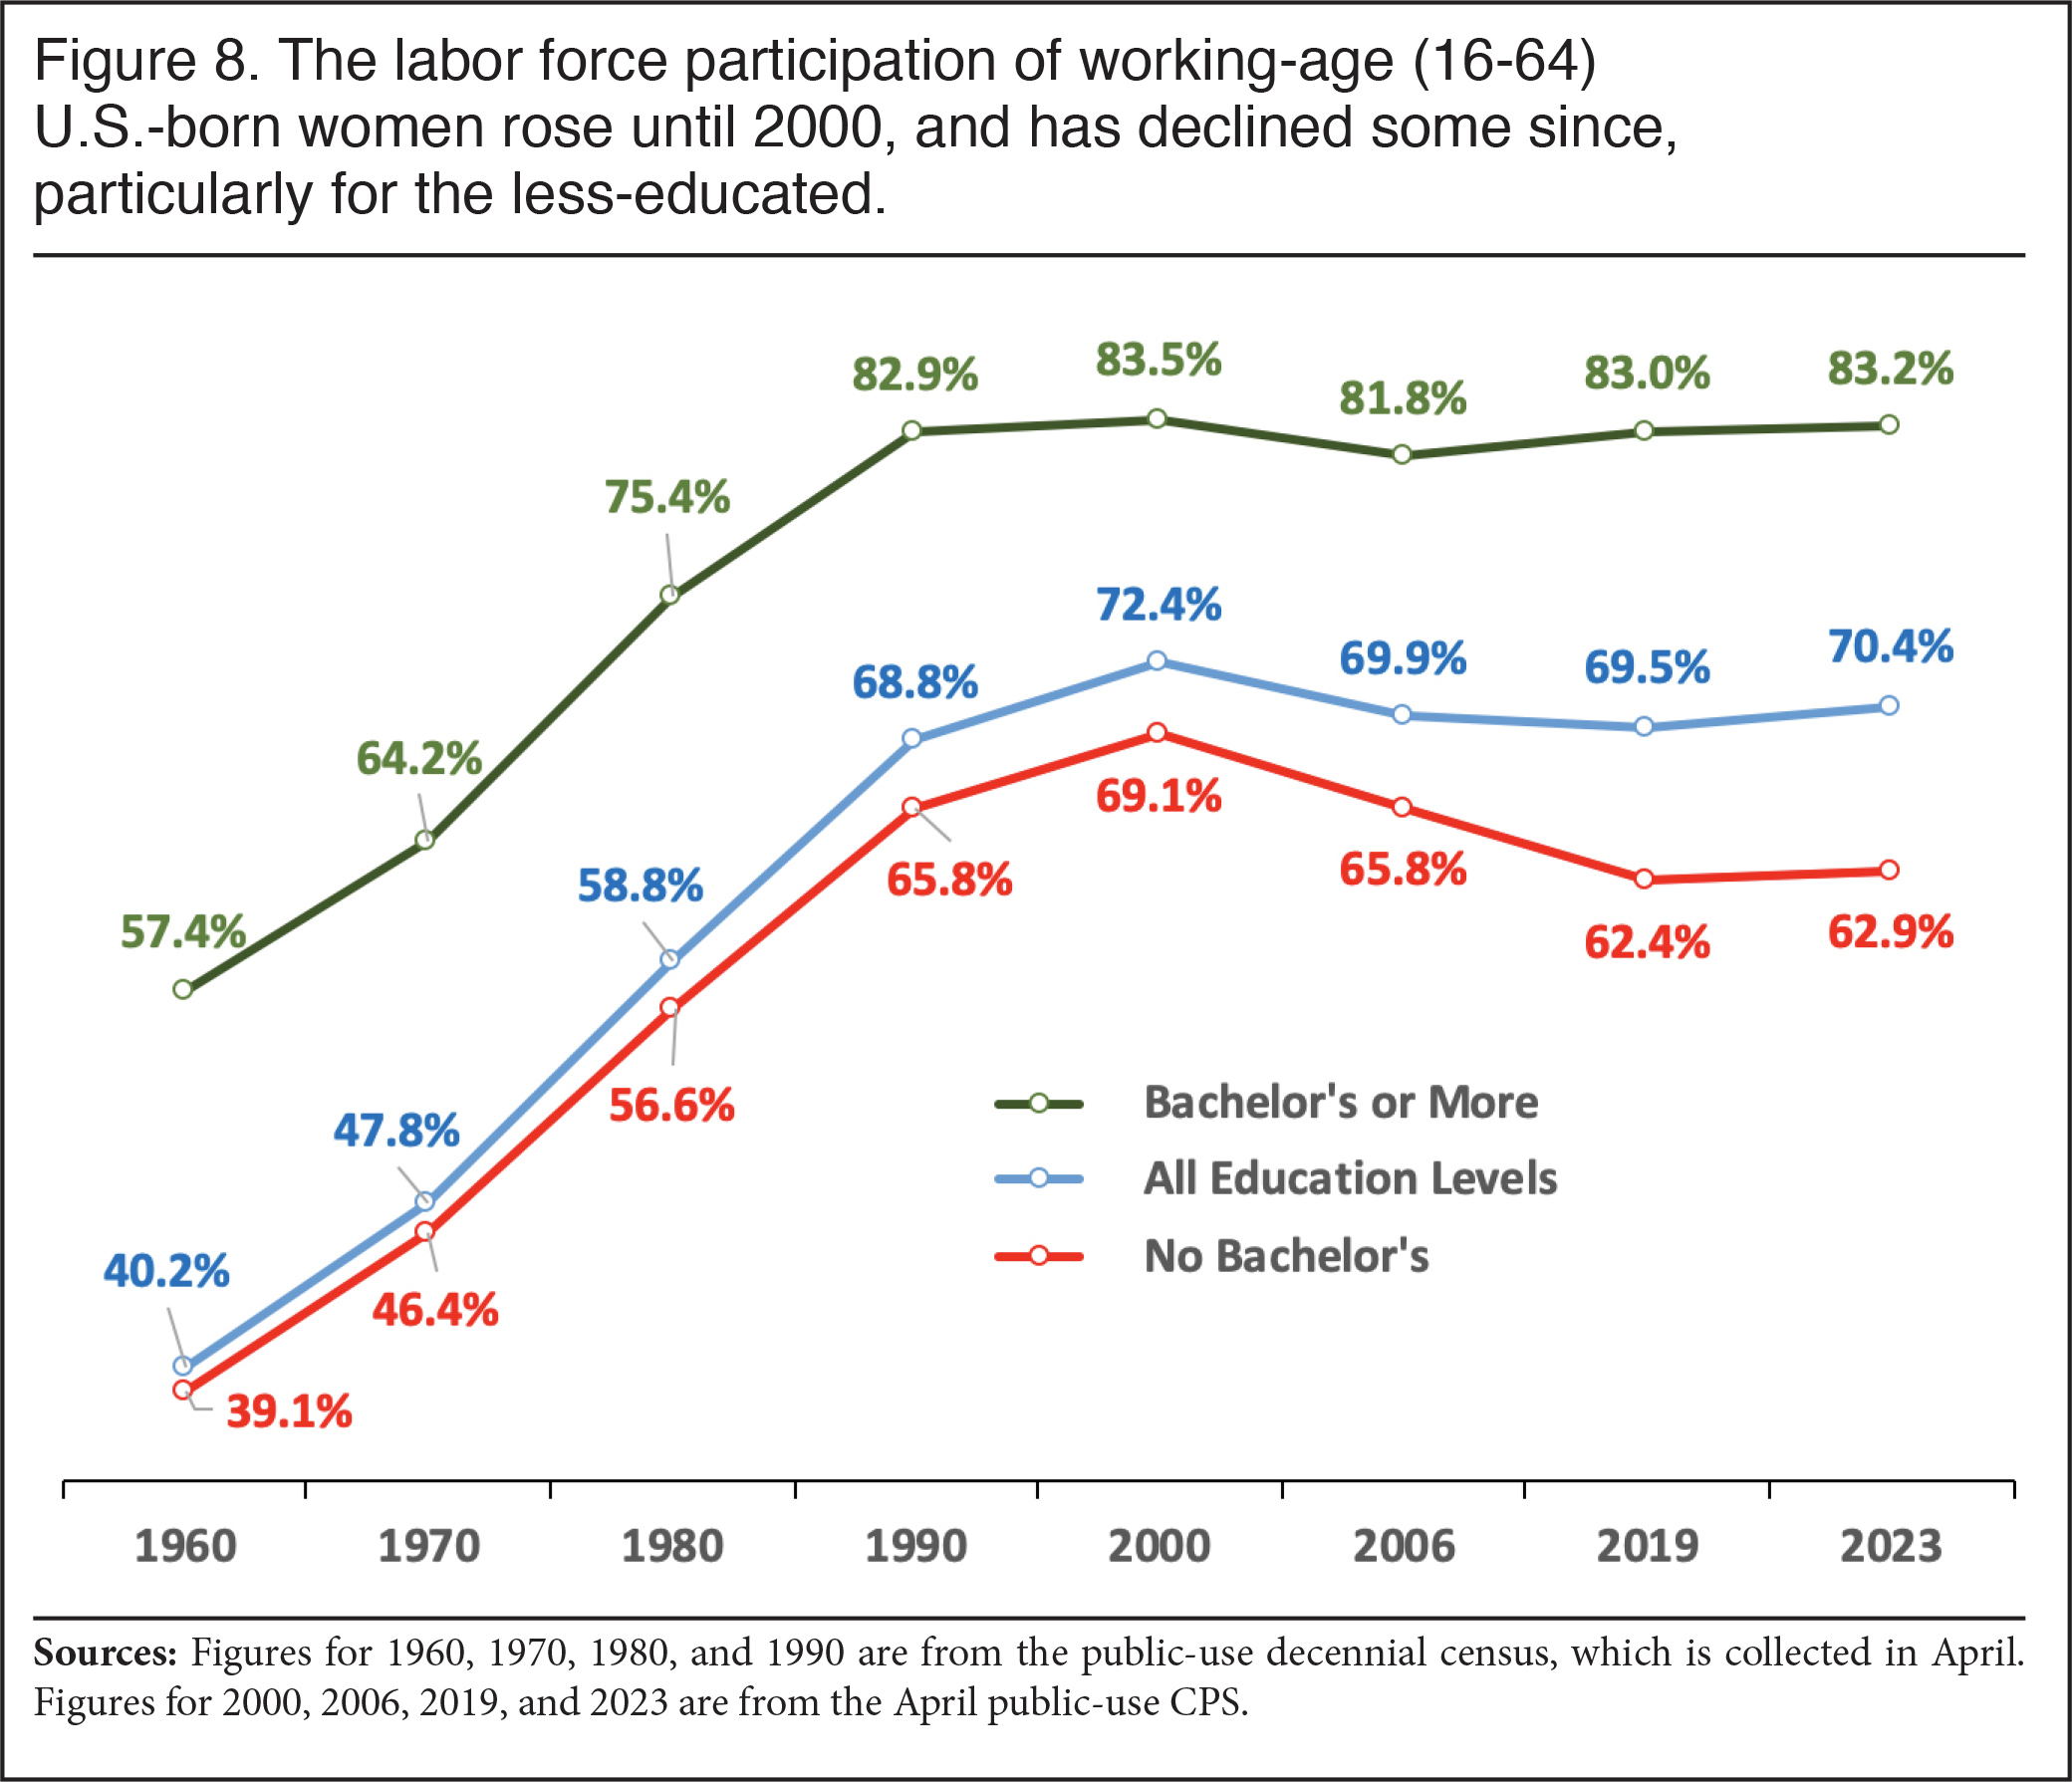
- In April of this year, 70.4 percent of U.S.-born women (16 to 64) were in the labor force, similar to the level pre-Covid, but below the peak of 72.4 percent in 2000. If the same share of U.S.-born women were in the labor force in 2023 as in 2000, it would add 1.7 million more women to the labor force.
- Reflecting declining participation and population growth, the number of U.S.-born men and women (16 to 64) not in the labor force was 44.3 million in April 2023 — nearly 10 million more than in 2000. This does not include the 9.1 million immigrant men and women not in the labor force. It also does not include the more than five million immigrant and U.S.-born unemployed.
- Labor force participation for working-age immigrant men has not declined in the way it has for U.S.-born men, whereas the rates for female immigrants, while still lower than U.S.-born women, has increased steadily for decades.
Among those without a bachelor’s:
- Excluding teenagers, the share of U.S.-born men 20 to 64 without a bachelor’s shows a decline in labor force participation from 93 percent in 1960 to 87 percent in 1980, 84.1 percent in 2000, and 77.3 percent in April of this year.
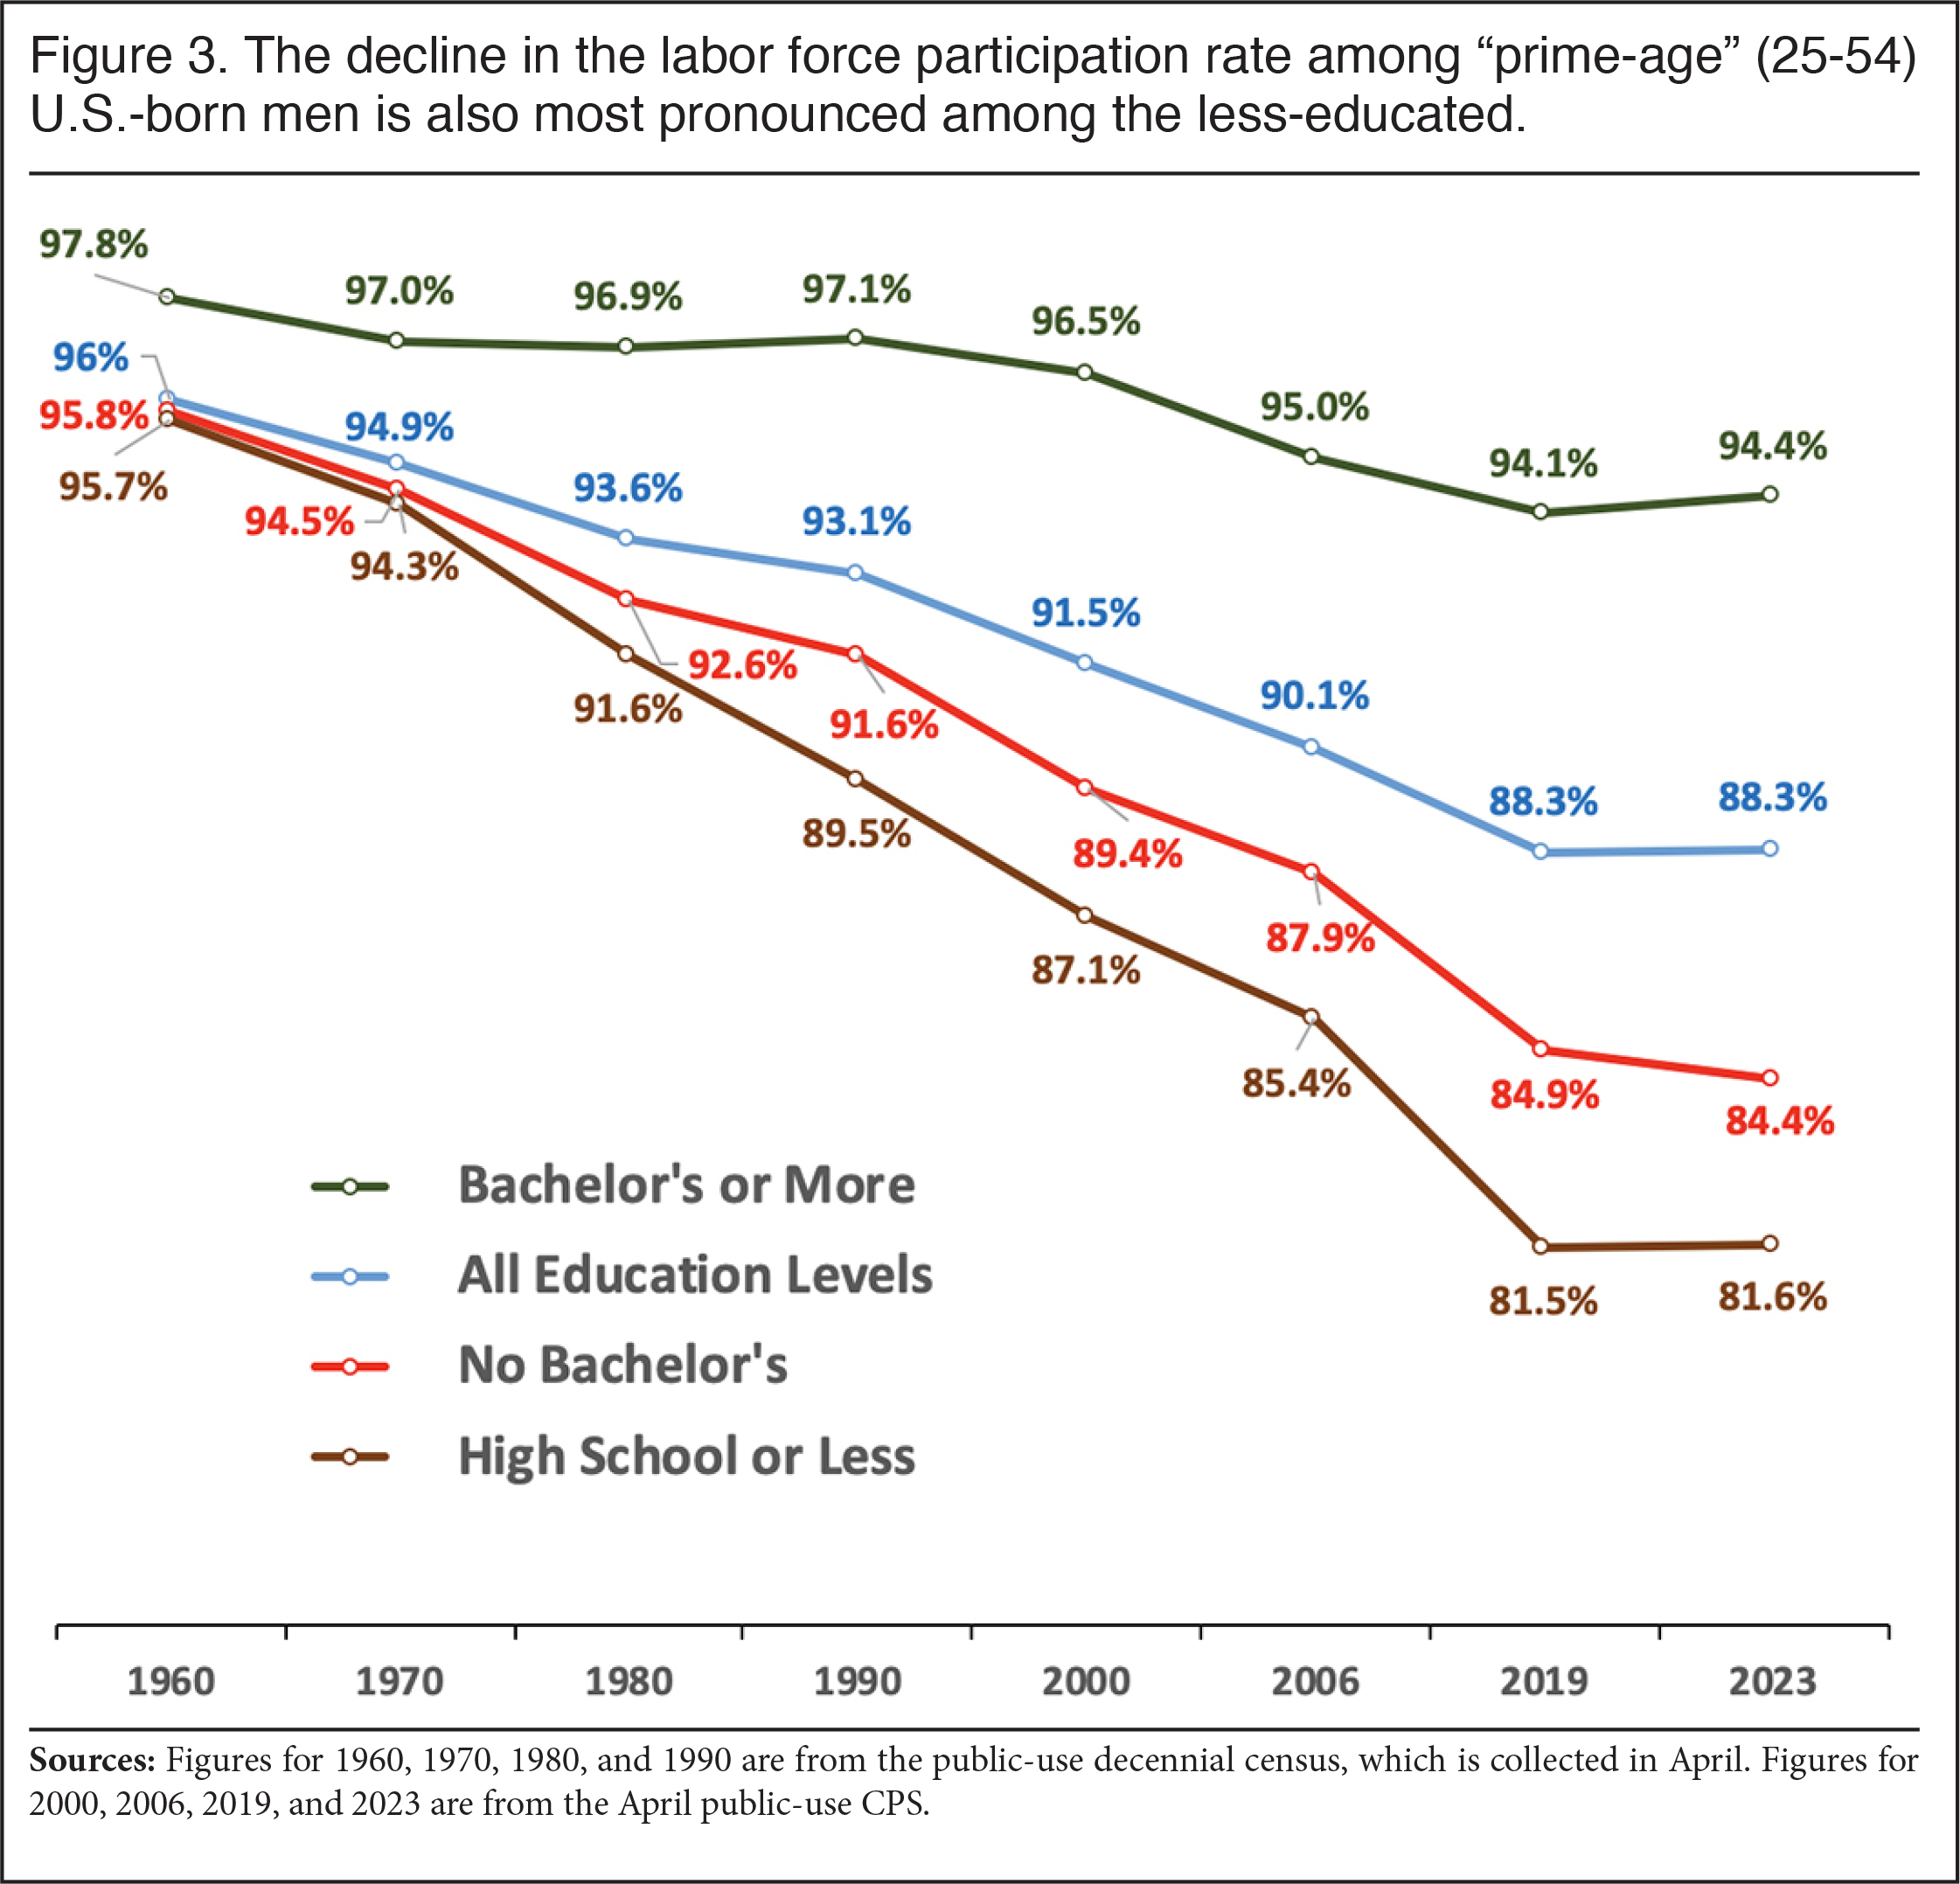
- Looking only at “prime-age” U.S.-born men, 25 to 54, without a bachelor’s, we see a decline from near universal labor force participation of 95.8 percent in 1960 to 89.4 percent in 2000, to just 84.4 percent in April 2023.
- The labor force participation of U.S.-born women (20 to 64) without a bachelor’s peaked at 71.7 percent in 2000, but was only 67.6 percent in April of this year.
- Male immigrants (20 to 64) without a bachelor’s have not been entirely immune from labor force decline. After peaking at 89 percent in 2006, before the Great Recession, their rate was 85.8 percent in April 2023.
Introduction
The purpose of this analysis is to address the often-asked question of where workers could come from to fill jobs in the economy if not for large-scale immigration. In a series of reports, based on quarterly data from the monthly Current Population Survey (CPS), the Center for Immigration Studies has tried to answer that question by looking at the labor market situation for the U.S.-born and immigrants. Those reports show a profound decline in the share of working-age U.S.-born Americans in the labor force since 2000 and, as a result, an enormous number of working-age people on the economic sidelines. Those in the labor force are working (full- and part-time) or looking for work; those outside the labor force are not working and are not counted as unemployed because they are not actively looking for a job.1 In contrast to our prior reports, this analysis uses decennial census data, along with CPS data, to examine labor force participation going all the way back to 1960. The findings show that the decline in labor force participation for U.S.-born men is even more pronounced when we look back six decades. Like other researchers, we exclude those in institutions (primarily prisons and jails), and we focus on men because, unlike women, men have not been heavily impacted by the profound social, cultural, and legal changes that caused an ever-larger share of women to join the labor force in the last 60 years. Of course, we also report figures for women.
Historical census data has the advantage of allowing us to look at labor force participation by nativity, which is not really possible with the CPS before 1994.2 However, the decennial census no longer asks about citizenship and it only provides information every 10 years. Moreover, census years do not necessarily correspond to peak years of labor force participation between recessions, which is typically the best way to look at the long-term decline.3 Nonetheless, census data is really the only nativity data going back decades. We use the 1960 through 1990 censuses and from 2000 onward we use the April CPS to examine labor force participation in the peak years of 2000, 2006, 2019, and 2023.4 To supplement this data, we also report statistics for every year going back to the early 1960s using the Annual Social and Economic Supplement of the CPS (CPS ASEC). The CPS ASEC is done annually, oversamples minorities, and is somewhat larger than the monthly CPS, making it ideal to measure immigrants, but it does not include nativity information until 1994 and the most recent version is from 2022.5
We use the term “immigrant” in this report synonymously with “foreign-born”. This includes all those who were not U.S.-citizens at birth, including illegal immigrants.6 Also our discussion of the labor force participation rate is only for those of working age, which we define in various ways, but always excludes children under age 16 and those 65 and older. In contrast, the Bureau of Labor Statistics (BLS) reports a labor force participation rate for the population 16 and older in its monthly employment situation reports. Including the elderly can make sense depending on the research question, but doing so conflates the decline in participation among the working-age with the overall aging of American society.
Why Labor Force Participation Matters
Labor Force Participation in the Context of Immigration. The cacophony of voices calling for ever more immigration because there are not enough workers includes numerous academics, business groups, politicians, and a plethora of opinion writers. Immigration advocates typically point to low unemployment, the aging of society, or more technical measures of the number of unfilled jobs to make the case that the supply of workers is inadequate and more immigration is needed. What is perhaps most striking about virtually all of this advocacy and commentary is that the massive decline in labor force participation never even comes up. This, despite the fact that the fall-off in participation is well documented and the number of working-age people currently not in the labor force is in the tens of millions. Any discussion of the need for more foreign workers should be conducted with an understanding of the enormous number of working-age people not working. This is especially the case because there is a clear consensus that the decline in labor force participation has detrimental effects.
The list of negative outcomes for individuals, their families, and society associated with being out of the labor force is so long that it can barely be summarized here. The issue has been extensively studied by academics, the Brookings Institution, the Obama White House, the Federal Reserve, and many others. Probably the best book on the subject is Nicholas Eberstadt’s Men Without Work. There simply is no question that the long-term decline in labor force participation among working-age people, particularly men, contributes to a long list of profound social problems.
Impacts at the Individual Level. It should be obvious that being in the labor force significantly increases income and dramatically reduces the risk of being in poverty.7 There is also good evidence that not working is associated with a deterioration in mental health. In addition, being out of the labor force is linked with declining physical well-being. Research shows that not working has a negative effect on the incidence of obesity and the associated health problems this creates. Perhaps most important, there seems to be a strong association between not working and so-called “deaths of despair”, including suicide, drug overdose, and destructive levels of alcohol consumption and death from poisoning.
Societal Impacts. Research by the Federal Reserve shows that low labor force participation reduces economic growth. Not surprisingly, both the Congressional Budget Office and Obama White House pointed out that declining labor force participation has negative fiscal implications, as fewer people pay taxes and more make use of public benefits.8 Men not in the labor force also make relatively unattractive marriage partners, so low participation hinders family formation. Additionally, more than one study has found that not being employed is associated with social isolation. In contrast, being in the labor force leads to greater political participation and civic engagement. There are a significant number of studies showing a link between not working and crime. The bottom line is that working is not simply bad for those out of the labor market, it has significant negative implications for their families and the broader American society.
Findings
In the analysis that follows, we discuss the results shown in the figures, which summarize our findings. However, also we provide Excel spread sheets for those wanting more detailed information. This Excel file reports more detailed labor force participation information by nativity, gender, education level, and race using different definitions of the working age in the peak (or near-peak) years of 1960, 1970, 1980, and 1990 based on the census and the April CPS for 2000, 2006, 2019, and 2023. The census and April CPS data are the sources for Figures 1 through 10 and Figure 13 in this report. We also include in the Excel file detailed labor force participation rates by age, race, and education level from 1962 to 2022 for every year using the CPS ASEC. This data is the source for Figures 11 and 12.9 We focused on working-age natives without a bachelor’s degree for simplicity, rather than the various education levels that comprise this group. We often refer to those without a bachelor’s as the “less-educated”. The Excel files included in this report and our prior research show that all education levels that comprise this group, such as high school dropouts and those with only a high school education, have experienced a similar decline in labor force participation.10
The Decline in Labor Force Participation for U.S.-Born Men. Figure 1 reports the share of working-age, U.S.-born men in the labor force, with working age defined broadly as 16 to 64. The figure shows that labor force participation has fallen for six decades for U.S.-born men. Overall, the share of men born in the United States working or looking for work was 11.2 percentage points higher in 1960 than in 2023. Even compared to 2000, it was nearly six percentage points higher than today. If we look at only those with no education beyond high school, then the decline is 21.3 percentage points since 1960. For men without a bachelor’s degree, the decline is 16.6 percentage points from 1960 to 2023. Since 2000, the decline for those with no education beyond high school is 9.5 percentage points, which is very similar to the 8.4 percentage-point decline for the larger group of those without a bachelor’s. All of these changes are very large because they represent millions of people on the sidelines of the economy. Figure 1 also shows some decline among those with at least a bachelor’s degree, though not so much recently.
 |
Looking at Different Age Groups. One might imagine that the decline in labor force participation for the working-age is only due to American teenagers working less. The increase in the number of Americans attending school, particularly college, may also explain the decline or perhaps the results reflect early retirement. But this is not what happened. Figure 2 excludes teenagers and shows the decline from 1960 to 2023 is still nearly 16 percentage points for U.S.-born men 20 to 64 without a bachelor’s degree. In fact, the percentage-point decline from 1960 to 2023 is quite similar for men with no education beyond high school and the larger group that includes all those without a bachelor’s. It is true that a larger share of Americans are in school, particularly those under age 25, today than in 1960 or even 2000. Of course, students then and now can and often still do work. But even if we restrict the analysis to only those 25 to 54, what economists often call the “prime age” for work, we still find the same pattern.
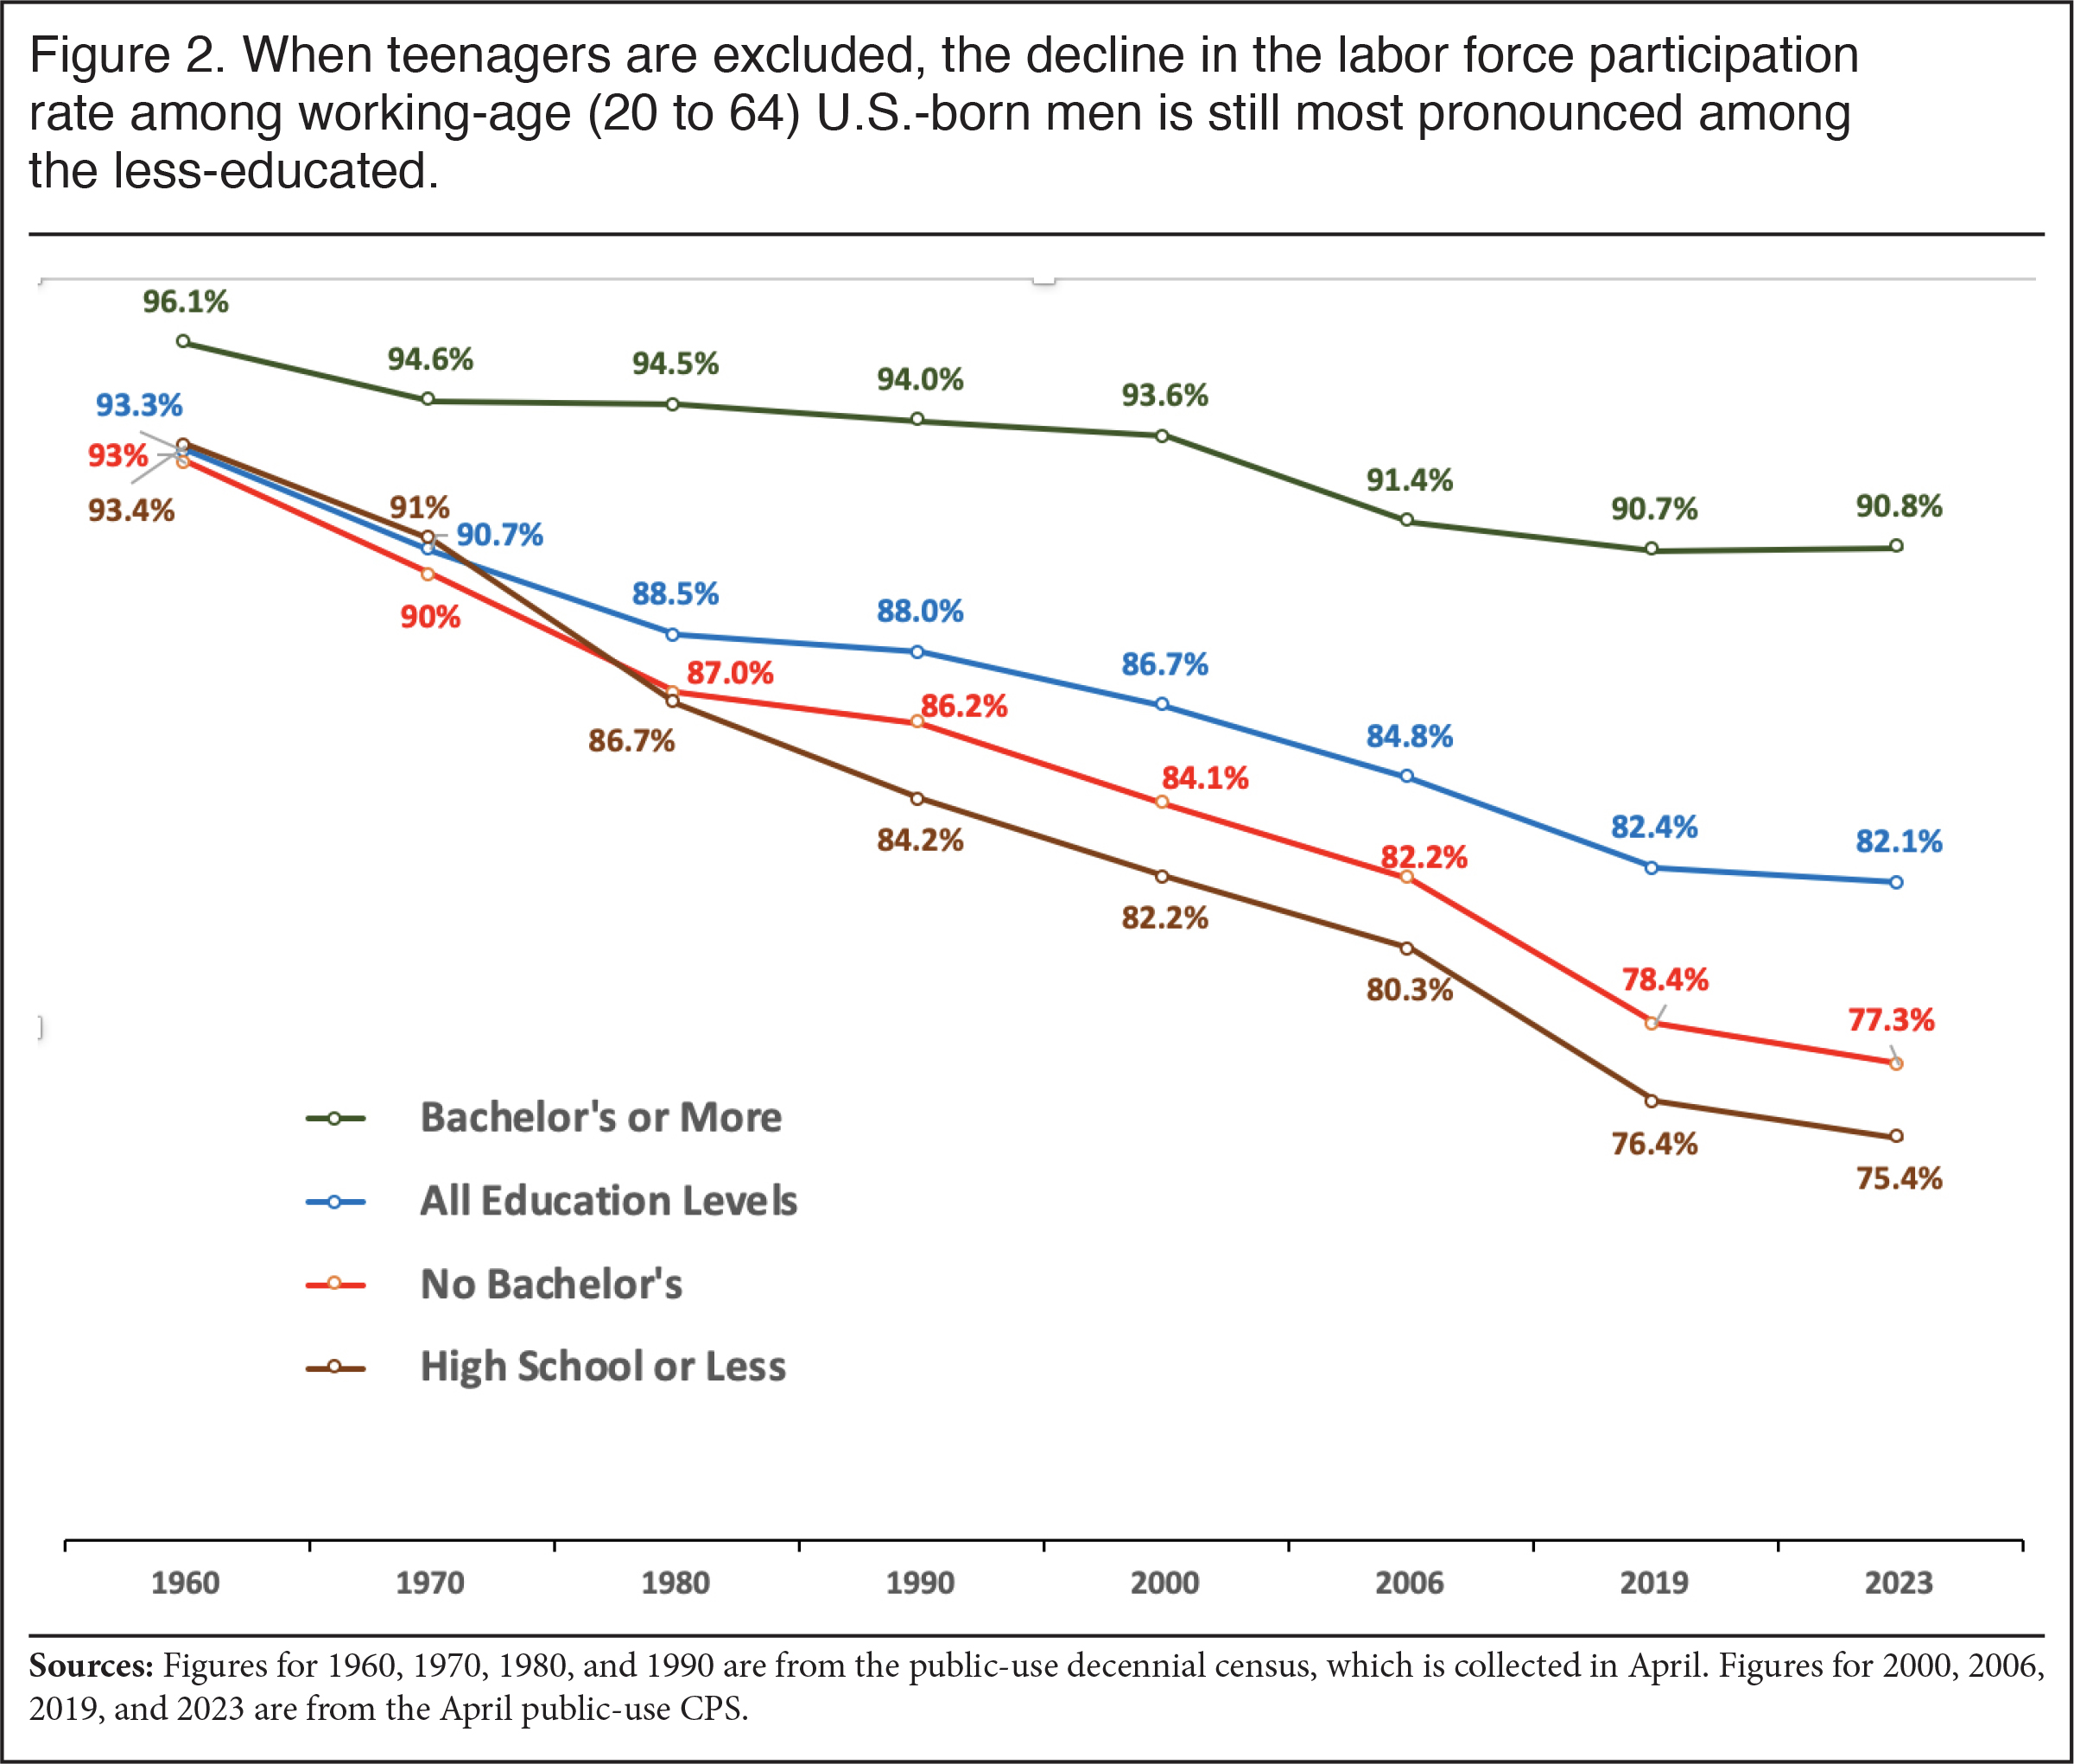 |
Figure 3 shows that labor force participation for prime-age, U.S.-born men was once nearly universal at 96 percent, and further there was not much difference between those with and without a college degree or even those with no education beyond high school. Since 1960, those with only a high school education declined somewhat more earlier on, but since 1980 the decline is similar for those with no education beyond high school (-10.1 points) and all those without a bachelor’s (-8.2 points).
 |
The Possibility of a “Creaming” Effect. The decline in the participation rate for the less-educated could be caused by the so called “creaming” effect. That is, the most academically oriented and employable part of the population now have college degrees, something that relatively fewer people had in the past. In 1960, 10 percent of men 20 to 64 had a college degree, by 2023 it was 35 percent; and among prime-age men it increased from 12 percent to 40 percent. So perhaps when we only look at those without a bachelor’s over time, we are really looking at the increasingly less employable part of the population. However, Figures 1 through 3 show that labor force participation for the entire working-age population, regardless of education, has declined. There can be no creaming when all workers are considered. Further, although not as pronounced, those with a college degree also show some decline in participation. So, while the very pronounced decline in participation for the less-educated specifically might be partly explained by creaming, it certainly cannot explain the overall decline. Nor does the creaming phenomenon mitigate all of the negative effects on society caused by declining participation.
It is worth adding that the significant increase in the share of working-age people with a college degree over the decades should have increased the overall labor force participation rate as more educated people tend to have higher participation rates, but the opposite happened. While increasing the education level of the U.S. population might be a good idea for any number of reasons, based on the last six decades it is unlikely to solve the overall problem of declining labor force participation among working-age men.
The U.S.-Born by Race. Figure 4 reports labor force participation for U.S.-born non-Hispanic Black, non-Hispanic white, and Hispanic men ages 16 to 64. There are some differences between groups, with Hispanics showing little change from 1970 to 2000, but a steep decline in the 1960s and in the last two decades. It is worth mentioning, however, that the way in which Hispanics are identified has changed over time and this is likely to have some impact on the data prior to 2000. Moreover, race is also not consistent over time because after 2000 the monthly CPS allows respondents to choose more than one race.11 Putting those issues aside, whites show the most consistent decline over the entire period. U.S.-born Blacks have the lowest labor force participation to begin with, but after 1970 their decline is very similar to whites so the gap between the two was relatively stable after that year after widening significantly in the 1960s. From 1960 to 2023, the Black participation rate declined 13.9 percentage points while it declined 12.6 and 9.3 points for Hispanics and whites, respectively. Clearly no group has been exempt from this extremely troubling social trend.
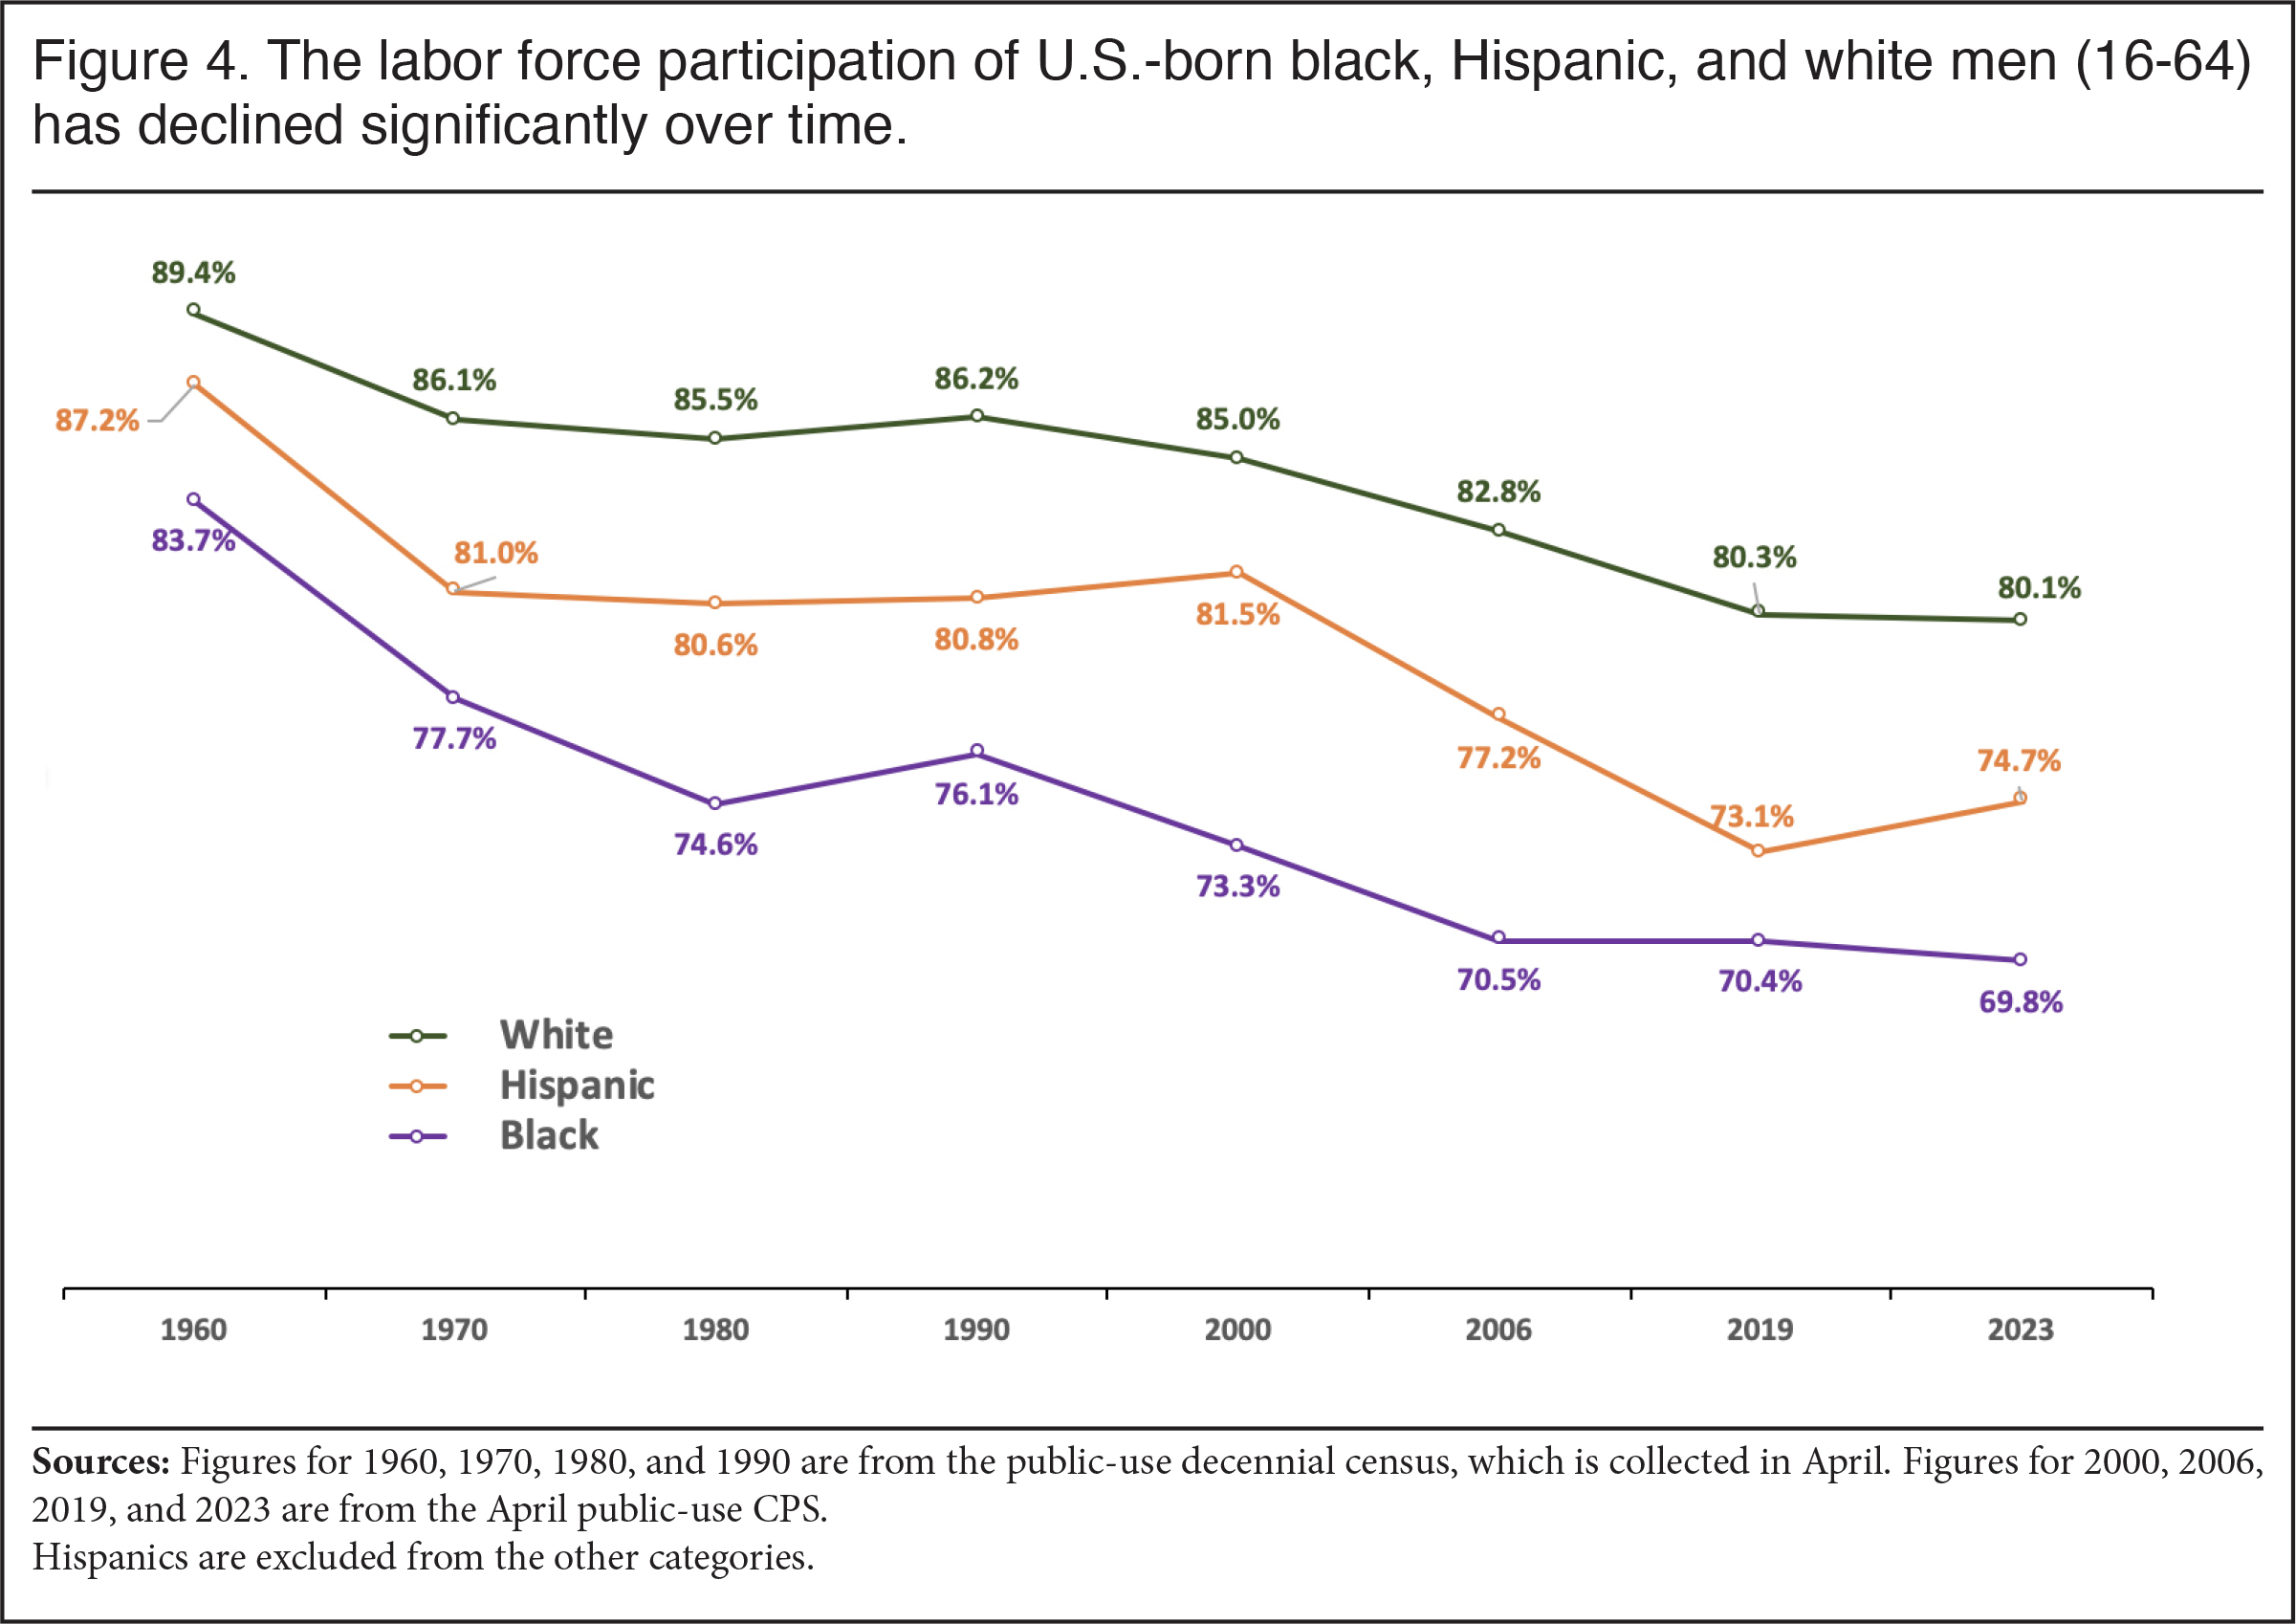 |
Figure 5 reports figures for U.S.-born men without a bachelor’s by race. As is true for Black men overall, participation for less-educated prime-age Black men was lower in 1960 than for whites and Hispanics and has remained so. The difference between Blacks on the one hand and whites and Hispanics on the other tended to widen over time. The decline in labor force participation for white and Hispanic men has been remarkably similar for six decades. Despite some difference between groups, the decline in labor force participation for less-educated, U.S.-born, prime-age men is profound for the three largest racial/ethnic groups in the United States. Again, some of the difference could be attributable to breaks in the continuity of the race and Hispanic variables.
 |
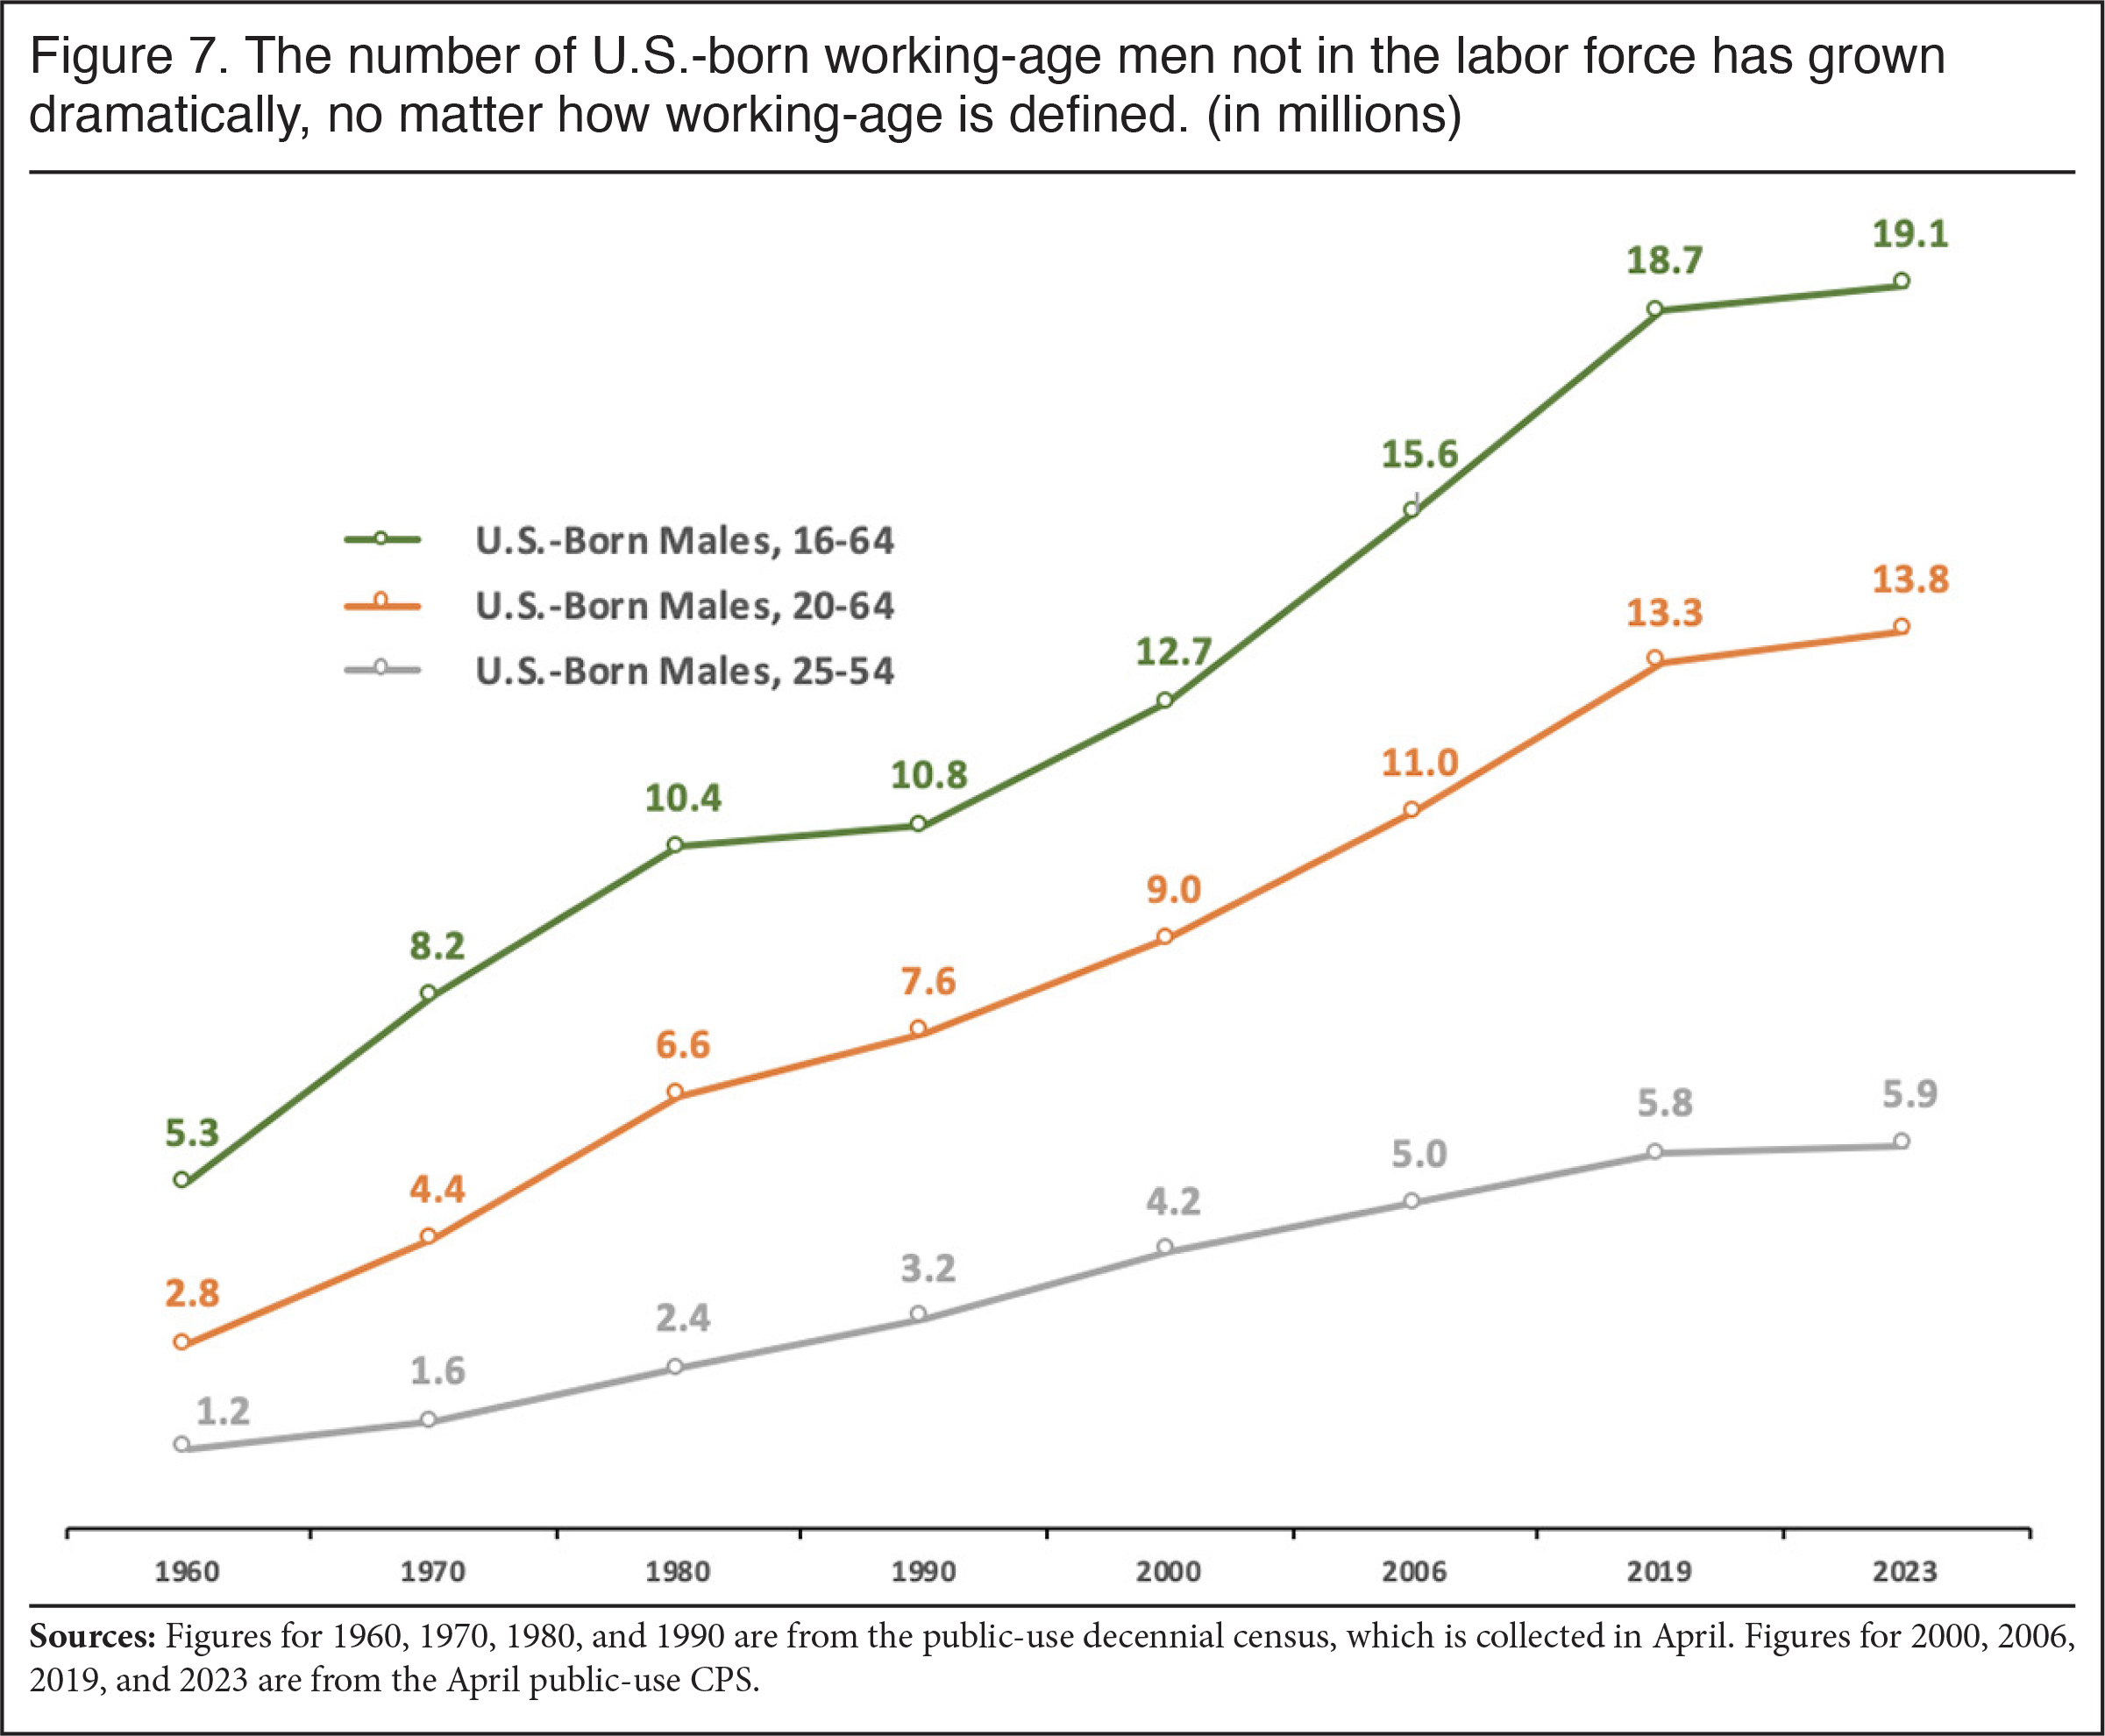
U.S.-Born Men Not in the Labor Force. Figure 6 shows the total U.S.-born working-age (16 to 64) male population from 1960 to 2023 relative to the increase in the number in the labor force. Because labor force growth did not keep pace with population growth, the number of U.S.-born men out of the labor force increased dramatically. In April 2023, 19.1 million U.S.-born men 16 to 64 were not in the labor force, up from 12.7 million in 2000 and 5.3 million in 1960.12 If the same share of U.S.-born men (16 to 64) were in the labor force in April 2023 as in 1960 there would be 9.5 million more U.S.-born men in the labor force. If the share in the labor force only returned to the 2000 rate, it would still add 4.8 million men to the labor force.13 Figure 7 shows the growth in the number of men not in the labor force is substantial even if the age range is restricted. At the same time, the number of immigrant men in the labor force (16 to 64) grew by eight million from 1960 to 2000 and increased another 5.7 million through 2023. So it is certainly the case that as the number of male immigrants in the labor force grew dramatically, the number of U.S.-born men out of the labor force also increased dramatically.
 |
 |
The Decline for U.S.-Born Women. Figure 8 shows the labor force participation of U.S.-born women ages 16 to 64 from 1960 to 2023. The revolution in social norms and legal protections for women is clearly evident in the figure, which shows a dramatic increase in their labor force participation since 1960. However, the share of working-age, U.S.-born women in the labor force peaked in 2000 and has not returned to that level since then. The rate for U.S.-born women 16 to 64 in 2023 was about two percentage points lower than in 2000. (Using other age ranges shows the same pattern; see Excel sheets linked here.) If the same share of U.S.-born women were in the labor force in April 2023 as in April 2000, it would add 1.7 million more women to the labor force. The decline for women without a bachelor’s is much more pronounced. Although labor force participation has roughly returned to pre-Covid levels for less-educated U.S.-born women, the rate is still more than six percentage points lower in 2023 than it was in 2000. This decline, while less than the 8.4 percentage-point decline for less-educated U.S.-born men in the same age group, is still substantial. Like their male counterparts, less-educated, American-born women have struggled.
 |
Immigrants. Figure 9 shows labor force participation for immigrant men ages 16 to 64. There was a rather significant decline for foreign-born men in labor force participation from 1960 to 1980. But it increased thereafter, peaking in 2006 before the Great Recession, which is very different than the sustained decline for U.S.-born men from 1980 to 2006. The decline from 1960 to 1980 should be interpreted with an understanding that the immigrant population can change more quickly than the U.S.-born population, which it did from 1960 to 1980. In 1960, there were still some working-age immigrants who entered during the so-called great wave of immigration, prior to 1924. Perhaps more importantly, the immigrants in the immediate post-WWII period from Europe tended to be relatively modest in number and relatively higher skilled.14
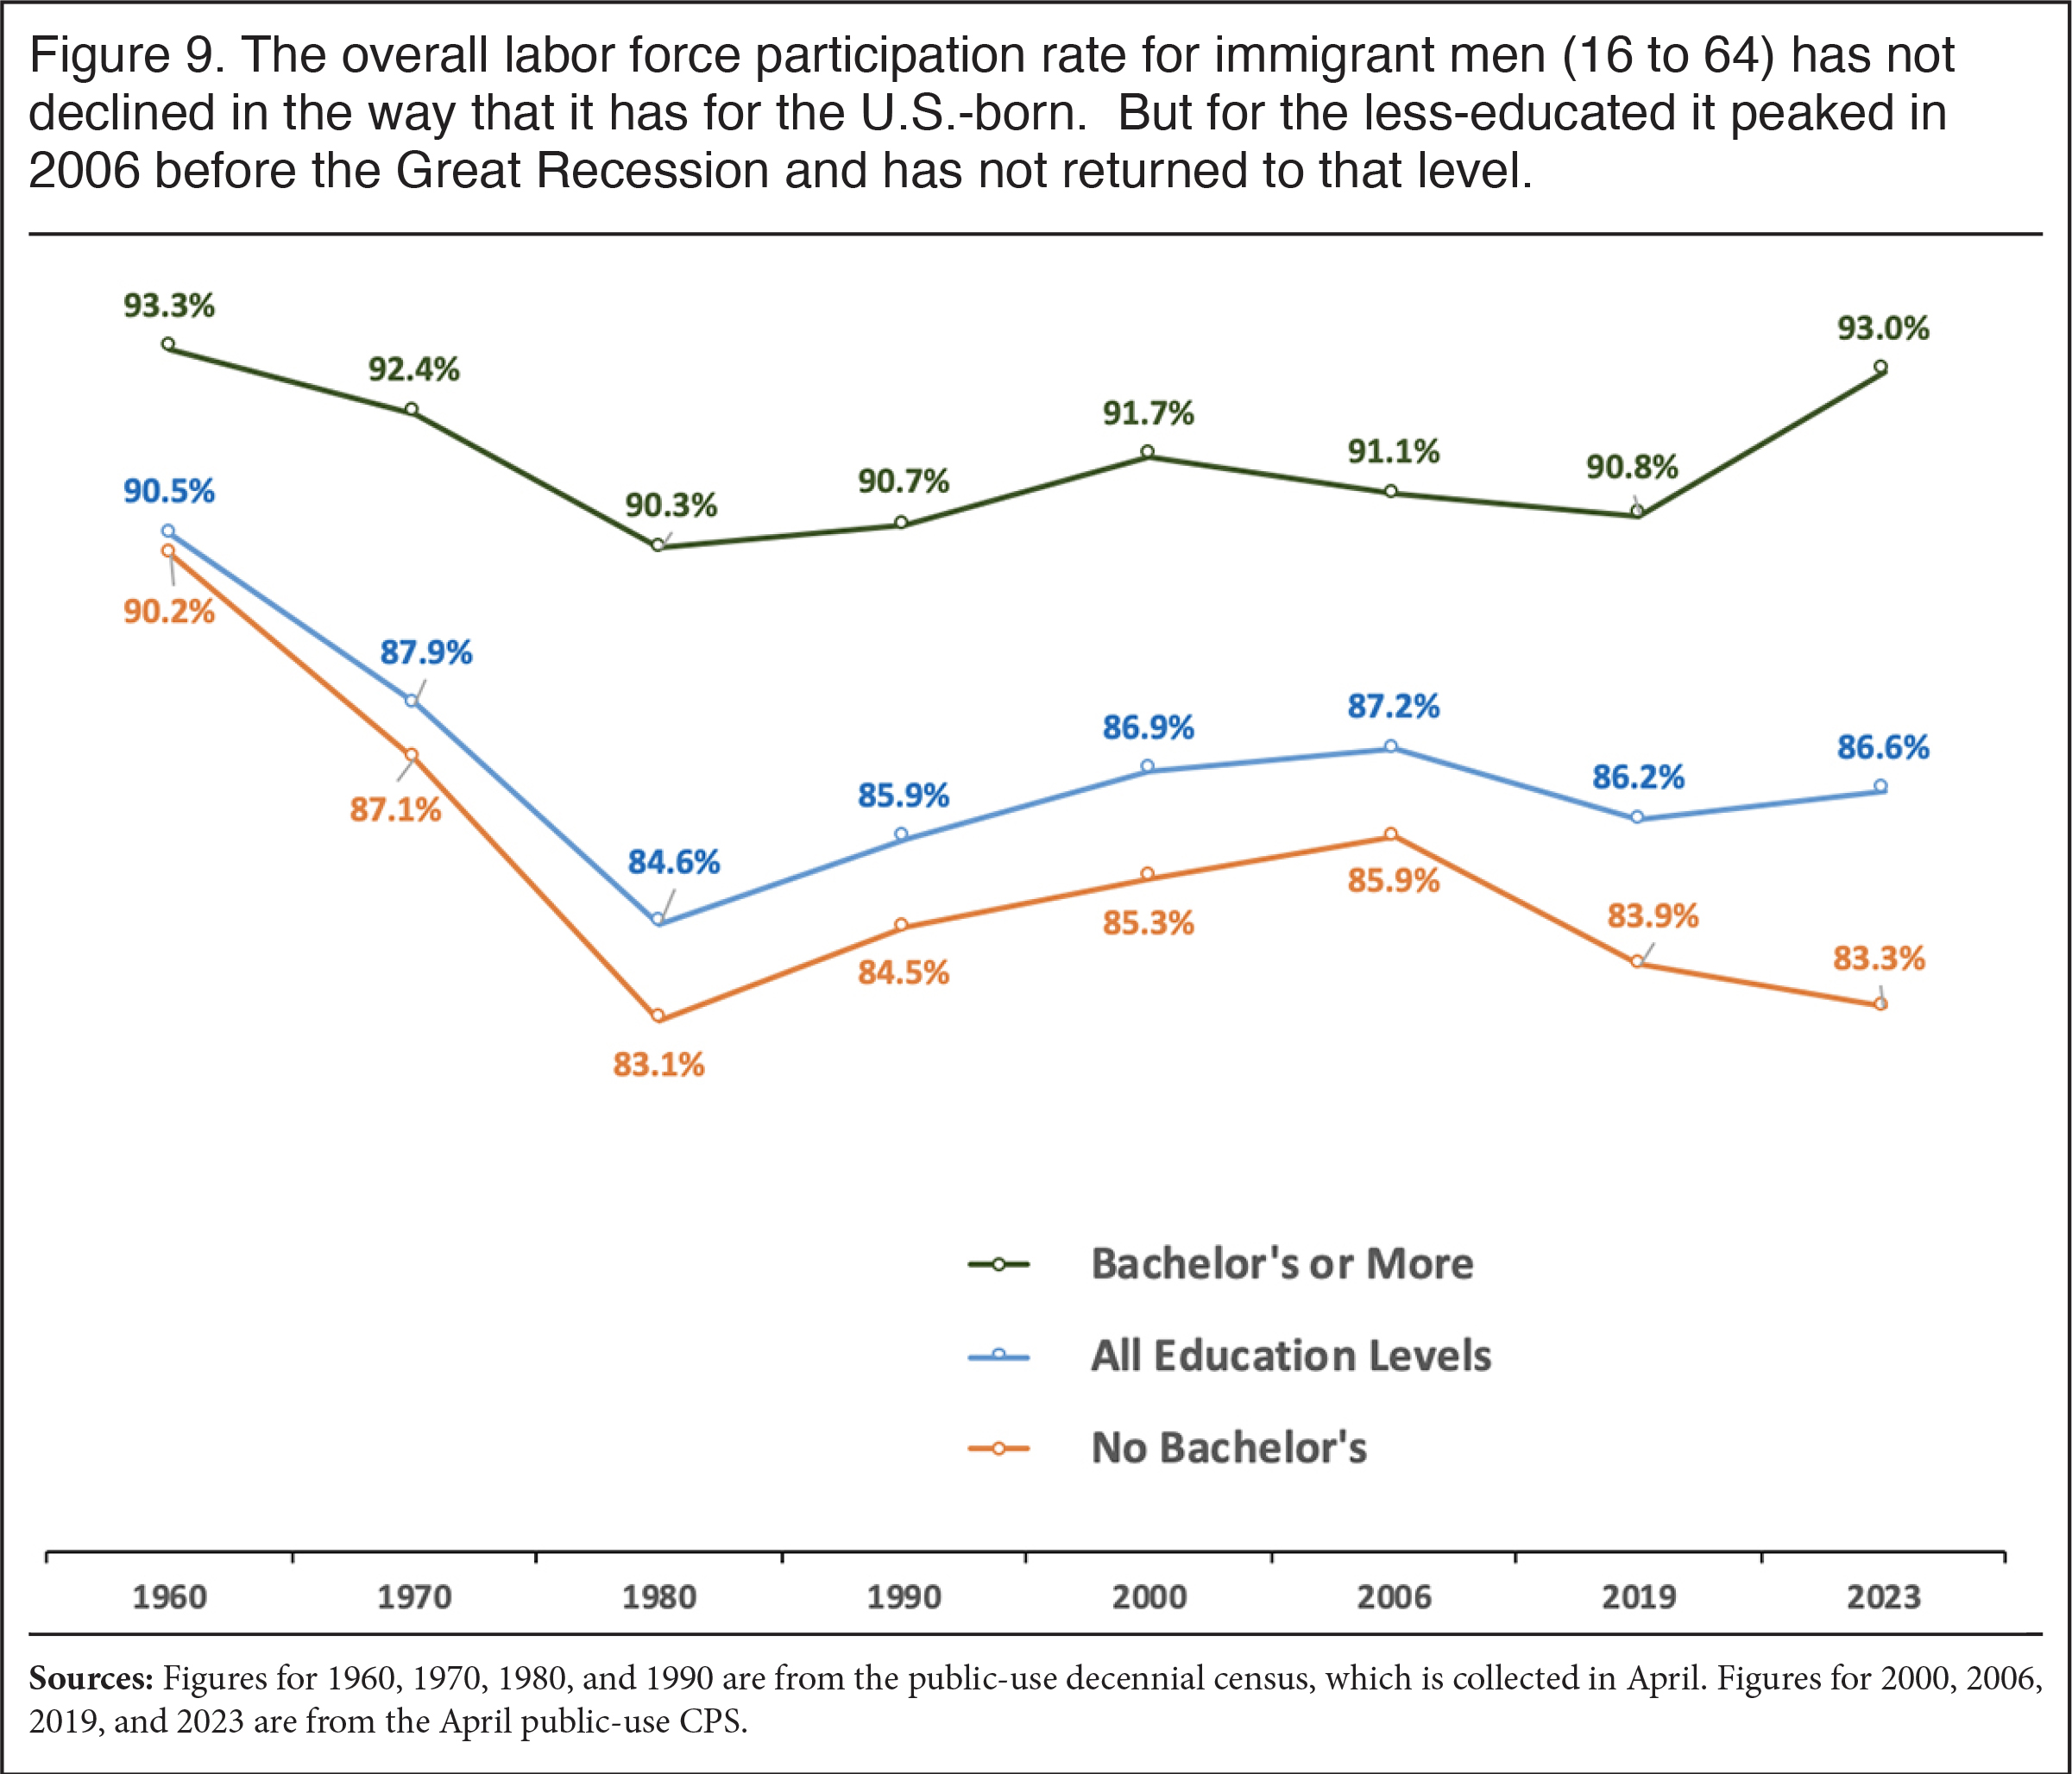 |
To be sure, Figure 9 shows that, while the participation rate for foreign-born men overall has not quite returned to the peak in 2006, at least by 2023, the falloff is small, especially compared to the U.S.-born over this period (see Figure 1). The decline for immigrant men (16-64) without a bachelor’s since 2006 is larger, at 2.6 percentage points, though still a good deal less than the 5.4 percentage points for U.S.-born men without a bachelor’s in this age group since 2006. The decline for immigrant men without a college degree would seem to indicate that the factors impacting the employment of U.S.-born men may also have reduced labor force participation for less-educated immigrants. It should be added that we are unsure if the large jump in labor force participation for college-educated immigrant men in 2023 relative to 2019 before Covid hit is a real change or perhaps a statistical fluke.
A Huge Pool of Potential Labor. Figure 10 shows the number of working-age (16 to 64) immigrants and U.S.-born Americans of both sexes not in the labor force. There were a total of 53.5 million non-institutionalized people out of the labor force in April of this year. Of those not in the labor force, 44.3 million or 83 percent were U.S.-born — an increase of 9.9 million since 2000. The number of working-age immigrants of both sexes not in the labor force was 9.1 million in 2023, 2.8 million more than in 2000. The consistent growth in the number of working-age U.S.-born men not in the labor force reflects the decline in their participation rate coupled with population growth. That is, a smaller share of a larger population is working or looking for work, so the number not in the labor force continued to increase. Population growth plays a larger role for the increase in U.S.-born women not in the labor force, though the decline in their participation since 2000 accounts for about half of the increase in the number not in the labor force. Since the participation rates for foreign-born men and women have not declined, at least since 1980, all of the increase in the number of immigrants not in the labor force in recent decades is due to population growth.
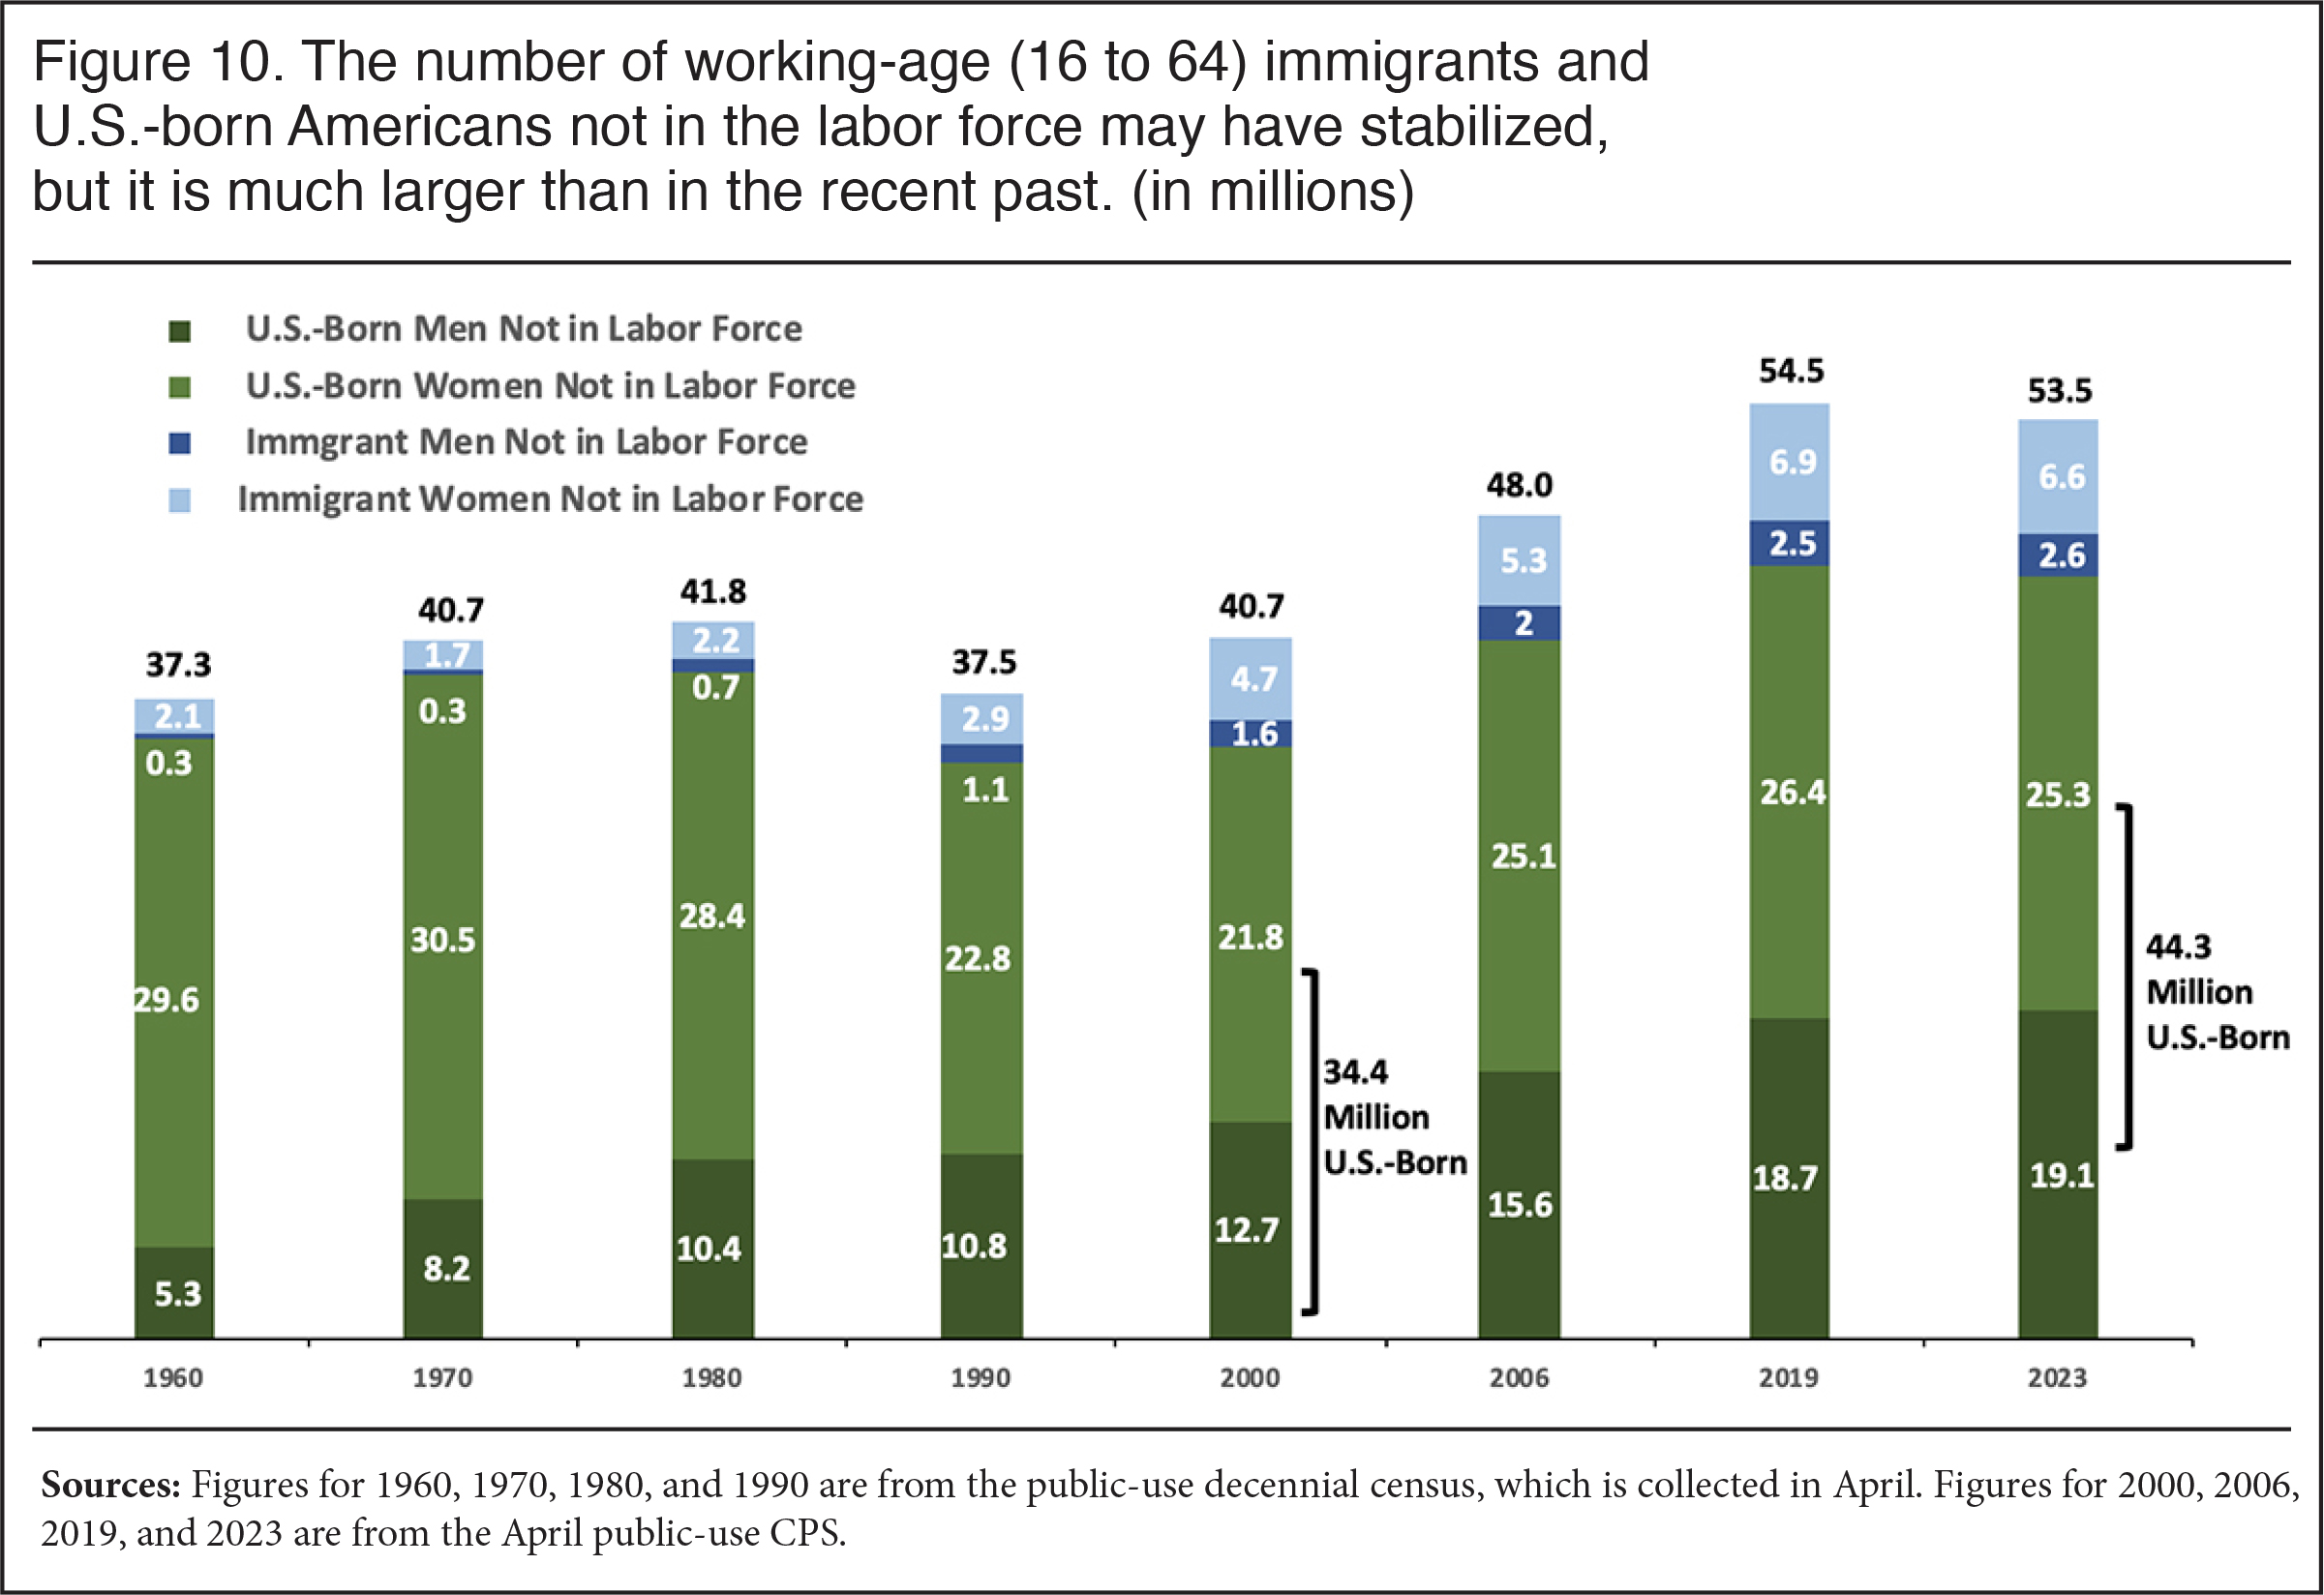 |
Of course, the enormous number of working-age people not in the labor force does not mean all or even most of these individuals can, should, or would work. Many are in school, others care for family members, some are disabled, others have retired early, and to be sure some could legitimately be described as lazy and completely unwilling to ever work. What these numbers do mean is that there is a very large pool of potential workers available, some of whom could be brought into the labor force if properly paid and treated by employers. Not so long ago a much larger share of working-age people were, in fact, in the labor force. As already discussed, if the same share of U.S.-born working-age men and women were in the labor force today as in the recent past it would add millions of workers. Or put a different way, if only 11 percent of working-age people not in the labor force were to join/rejoin it, it would add six million to the labor force. This is equal to all the people immigration has added to the labor force since 2010.15
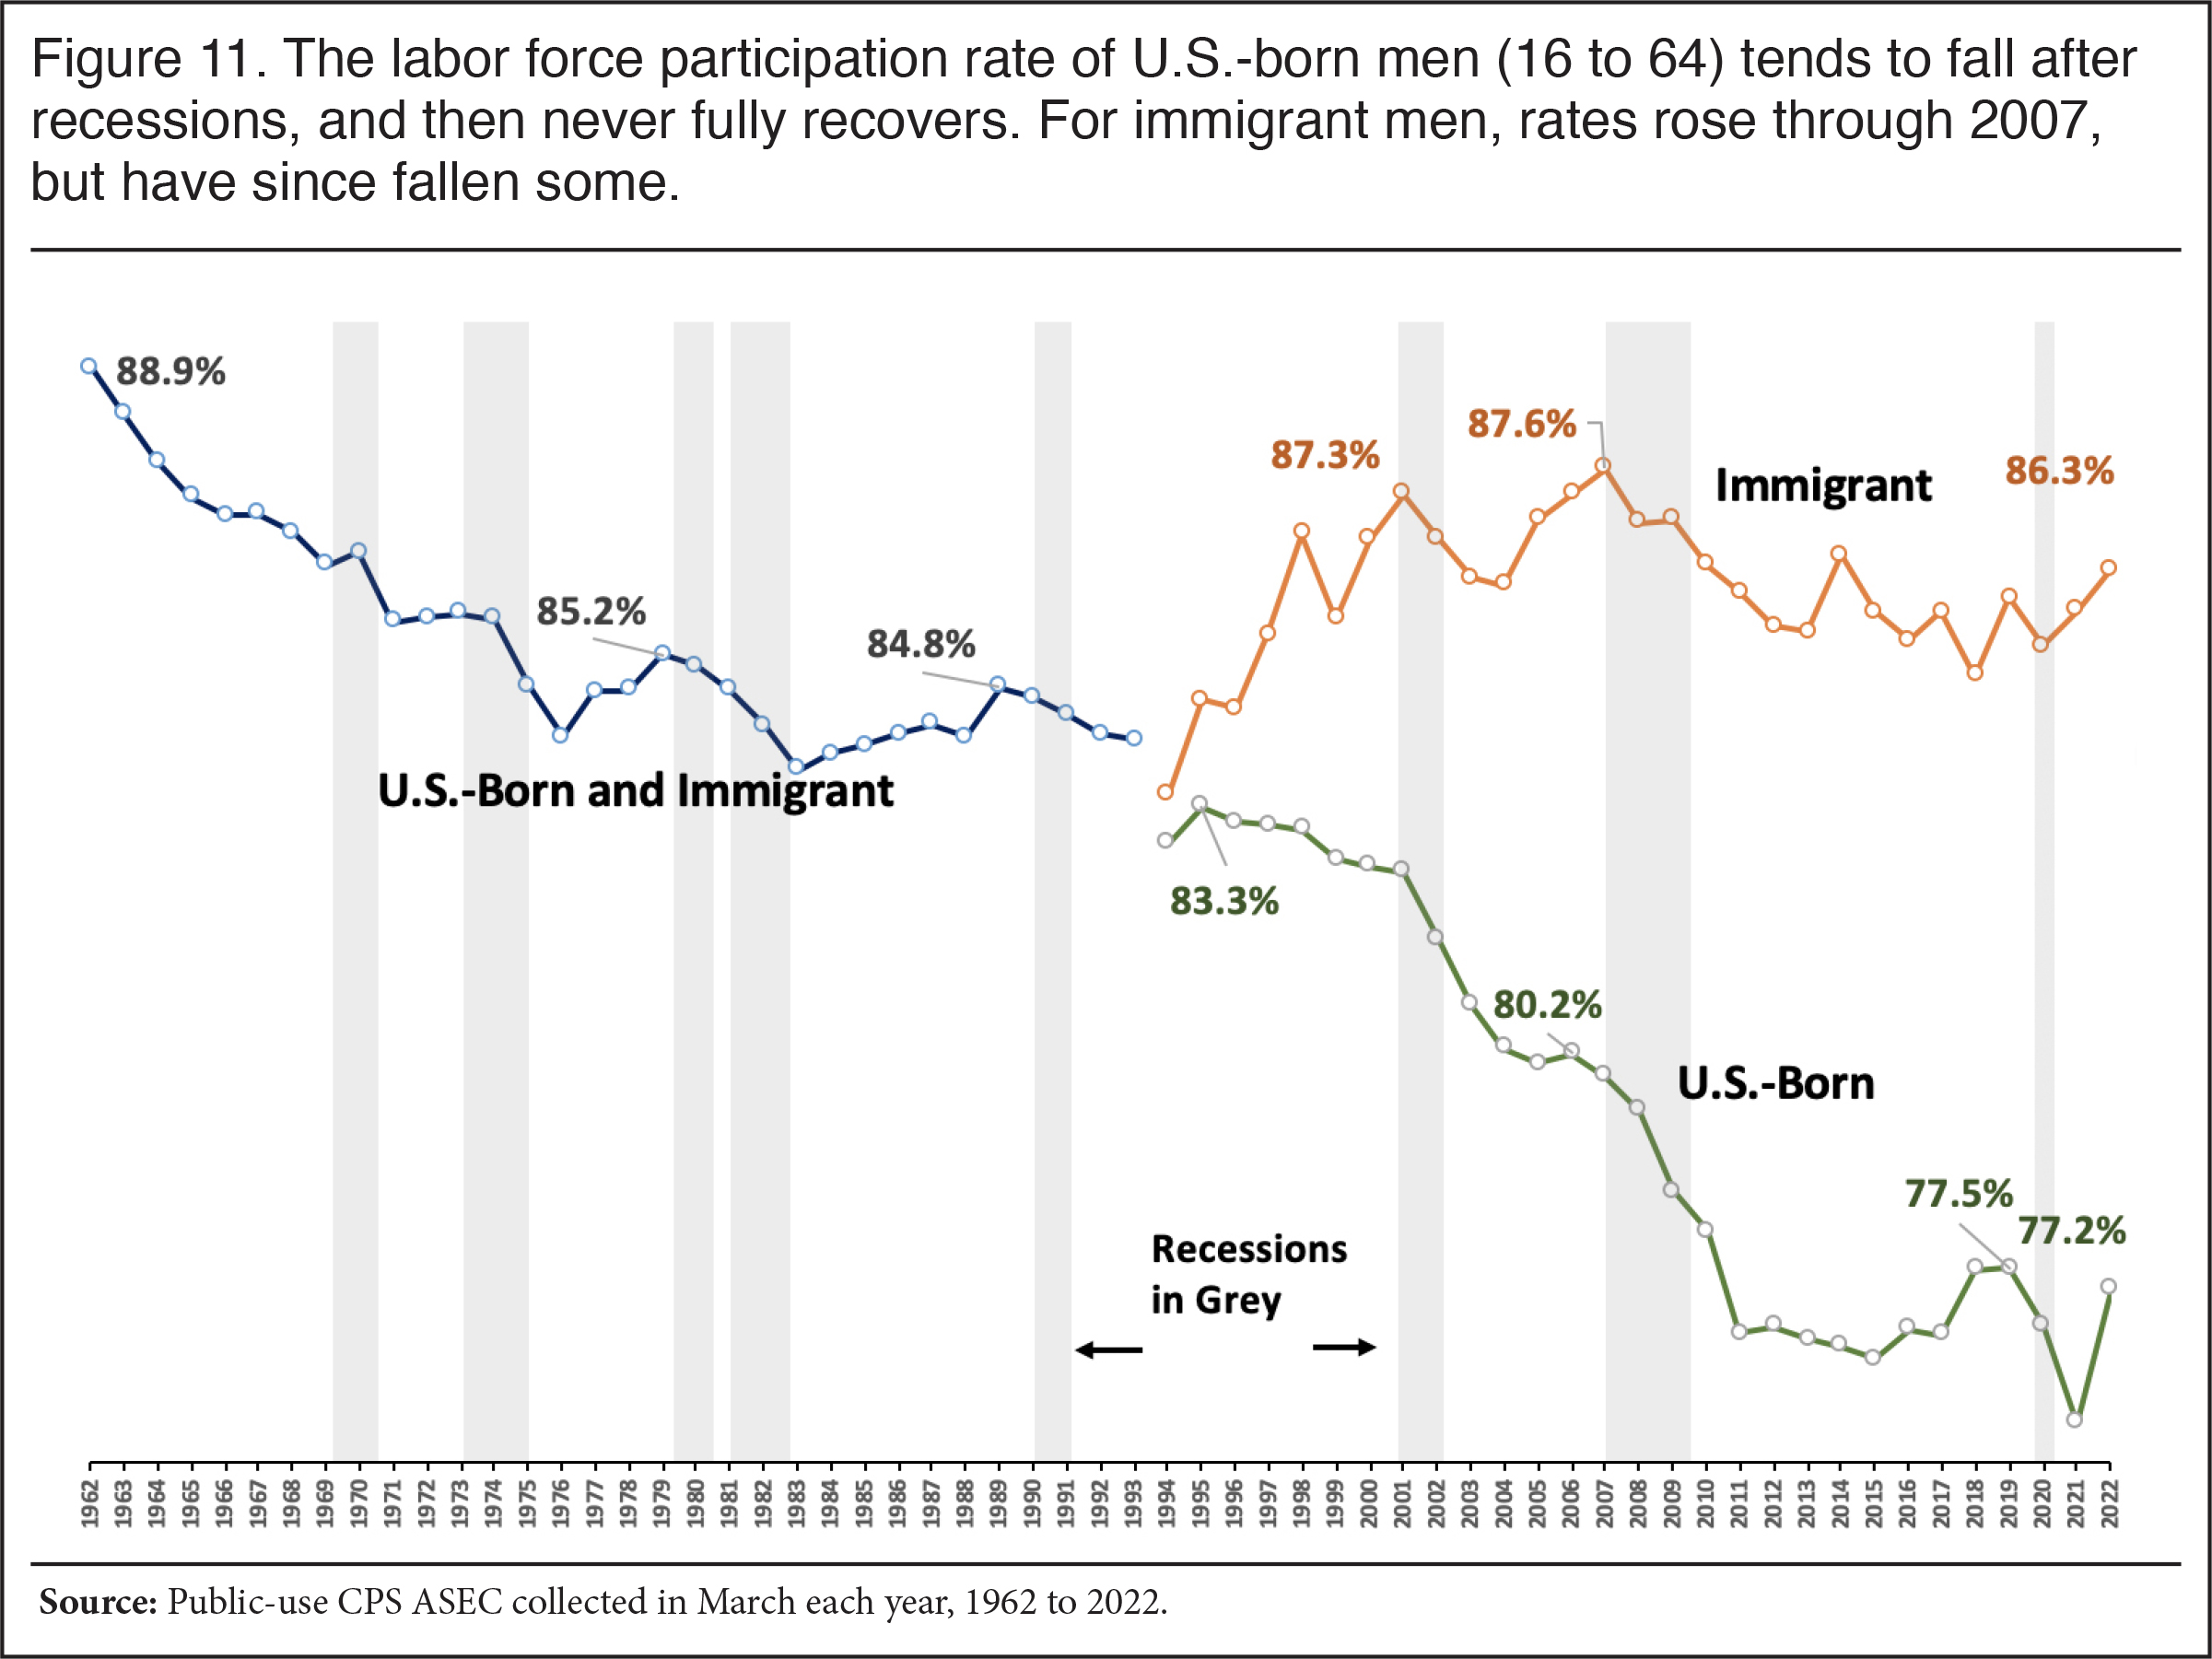
Looking at Data from Every Year. Figure 11 shows labor force participation for men 16 to 64 for every year, rather than during peak years, from 1962 through 2022 based on the CPS ASEC. About 6 to 8 percent of the male labor force from 1960 to 1980 was foreign-born, so the falloff in the 1960s and 1970s primarily reflects the decline for U.S. born men.16 Though, as Figure 6 showed, participation declined for immigrant men from 1960 to 1980 as well. Labor force participation typically declines after each recession, which is to be expected since, like unemployment, it is a lagging indicator of the economy. But participation then never made it back to pre-recession levels for the U.S.-born once the economy recovered. Also, the figure shows that in 1994, the first year for which CPS ASEC has nativity data, there was only a modest difference in the participation between immigrants and the U.S.-born.17 The 1990 census also showed similar participation rates for the two groups (see Figure 1 and Figure 9). But we can say that from the early 1990s onward, the rate for immigrant men increased until the Great Recession, while it fell for the U.S.-born. It is interesting that for foreign-born men, the CPS ASEC shows that labor force participation peaked in 2007 and it has never quite gotten back to that level, though the decline since 2007 is not as profound as it has been for U.S.-born men.
 |
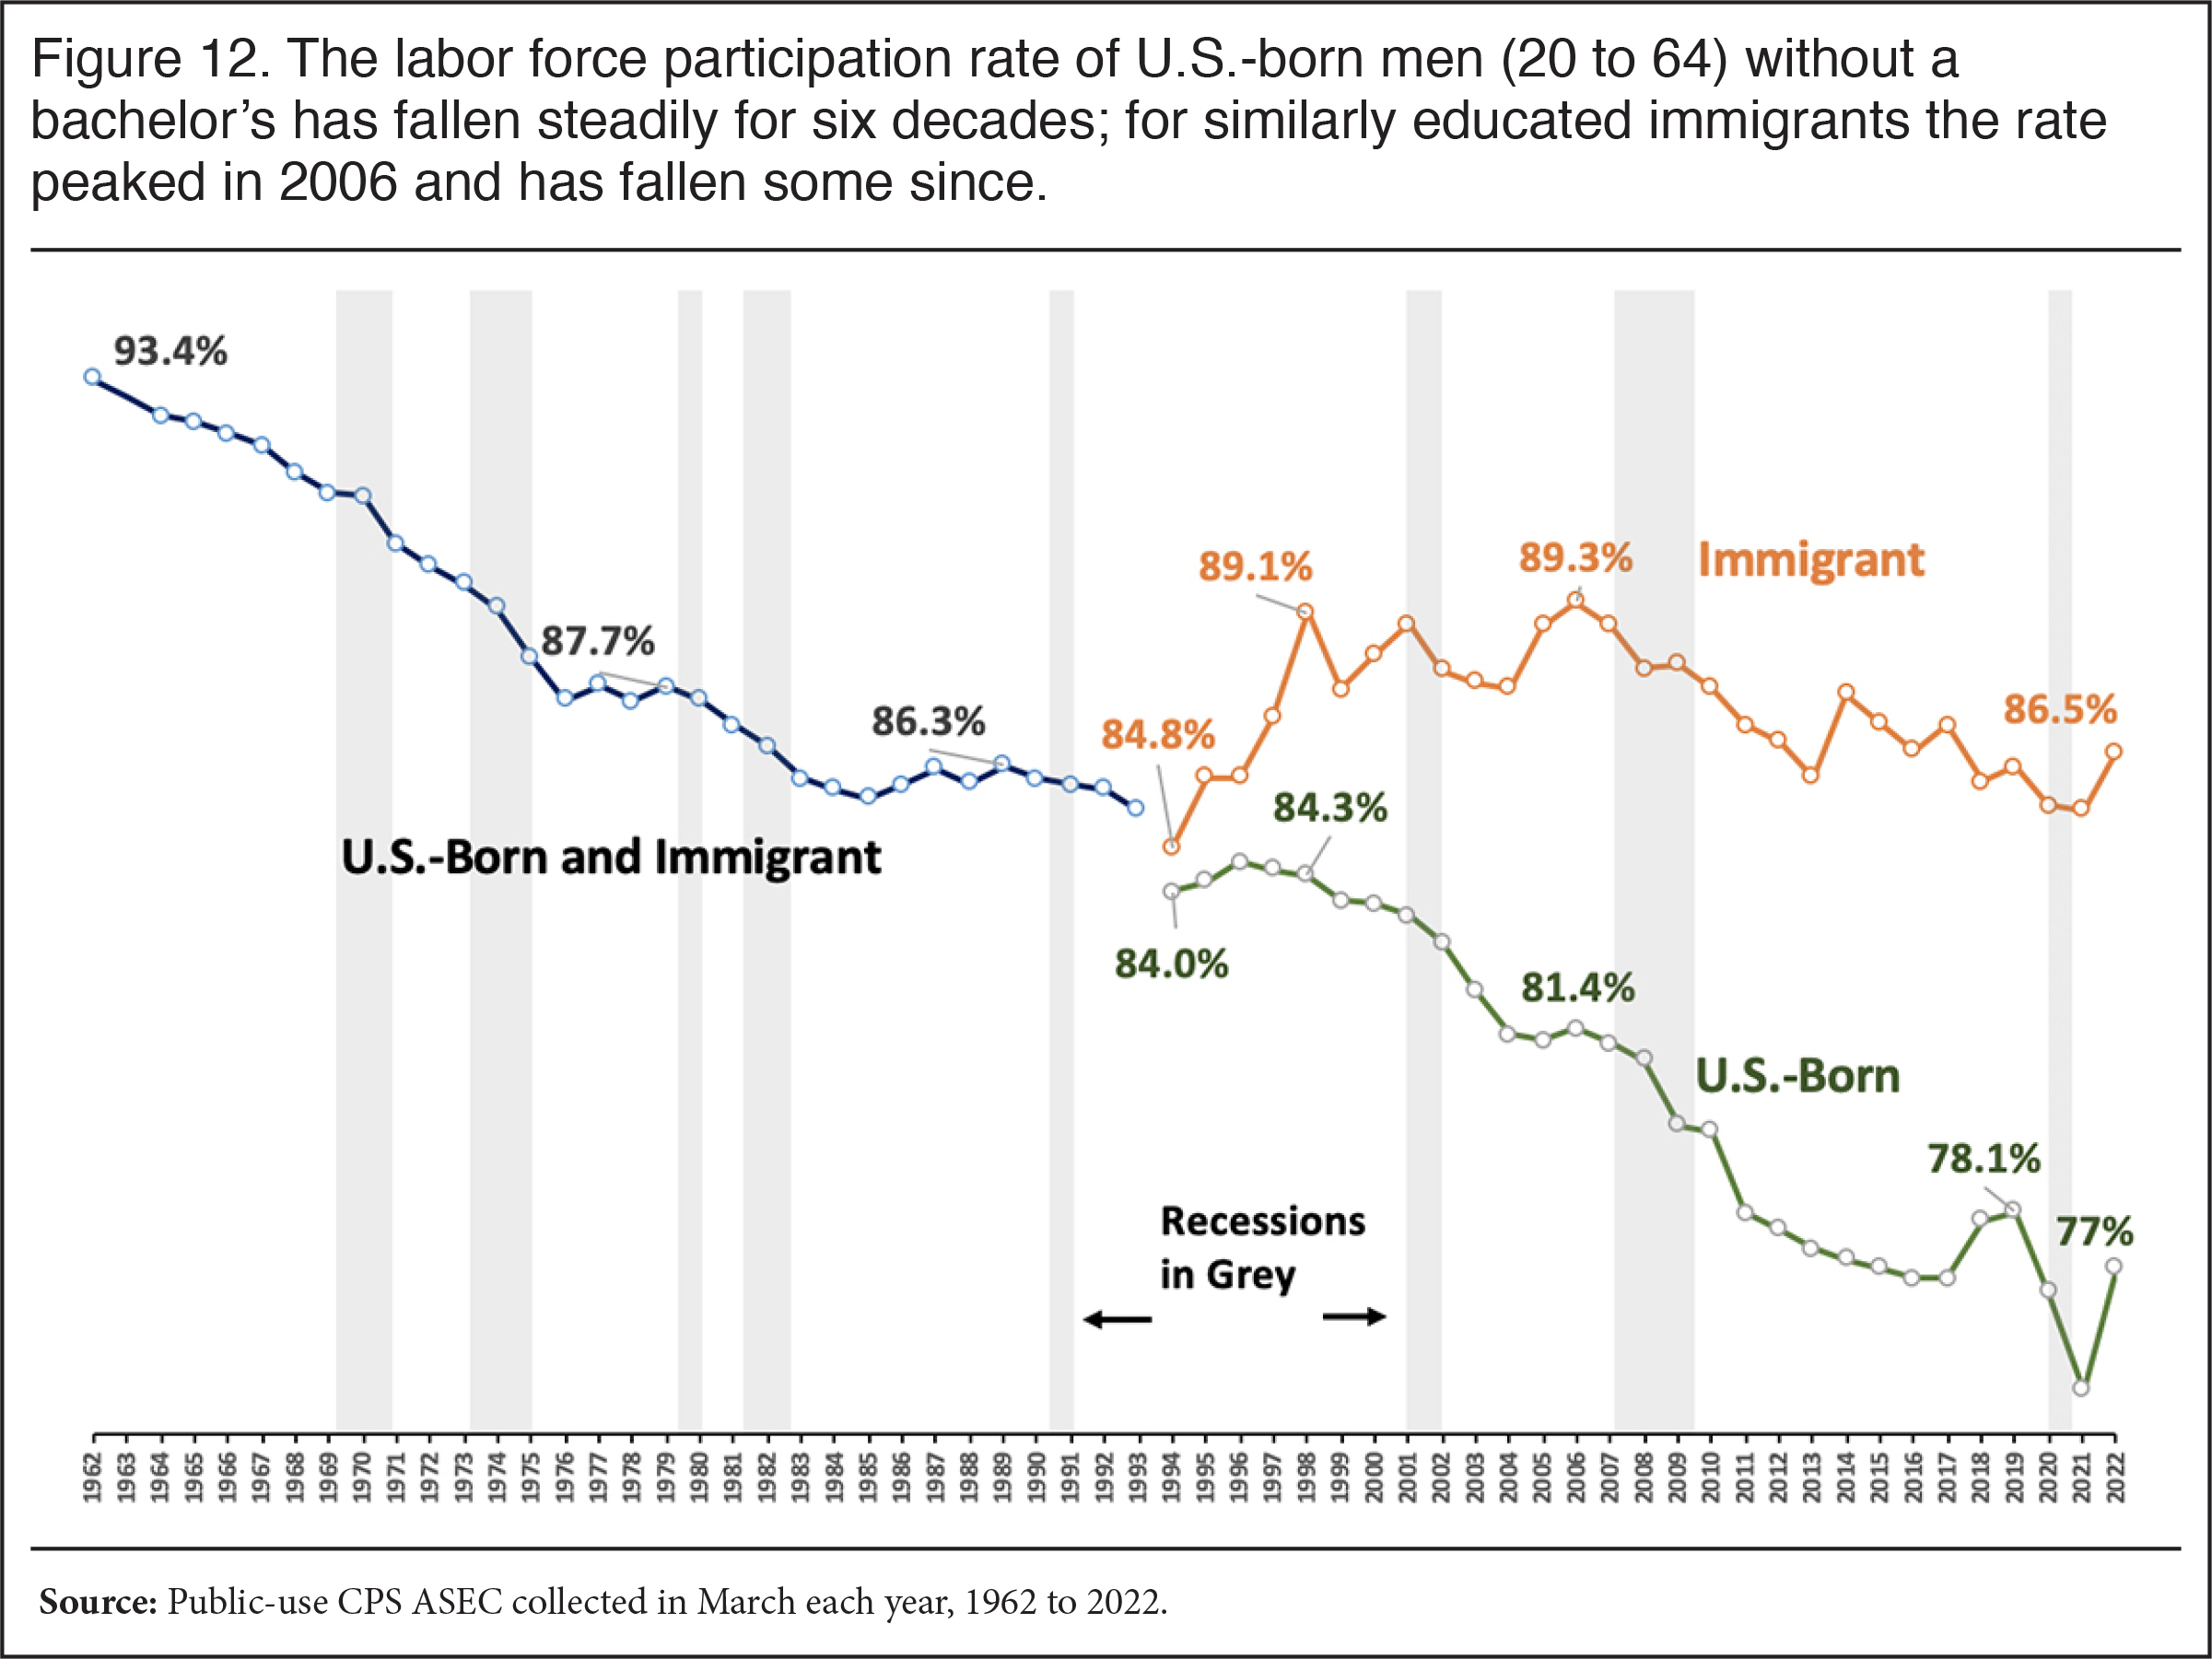
The Less-Educated Every Year. As we have seen, labor force participation has declined especially for U.S.-born men without a college degree. Figure 12 reports the participation rate for foreign- and U.S.-born men without a bachelor’s degree ages 20 to 64 for every year using the CPS ASEC. As is the case for the entire working-age population shown in Figure 11, less-educated immigrants and U.S.-born American men had a similar labor force participation rate in 1994. But that changed thereafter with the immigrant rate increasing and the U.S.-born rate falling. As is true for immigrants overall, labor force participation for less-educated immigrants has not returned to the peak before the Great Recession, at least through 2022. That said, the participation rate for less-educated immigrant men was 2.8 percentage points lower in 2022 than at the peak before the Great Recession, while the rate was 4.4 percentage points lower for less-educated U.S.-born men relative to 2006. The CPS ASEC, like decennial Census data and the April monthly CPS figures shown in prior figures, all show a significant decline in labor force participation among less-educated men, immigrant and U.S.-born alike, with the decline being a good deal larger for the U.S.-born.
 |
What’s Causing the Decline?
There are clearly a huge number of working-age people on the economic sidelines due to the profound long-term decline in the labor force participation of working-age, U.S.-born men, and to some extent women. However, the causes of the decline are much debated. Below we briefly summarize some of the explanations offered for the falloff in participation. It seems certain that there is no single cause for the decline. Rather, many factors likely contribute to the problem and these factors almost certainly interact with each other in complex ways.
Weak Labor Demand. There is no question, as Figures 11 and 12 show, that labor force participation falls during recessions when demand for labor is slack. But it is less clear why the rate does not return to pre-recessions levels when the job market recovers. The total number (immigrant and U.S.-born) of men and women without a bachelor’s holding a job increased from 59.2 million in 1960 to 100.4 million in 2006, right before the Great Recession. The number of these less-educated workers holding a job is now 95.2 million by 2023, as the U.S. population became ever more educated. Still, it is very hard to argue that demand for less-educated workers somehow collapsed, especially before 2006 when demanded seemed to steadily increase.18
Nonetheless, both the Obama White House and the Brookings Institution emphasized weak labor demand and the resulting decline in wages for the less-educated as an important cause of declining participation. Other researchers come to a similar conclusion. Globalization, particularly trade, and technological innovations, sometimes referred to as “skilled bias technological” change, are typically identified as key causes for reducing demand for less-educated workers.19 Clearly low wages are a disincentive to work and must have played some role in the decline in labor force participation. But if demand for less-educated labor is weak, and this is causing the decline in labor force participation, then current immigration policy is profoundly misguided. In the April 2023 CPS, 10.9 million immigrant workers (legal and illegal) without a bachelor’s degree indicated they came to the United States in 2000 or later.20 Immigration has certainly added enormously to the supply of less-educated workers. We know that the majority of workers in nearly every job category, as defined by the Department of Commerce, are done by the U.S.-born, so the argument that immigrants only do jobs Americans don’t want is false. Adding so many new less-educated workers to the economy when demand did not keep pace with the size of the population without a bachelor’s seems very unwise if we want to have high labor force participation and avoid all the negative consequences caused by its decline.
Labor Demand Relative to Immigration. It is reasonable to argue that demand for less-educated male labor has been weak relative to the increase in the supply of less-educated workers once immigration is taken into account. From 1960 to 2006, the number of 16- to 64-year-old, less-educated men in the labor force (both immigrant and U.S.-born) increased 15.3 million, but only 8.1 million of that increase went to the U.S.-born, while the rest went to immigrant men. The 8.1 million increase represented a 21.5 percent increase in the number of less-educated, U.S.-born, working-age men in the labor force. However, the total number of working-age, less-educated, U.S.-born men (in and out of the labor force) increased 39.3 percent (16.7 million) over this same time period, hence the huge decline in their participation rate. Since 2006, the overall number of working-age U.S.-born men without a bachelor’s has fallen, but only by 2.6 percent (1.6 million).21 However, the number in the labor force fell 9.4 percent (4.3 million), so their participation rate continued its precipitous decline after 2006. As for less-educated, working-age, male immigrants, the number in the labor force actually increased by 687,000 from 2006 to 2023. It is clear that demand for less-educated male workers has not kept pace with the total population of less-educated men, at least when immigrants are included. The result has been a huge decline in the labor force participation rate for the U.S.-born.
Changing Social Norms. Nicholas Eberstadt argues that slack labor demand for less-educated workers is an inadequate explanation because foreign-born men with modest levels of education have not experienced the same decline as U.S.-born men. Perhaps even more important, the decline for less-educated unmarried men is much more pronounced than for married men of the same age and skill level. He believes that changing expectations about men as providers explains much of the decline due in large part to the decline in institutions that reinforced the value of work, particularly marriage. This makes it increasingly acceptable for men to rely on family members, such as parents or partners, for support. He also argues that the welfare state undermines work and enables those not in the labor force to at least have some income. These arguments echo those made by anti-poverty researcher Lawrence Mead, who has long argued that “culture” and “social isolation” are key reasons why an increasing share of working-age men do not work.
The Welfare State. Some researchers focus specifically on what they believe is an overly generous and easily accessible welfare and disability system as a cause of declining participation. Growth in use of disability is particularly striking even if we cannot fully measure it because the government does not track all the sources of disability payments, public and private. We do know that use of the largest disability program, Social Security Disability Insurance (SSDI), has grown dramatically. The total number of workers in America was 2.5 times larger in 2021 than in 1960, but the number of people on SSDI who qualified as workers was 17 times larger in 2021 than in 1960.22 From 2000 to 2021, the total number of workers was up about 13 percent, but the number on SSDI was up 56 percent, though the number is down some since the height of the Great Recession. Eberstadt observes that disability programs are, “increasingly used as income-support mechanisms for men on a work-free life track”.
Immigration. Direct competition with immigrants likely has also contributed to the decline in the participation rate. In a prior analysis, we found that the fall-off in immigration in the first three years of the Trump administration, before Covid, coincided with an increase in wages and labor force participation for less-educated, U.S.-born Americans relative to the higher period of immigration in the prior two decades. The National Academies’ comprehensive 2016 study found that immigration reduces wages for some U.S.-born workers, which almost certainly undermines work incentives. A 2019 CIS analysis of EEOC discrimination cases found that immigrants can be used to replace U.S-born workers. Other research has found a negative impact on the employment of young U.S.-born workers, while more than one study has found a negative impact on the employment of Black Americans from immigration. Several recent academic papers show that the arrival of immigrants in an area tends to cause the U.S.-born to move out, likely to avoid competition. Perhaps as important as direct competition between the U.S.-born and foreign-born is that the availability of immigrant labor allows policy-makers, business groups, and American society in general to ignore all those on the economic sidelines and the resulting social problems.
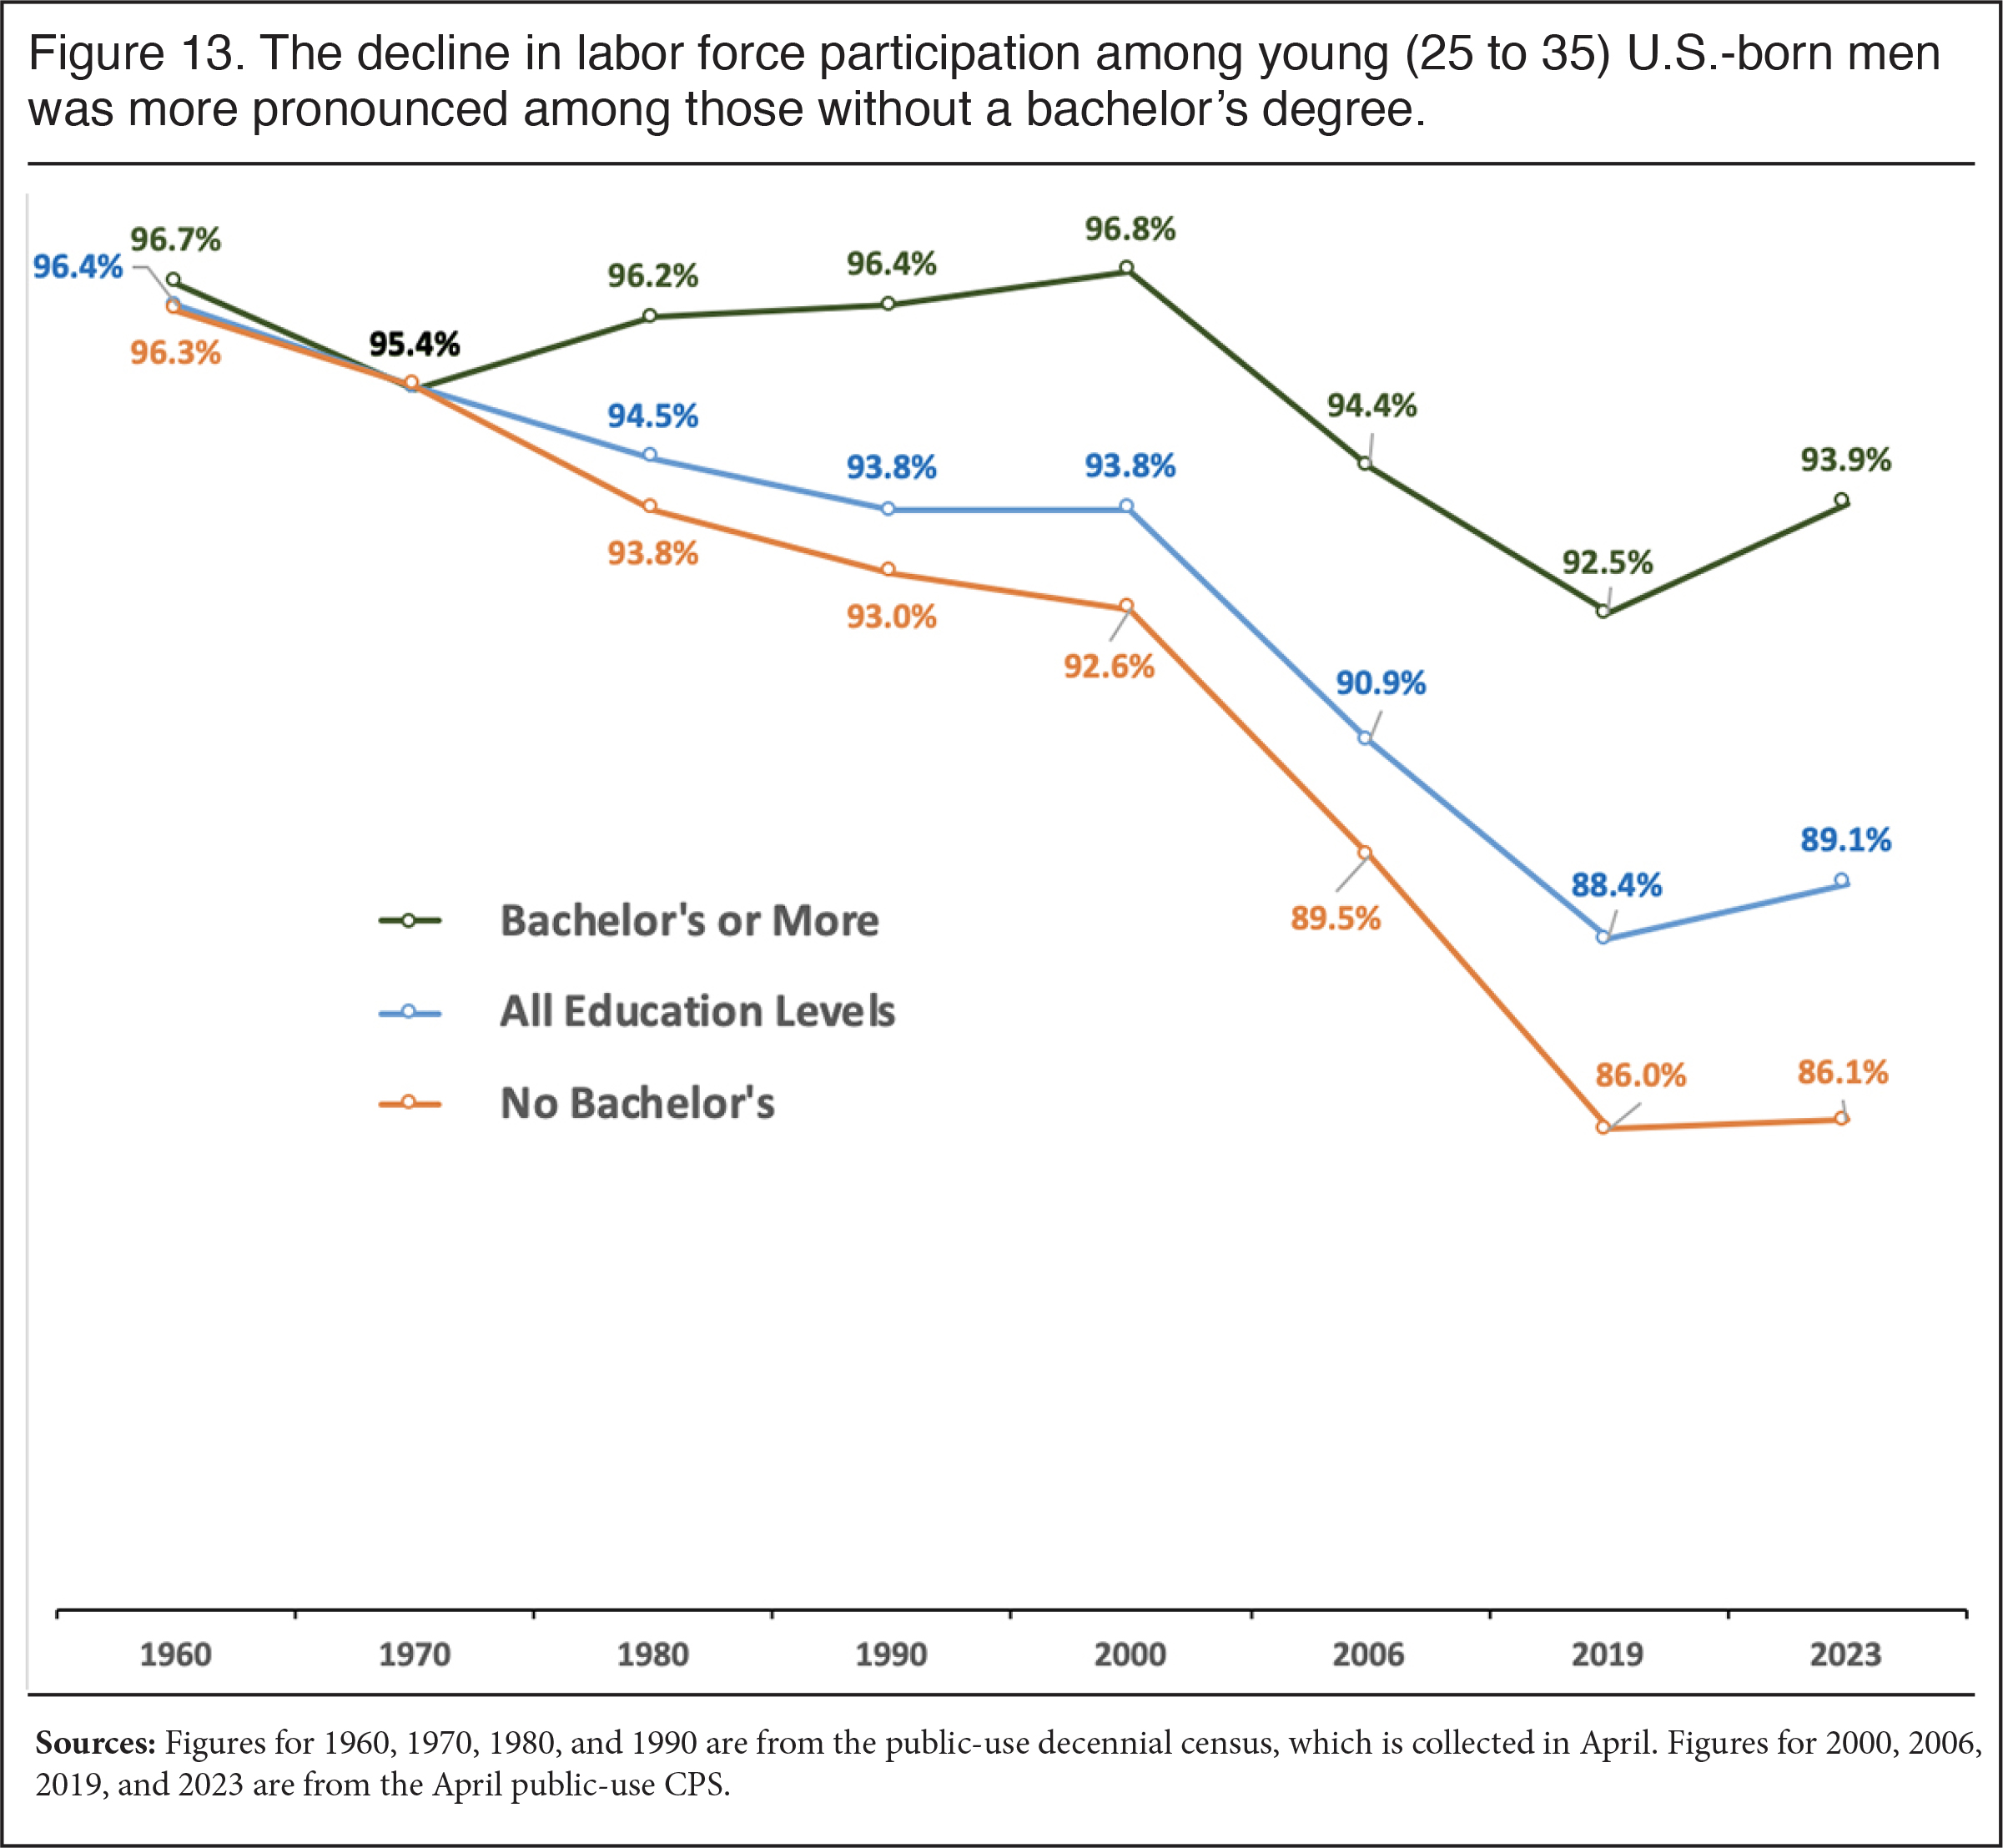
Other Possible Causes. It has long been known that having a criminal record significantly reduces one’s employment prospects. There is good reason to think the dramatic increase in the share of less-educated men with a criminal record in recent decades has significantly impeded the willingness of employers to hire them, particularly African American men. There is also evidence that in addition to being caused by dropping out of the labor force, addiction itself reduces labor force participation. One factor that can be ruled out as a cause of declining labor force participation is population aging. Some research includes the elderly in the analysis and then identifies population aging as a cause of declining participation. But aging cannot explain the decline in participation among the working-age. In fact, Figure 13 shows that the long-term decline in participation is very pronounced even among relatively young less-educated men (25 to 34).23 We can also dismiss the idea that less-educated men are increasingly assuming household responsibilities, such as child care, rather than working. Fewer men live with children now than in the past and the time utilization survey shows that men not in the labor force spend very little time caring for others. Rather, these men report they spend much of their time watching TV, socializing, relaxing, and other leisure activities.
 |
Conclusion
The findings of this analysis confirm prior research showing a six-decade-long decline in the share of working-age men participating in the labor force. Unlike most research on this issue, we break out immigrants and the U.S-born separately going back decades. The participation rate — the share of the working-age working or looking for work — fell for both U.S.-born and foreign-born men from 1960 to 1980, but since 1980 the rate has not deteriorated for immigrant men in the way that it has for the U.S.-born. The dramatic decline in participation for U.S.-born men means there is now a huge number of potential workers on the economic sidelines who are out of the labor force entirely but are not counted among the unemployed because they have not looked for a job in the four weeks prior to being surveyed. The total number of U.S.-born men and women ages 16 to 64 not in the labor force was 44.3 million in April 2023, nearly 10 million more than in in April 2000. This does not include the four million natives in the labor force but counted as unemployed in 2023, nor does it include the roughly 10 million working-age immigrants not in the labor force or unemployed.
The fall-off in participation is primarily, though not exclusively, confined to those without a college education. The data also shows a decline for these less-educated, U.S.-born men no matter how “working-age” is defined — 16 to 64, 18 to 64, 25 to 64, or even only those of “prime age”, 25 to 54. Confining the analysis to only the working-age means the deterioration in labor force participation has nothing to do with the growing share of the U.S. population that is over age 65. In fact, we show that the long-term decline for relatively young U.S.-born men without a bachelor’s degree is very large. Among less-educated U.S.-born women, labor force participation has also declined after peaking in 2000. In addition, less-educated immigrant men have experienced some decline in participation since peaking in 2006, though the decline is not as large as for less-educated U.S.-born men.
We summarize in this report the much-debated reason for this decline. It is likely that many factors have contributed to the fall-off in labor force participation, including declining wages, prior criminal convictions, ease of access to welfare and disability programs, competition with immigrants, and changing values and norms about the importance of work. However, while there is no agreement on what has caused the decline in participation, there is agreement that the deterioration is associated with a host of serious social problems. These include, but are not limited to, substance abuse, crime, overdose deaths, suicide, obesity, welfare dependence, and social isolation, to say nothing of the fiscal and economic costs of having a larger share of working-age people not in the labor force.
The decline in labor force participation means there is huge pool of working-age people from which employers could potentially draw to fill jobs. If labor force participation for U.S.-born men and women together returned to the peak years of 1960 for men and 2000 for women, it would add a total of 11.2 million people to the labor force. Even if the participation rate only returned to the 2000 rate, it would still add 4.8 million U.S.-born men and 1.7 million women to the labor force. This is germane to the immigration debate because one of the primary justifications for large scale legal immigration, and even tolerating illegal immigration, is that there are not enough people to fill all the jobs available. But to make that argument one has to ignore the enormous number of working-age U.S.-born men and women not in the labor force and all the problem this creates for society.
Trying to draw significantly more working-age men, and to some extent women, into the labor market will certainly not be quick or easy. It will involve the difficult task of reforming our welfare and disability systems, combating the opioid and mental health crises, improving job training, and reexamining our approach to globalization. Allowing wages and benefits to rise, partly by reducing immigration, is almost certainly a key part of the solution. Perhaps most challenging, we will need to figure out how to re-instill the value of work.
We are certainly much less likely to undertake needed reforms if we continue to keep the level of legal immigration very high and tolerate widespread illegal immigration. The business community, policy-makers, and society in general have much less incentive to deal with the huge share of the working-age out of the labor force if we can continue to simply turn to immigrants to fill jobs. We have a choice as a country: We can either adopt policies designed to get more working-age Americans currently on the economic sidelines into jobs or we can ignore the problem and continue to bring in ever more immigrants and then try to manage all the pathologies associated with our low labor force participation rate.
End Notes
1 The standard unemployment rate using the monthly CPS is calculated by dividing the number of people actively looking for work in the last four weeks by the number in the labor force (working or looking). Because of the way it is calculated, those not in the labor force are not included in the official unemployment rate. This means that the number of working-age people not working at any one time is dramatically larger than the number who are officially considered unemployed.
2 Because the CPS only began to ask about citizenship in 1994 on a regular basis, we cannot really use the survey to measure employment by nativity before that year. However, in order to measure long-term trends, we use the decennial census in earlier years. While this allows us to divide the population by nativity back to 1960, we are limited to the years of the census.
3 Looking at the monthly data, it seems employment peaked in 1979 and 1989, not the year of the census, though it was not that much lower in 1980 and 1990 so using the census still gives a pretty clear picture of the long-term decline.
4 We use the April CPS to create continuity with the decennial census, which is also collected in that month. While the figures in this report are not seasonally adjusted, we are looking at the same month each year, which should do a good job of controlling for seasonality. We use unadjusted numbers because such numbers are conceptually simpler and easier for other researchers to replicate. Moreover, we are comparing CPS data and decennial census data in this report and the census is not seasonally adjusted. Also, the limited number of statistics on the foreign-born published in the BLS monthly "Employment Situation" (Table A-7) reports are, like those reported here, not seasonally adjusted. The counts and percentages, particularly for sub-populations we report based on the CPS will, in some cases, be slightly different from published BLS reports. The reason is that the Census Bureau adds "perturbations" to the public-use microdata to protect respondent confidentiality. Fortunately, the Census Bureau states that any differences between published figures and those calculated from the public-use data will be so small that they "fall well within the sampling variability associated with CPS estimates".
5 The CPS ASEC is taken in March each year.
6 The term “immigrant” has a specific meaning in U.S. immigration law, which is all those inspected and admitted as lawful permanent residents. In this analysis, we use the term “immigrant” in the non-technical sense of the word to mean all those who were not U.S. citizens at birth. Typically, the government refers to these individuals in surveys such as the CPS or decennial censuses as the “foreign-born”. While it may surprise some, the BLS is clear that illegal immigrants are included in the survey, and the Census Bureau is equally clear that illegal immigrants are included in the census every 10 years, though in both cases some fraction are missed. Although there is some undercount, immigrants, or the foreign-born, in the CPS and decennial census include naturalized citizens, legal permanent residents (green card holders), long-term temporary visitors (e.g. guestworkers), and illegal immigrants.
7 Average total personal income in the 2022 Current Population Survey ASEC for men 20 to 64 who were in the labor force was $78,880, compared to only $21,027 for men in this age group not in the labor force. Moreover, 5 percent of men 20 to 64 in the labor force lived in poverty, based on this same data, compared to 29.3 percent who were not in the labor force.
8 For example, using the 2022 CPS ASEC we find that for households in which all persons are under age 65, but no one works, they pay on average $2,529 in federal income tax, compared to an average of $15,207 in households where all persons are under age 65, but at least one person works. Further, if we use the same data to look just at the biggest welfare programs (SSI, TANF, SNAP, public/rent subsidized housing, and Medicaid) and again confine the analysis to only households where everyone is under 65, it shows that, for households with no workers, 58 percent receive at least one of these programs compared to 23.8 percent for households where at least one person works.
9 We use 1962 as the starting date because that is the first year that the Ipums website has data for the CPS ASEC.
10 The Excel files (Figures 9 through 32) that accompany a prior analysis show employment patterns since 2000 by detailed education level for the U.S.-born by gender and race.
11 Figure 4 and the Excel sheets from 2002 onward report numbers for Black and white respondents who chose only one race.
12 It should also be pointed out that of the 19.1 million working-age, U.S.-born men not in the labor force in April of this year, 87 percent did not have a bachelor’s degree. If we confine the analysis to only prime-age men, it is still the case that 81 percent of those out of the labor market do not have a bachelor’s degree. The huge pool of potential male labor in the country is disproportionately less educated.
13 When thinking about this number, it is important to note both the decline in the labor force participation rate and the overall growth in the U.S.-born population. That is, an increasingly smaller share of an ever-larger total number that is in the labor force.
14 Unlike the U.S.-born population, which grows from within the country in a more predictable fashion, the immigrant population does not reproduce itself in the United States — all children born to immigrants are by definition native-born. For example, in 1960 the average male immigrant ages 16 to 64 (in and out of the labor force) was 45.8 years old, compared to 36.7 years old in 1980 and 36.2 years old in 1990. Second, 48.4 percent of working-age male immigrants were 50 and older in 1960, compared to 21.1 percent in 1980 and 17.3 percent in 1990. Age can impact participation rates. However, it should also be pointed out that the more detailed analysis reported in the Excel file (Tab 2) shows that when the analysis is confined to only male immigrants 25 to 34 we still see the same decline from 1960 to 1980. Other possible explanations for the decline include the change in the primary sending countries from Europe to Latin America and Asia, and resulting relative decline in educational attainment of immigrants. Additional analysis would be necessary to determine what factor or factors caused the decline in participation among immigrant men from 1960 to 1980. Of course, perhaps no immigrant-specific explanation is really needed since participation declined for the U.S.-born men over this time period as well. Rather, perhaps the real question is why the decline did not continue as it did for the U.S.-born.
15 All of these figures are for the working-age, ages 16 to 64, and do not include the modest number of immigrant workers over age 65.
16 This is based on decennial census data.
17 Also in 1994 there seems to be a break in the continuity of the data, with a decline in labor force participation that does not correspond to a recession, though of course employment and related statistics are always a lagging indicator of a downturn. The BLS states that, “The 1994 redesign was to improve the overall quality of labor market information through extensive question changes and the introduction of computers into the collection procedures.” The survey redesign and the new questions may explain the seemingly sudden change.
18 We see the same general pattern if we look only at the total number of employed people with just a high school education — an increase in the number employed from the 1960s to 2006, and then a decline thereafter.
19 Skill-biased technical change can be defined as any economic change resulting from new technologies that increase demand for more-skilled or educated workers relative to less-skilled, less-educated workers.
20 Figures are not just for those 16 to 64 and include those 65 and older.
21 There was a recovery in the overall number of less-educated men in the labor force so that there were somewhat more in the labor force by 2013 than there had been in 2006, but by the time of the next peak in the business cycle in 2019 that number had declined and was below the peak in 2006. This reflects the general increase in education of the population and the increasing number and share of jobs done by those with a bachelor’s or more.
22 These figures are only for those who themselves qualified for the program because they worked at some point in their lives. Some people on disability do work, but most do not because they are unable to do so and because there are significant limits on how much they are allowed to do so and still qualify for benefits.
23 If we look at those 25 to 34, we also see very roughly the same decline in labor force participation and the same is true of young people 16 to 24.