The Census Bureau’s Current Population Survey (CPS) shows that the total foreign-born or immigrant population (legal and illegal) was 49.5 million in October 2023 — a 4.5 million increase since President Biden took office and a new record high. At 15 percent, the foreign-born share of the U.S. population is also the highest ever recorded in American history. As the debate rages over the ongoing border crisis, this finding is important because administrative numbers such as border encounters or even legal immigrant arrivals do not measure the actual size of the immigrant population, which is what ultimately determines immigration’s impact on the country.
Among the findings:
- In October 2023, the CPS shows that 15 percent of the U.S. population is now foreign-born — higher than any U.S. government survey or census has ever recorded.
- The 49.5 million foreign-born residents (legal and illegal) in October 2023 is also a new record high.
- Since President Biden took office in January 2021, the foreign-born population has grown by 4.5 million — larger than the individual populations of 25 U.S. states.
- Based on our prior estimates of illegal immigrants, more than half (2.5 million) of the 4.5 million increase in the foreign-born population since January 2021 is likely due to illegal immigration. If adjusted for those missed by the survey, the increase would be larger.
- The 4.5 million increase overall and the 2.5 million increase in illegal immigrants are both net figures. The number of new arrivals was significantly higher, but was offset by outmigration and natural mortality among the foreign-born already here.
- The foreign-born population has grown on average by 137,000 a month since President Biden took office, compared to 42,000 a month during Trump’s presidency before Covid-19 hit, and 68,000 a month during President Obama’s two terms.
- The scale of immigration is so high that it appears to have made the new Census Bureau population projections, published on November 9 of this year, obsolete. The bureau projected that the foreign-born share was not supposed to hit 15 percent until 2033.
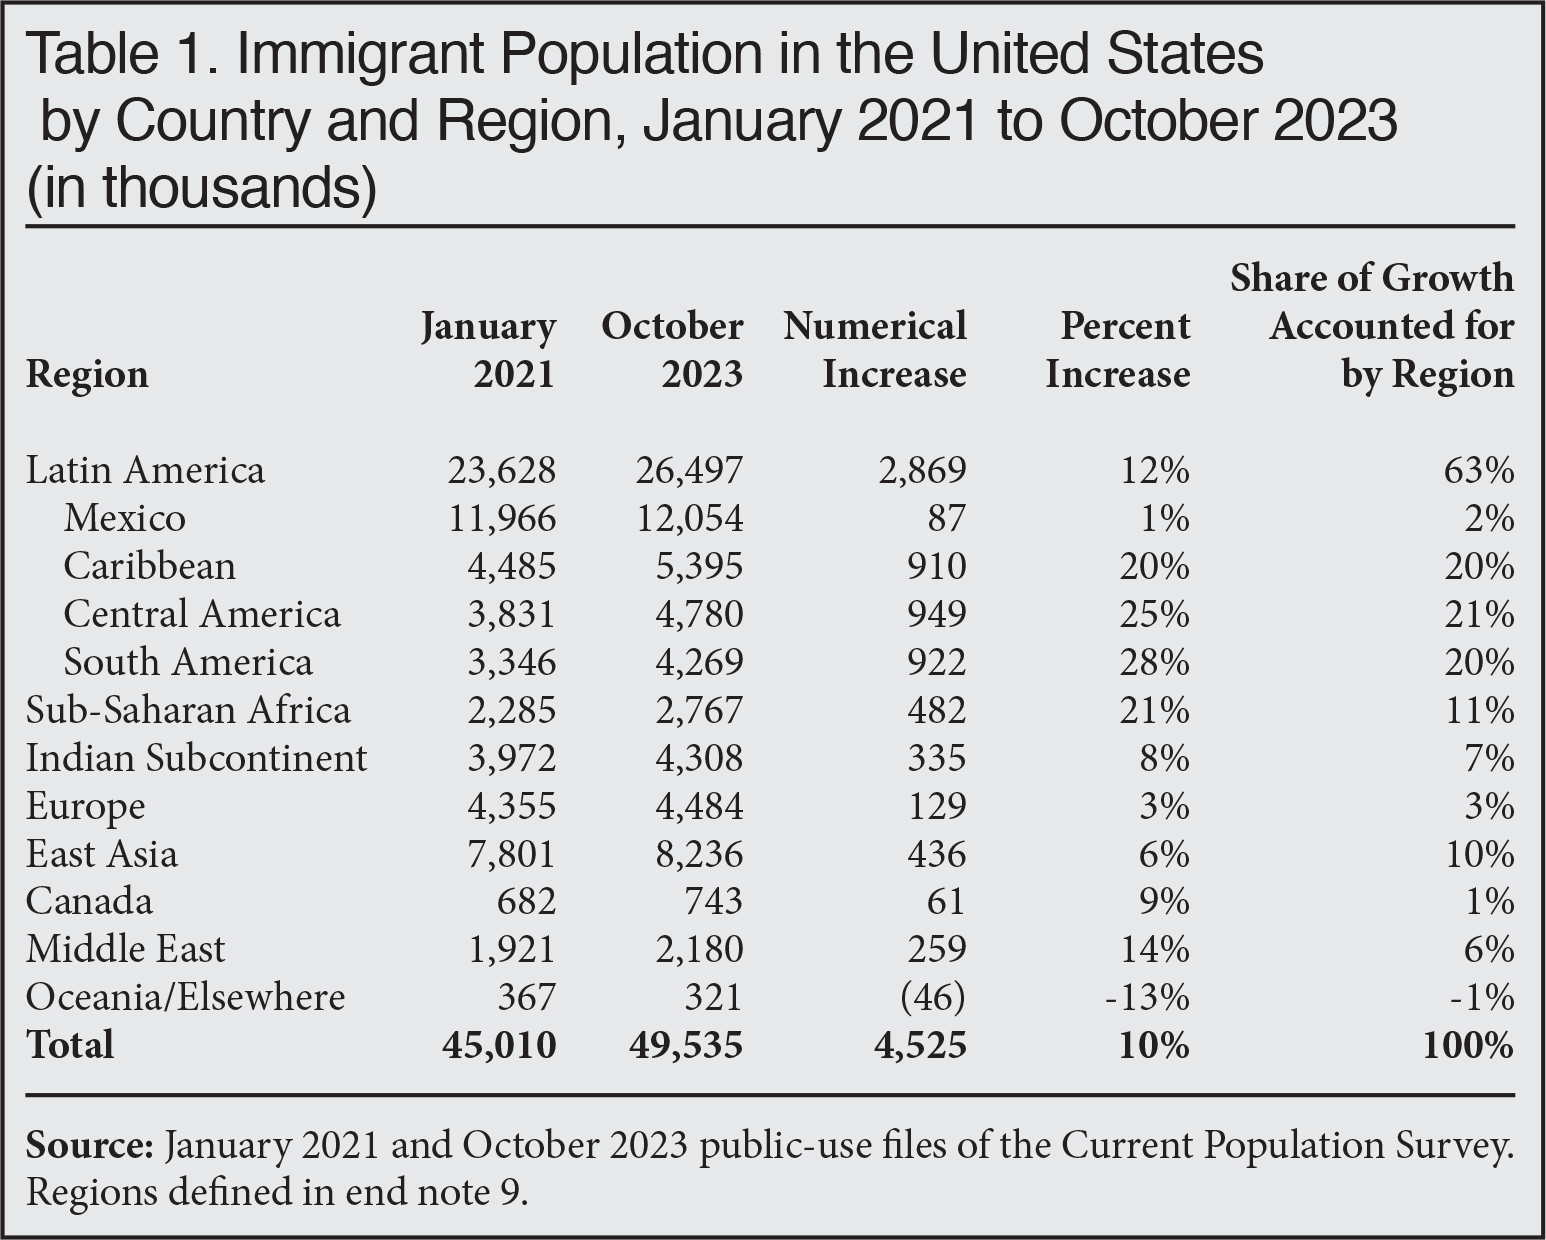
- The largest percentage increases since January 2021 are for immigrants from South America (up 28 percent); Central America (up 25 percent); Sub-Saharan Africa (up 21 percent); the Caribbean (up 20 percent); and the Middle East (up 14 percent).
- Immigrants from all of Latin America increased by 2.9 million since January 2021, accounting for 63 percent of the total increase in the foreign-born.
- While a large share of the recent foreign-born growth is due to illegal immigration, legal immigrants still account for three-fourths of the total foreign-born population.
The Center for Immigration Studies hosted a panel discussion entitled “The Size and Implications of the Immigrant Population” on Monday, December 11, 2023 at 2:00 p.m.
Introduction
This analysis is based on the Current Population Survey (CPS), sometimes referred to as the “household survey”, collected each month by the Census Bureau for the Bureau of Labor Statistics (BLS). The primary purpose of the survey is to collect information about the U.S. labor market, such as the unemployment rate, but starting in 1994 questions about citizenship, country of birth, and year of arrival were added. While the larger American Community Survey (ACS) is often used to study the foreign-born, the most recent version of the ACS reflects only the population in July 2022 and does not fully reflect the rapidly evolving border crisis. Using the monthly CPS allows us to have an up-to-date picture of what is happening. Also, the CPS seems to do a better job of capturing the dramatic growth in the foreign-born population in the last few years. In the Appendix we discuss the ACS compared to the CPS.
We use the terms “immigrant” and “foreign-born” interchangeably in this report.1 The foreign-born in Census Bureau data includes all persons who were not U.S. citizens at birth — mainly naturalized citizens, lawful permanent residents, long-term temporary visitors, and illegal immigrants. The CPS shows a dramatic rebound in the foreign-born population after declining some in the latter half of 2019 followed by a dramatic fall-off in 2020 due to Covid-19 travel restrictions. While the monthly CPS is a very large survey of about 130,000 individuals, the total foreign-born population in the data still has a margin of error of about ±550,000 using a 90 percent confidence level. This means there is fluctuation from month to month in the size of this population, making it necessary to compare longer periods of time when trying to determine trends.2
Growth in The Foreign-Born Population
Recent Growth in the Foreign-Born. Figure 1 reports the total number of foreign-born residents in the United States from May 2019 to October 2023. The figure shows that even though the economy was expanding in the months before the pandemic, the foreign-born population was trending down in the latter part of 2019. Once travel restrictions were imposed and Title 42 was implemented at the border, the immigrant population declined through the middle of 2020, hitting a low of 43.8 million in August and September of that year. People still arrived in 2020 but outmigration and natural mortality were higher, and so the total immigrant population fell. The foreign-born population has rebounded dramatically by 5.75 million after hitting a low in late summer of 2020. However, it is possible that some of the initial increase after Covid may have been due to better data collection as the pandemic abated rather than an actual increase in the immigrant population.
Figure 1. There are fluctuations in the data, but since President Biden’s election the foreign-born population has grown spectacularly (in millions). |
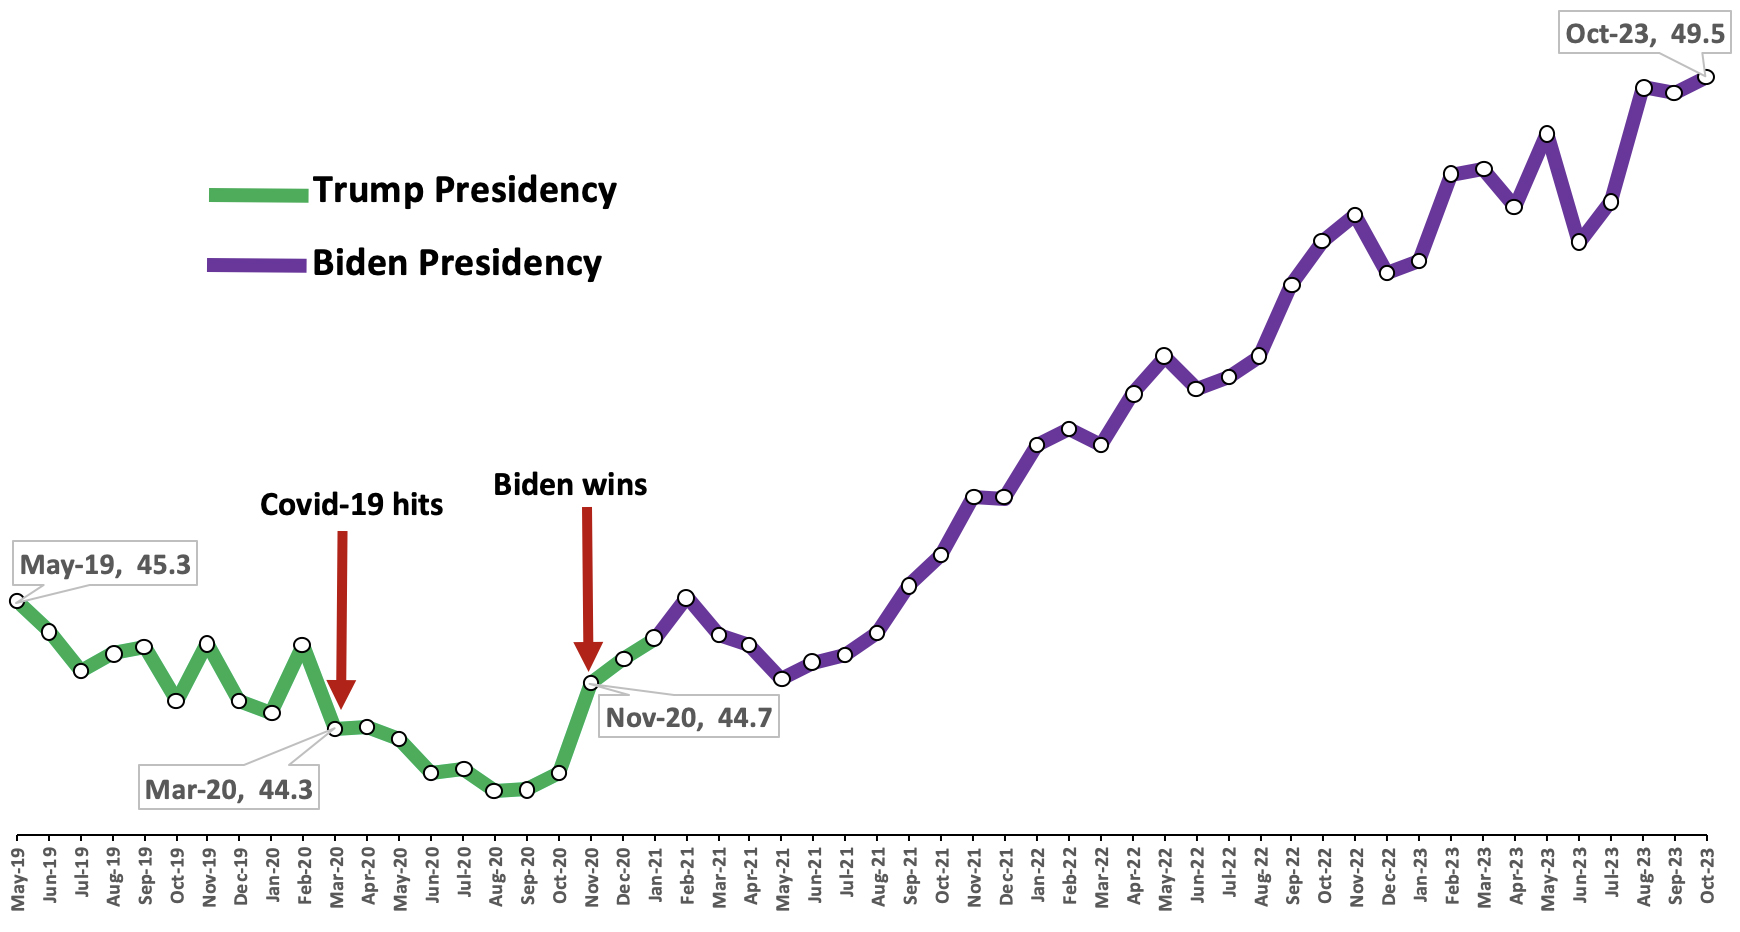 |
Source: May 2019 to October 2023 public-use Current Population Survey. |
Growth in the Foreign-Born Population under Biden. Focusing on the period after President Biden took office in January 2021 shows an increase of 4.5 million. The increase during Biden’s first 34 months is unprecedented.3 What is so striking about the recent run-up in the number of immigrants is that the increase represents a net change, not merely new inflow. The foreign-born population can only grow when immigrants arrive from abroad, but these new arrivals are always offset by emigration and mortality among the existing immigrant population. All births to immigrants in the United States, by definition, can add only to the native-born population. This means that significantly more than 4.5 million people had to have arrived from abroad for it to grow this much.
The Number of New Arrivals. Responses to the year of arrival question in the public-use CPS are grouped into multi-year cohorts to preserve anonymity. The October 2023 CPS groups those who arrived from 2020 to 2023 together. In the October data, 6.3 million immigrants told the Census Bureau that they arrived in 2020 or later. From other data, we can estimate that about 700,000 immigrants arrived in 2020, which was a very low year of immigration due to Covid-19.4 This indicates that 5.6 million new immigrants arrived from January 2021 to October 2023, translating to two million arrivals each year since January 2021 on an annualized basis. This is much higher than annual immigration measured by the ACS, which has individual year of arrival data.5 However, given the 4.5 million growth over this time, 5.6 million arrivals seems low: First, we are not certain of the 5.6 million figure. Second, there are, of course, margins of error around all of these numbers.6 The margin of error for 5.6 million immigrants is ±200,000, using a 90 percent confidence level, and, as already indicated, the margin of error around the total foreign-born is ±550,00. Perhaps most important, capturing newly arrived immigrants in any survey is difficult, so the undercount in the CPS is likely concentrated among the newest immigrants, and this may explain why the arrivals data seems low relative to growth.7
Biden Compared to His Immediate Predecessors. Figure 2 shows the size of the foreign-born population from the start of President Obama’s first term in January 2009 to October of this year, along with margins of error. There are clearly significant fluctuations in the size of the immigrant population over the last decade and a half. But looking at each presidency shows that growth since the start of the Biden administration is dramatically higher. So far it has averaged 137,000 a month since President Biden took office compared to 42,000 a month during Trump’s presidency before Covid-19 hit — January 2017 to February 2020. The average increase during Biden’s presidency is nearly double the 76,000 a month average during Obama’s second term and significantly more than double the average increase of 59,000 in Obama’s first term.8 If Obama’s presidency is taken as a whole, growth averaged about 68,000 per month. Averaging many months together reduces month-to-month fluctuation and shows that the pace of growth during the Biden administration has been much higher than his immediate predecessors.
Figure 2. The foreign-born population grew slower during Trump’s presidency (pre-Covid) than Obama’s, while growth in Biden’s term so far is dramatically higher than in his two immediate predecessors’ terms (in millions). |
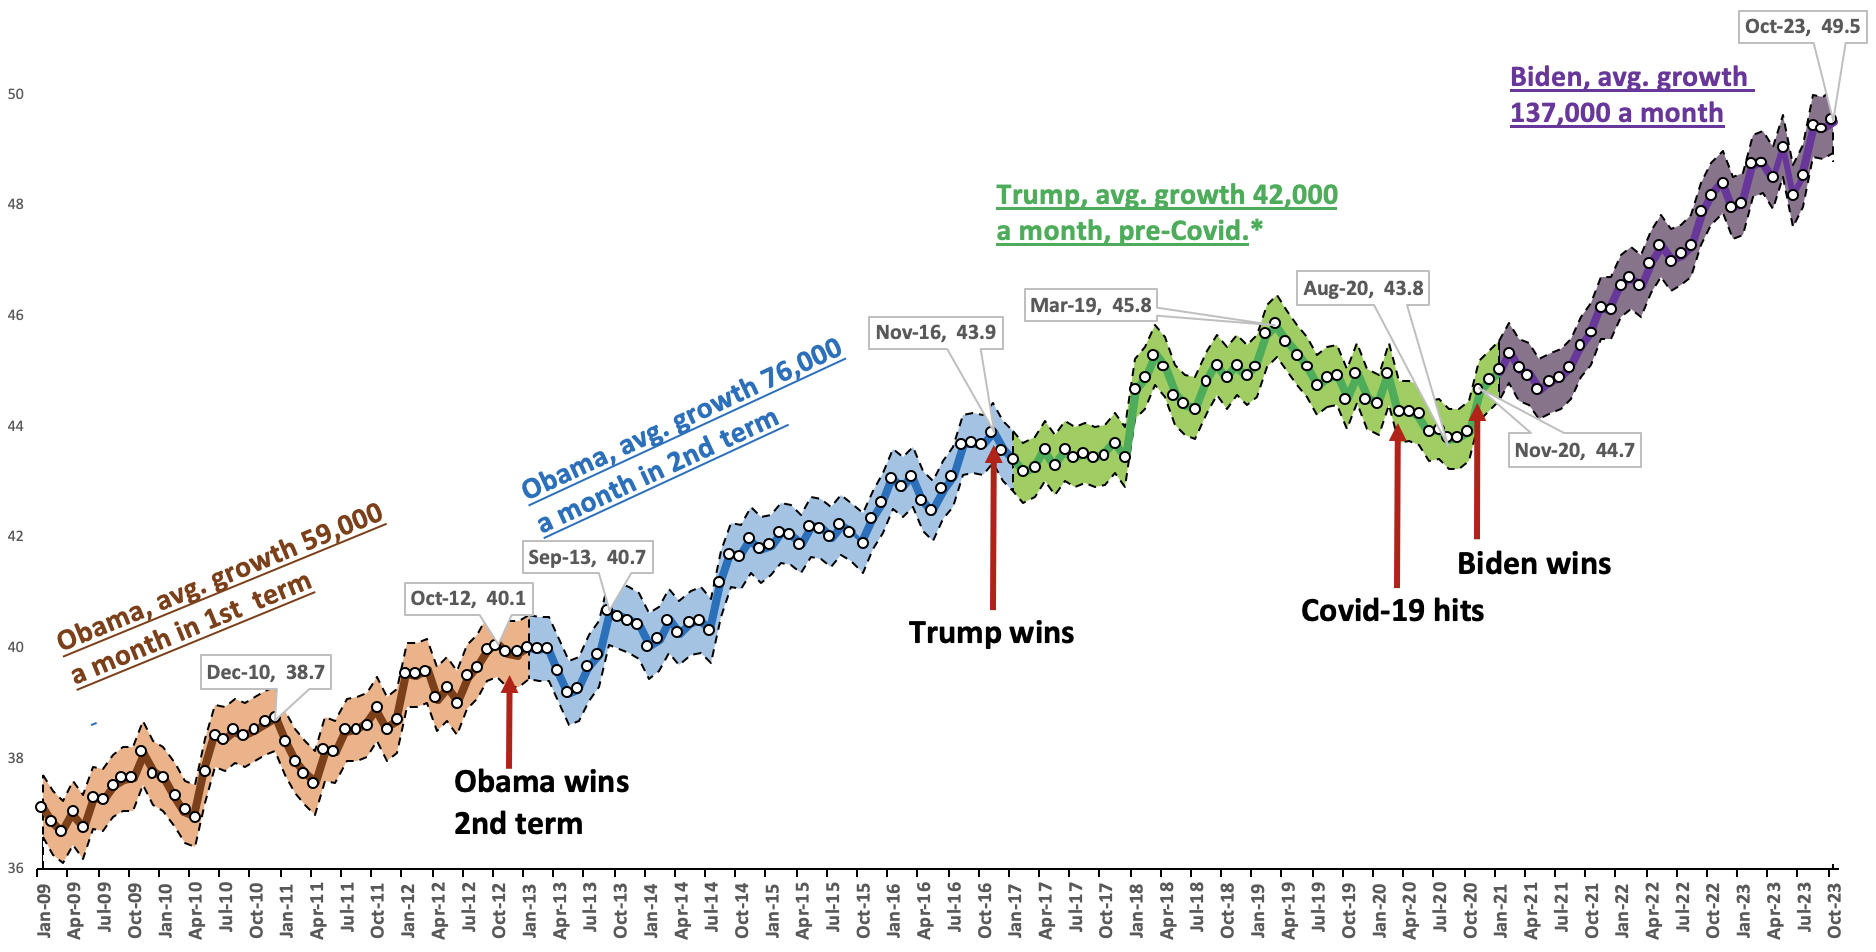 |
Source: January 2009 to October 2023 public-use files of the Current Population Survey. Shaded area shows the margins of error around the point estimates, assuming a 90 percent confidence level. |
Growth by Sending Region. Table 1 shows immigrants by region in January 2021 and October 2023. Since January 2021, South America increased the most at 28 percent, followed by Central America at 25 percent, Sub-Saharan Africa at 21 percent, the Caribbean at 20 percent, and the Middle East at 14 percent. Growth in the number of immigrants from the Caribbean, Central America, and South America each account for roughly one fifth of the total increase. Sub-Saharan Africa and East Asia accounted for another tenth each.9 As discussed later in this report, the substantial increase in immigrants from Latin America is an indication that illegal immigration has played a large role in the recent growth of the foreign-born population. By October 2023, Latin Americans were 53.5 percent of the total foreign-born living in the United States.
 |
Historical Perspective. Figure 3 shows the number and foreign-born share of the U.S. population since 1850, which was the first time they were identified in the Census. The number of immigrants has increased five-fold since 1970, 2.5-fold since 1990, and 59 percent since 2000. As a share of the population, even in 1890 (14.8 percent) and 1910 (14.7 percent) during what is often called the “Great Wave” of immigration, the foreign-born were a slightly smaller share of the population than they are today.10 The 15 percent in October of this year is the highest percentage ever reported in any Census or government survey in U.S. history. The share is triple what it was in 1970 and nearly double that of 1990. If the immigrant population continues to grow, it will set new numerical and percentage records every year going forward. When thinking about the impact on American society, it seems fair to assume that both the size of the foreign-born population and its share of the population matter.11
Figure 3. The foreign-born number and share are higher now than at any time in American history. |
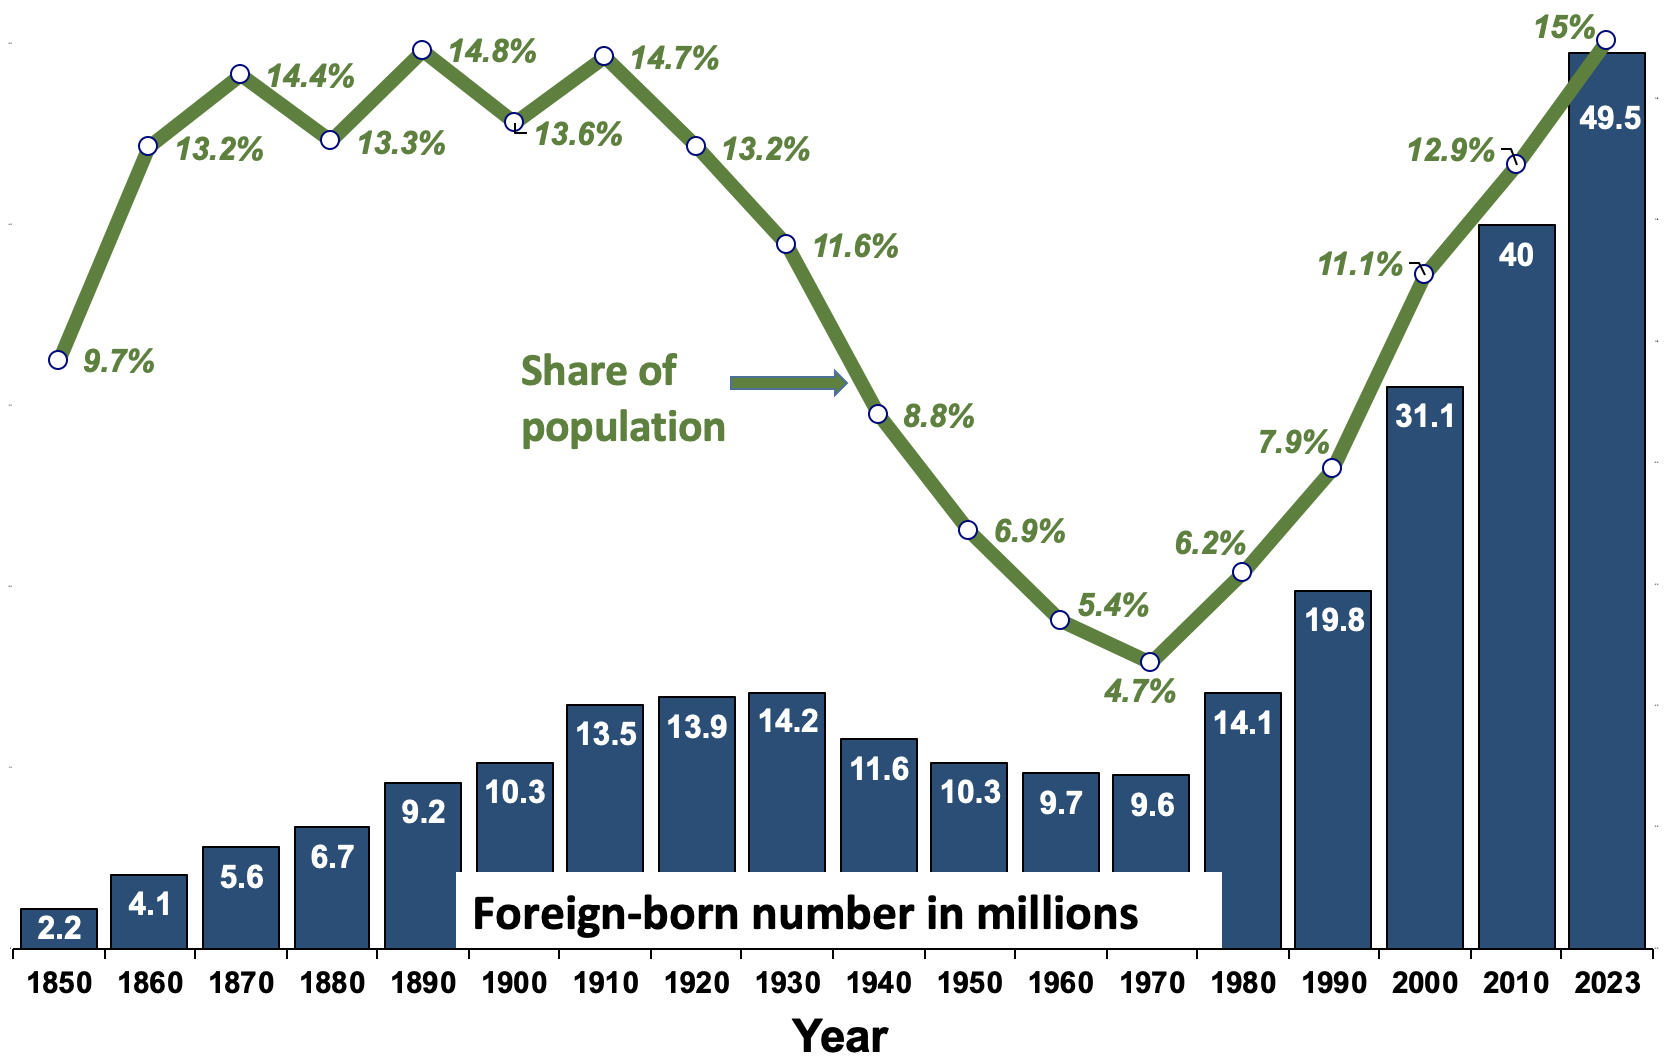 |
Sources: Decennial Census for 1850 to 2000, American Community Survey for 2010, October Current Population Survey (CPS) for 2023. The CPS does not include the institutionalized. |
What’s Causing the Rapid Growth?
A Resumption of Prior Trends? One interpretation of the dramatic growth in the foreign-born population is that it is making up for the slowdown during Covid-19. There is truth to this, especially when it comes to legal immigration. During Covid, the processing of visas overseas greatly slowed. Of course, there is no reason legal immigration had to return to pre-pandemic levels, as the number of immigrants admitted is a discretionary policy set by Congress. The scale of illegal immigration is also certainly not pre-determined, as the level of resources and effort devoted to controlling it reflects each administration’s goals and policy choices. Figure 4 shows the number of immigrants in October each year from 2010 to 2023 and a line reflecting the pre-Covid-19 (2010 to 2019) trend. The recent growth in the size of the foreign-born is clearly above the pre-pandemic trend line. Figure 5 shows the same is true for the foreign-born share of the U.S. population. At least when measured this way, it would be a mistake to argue that the recent rapid increase in the number is simply a resumption in trends prior to the pandemic.
Figure 4. The increase in the size of the foreign-born population is well above the 2010 to 2019 pre-Covid trend line (in millions). |
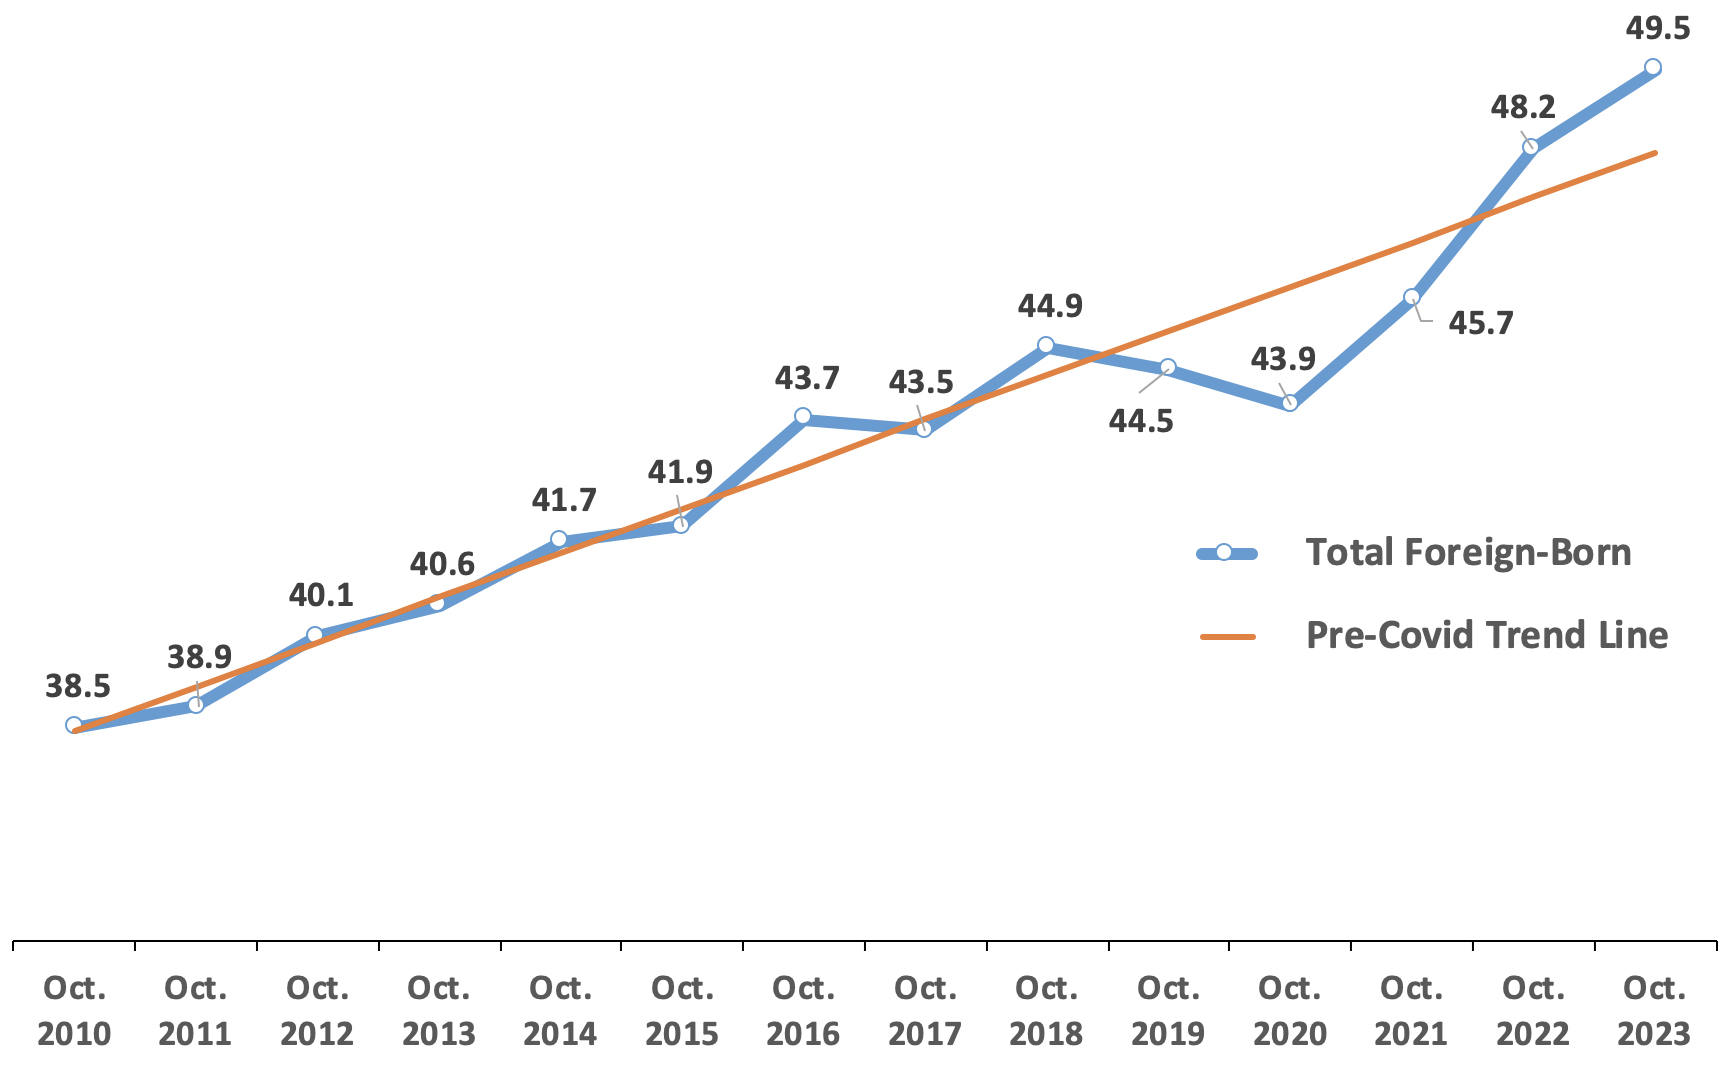 |
Source: October 2010 to October 2023 public-use Current Population Survey. |
Figure 5. The increase in the foreign-born share of the U.S. population is well above the 2010 to 2019 pre-Covid trend line. |
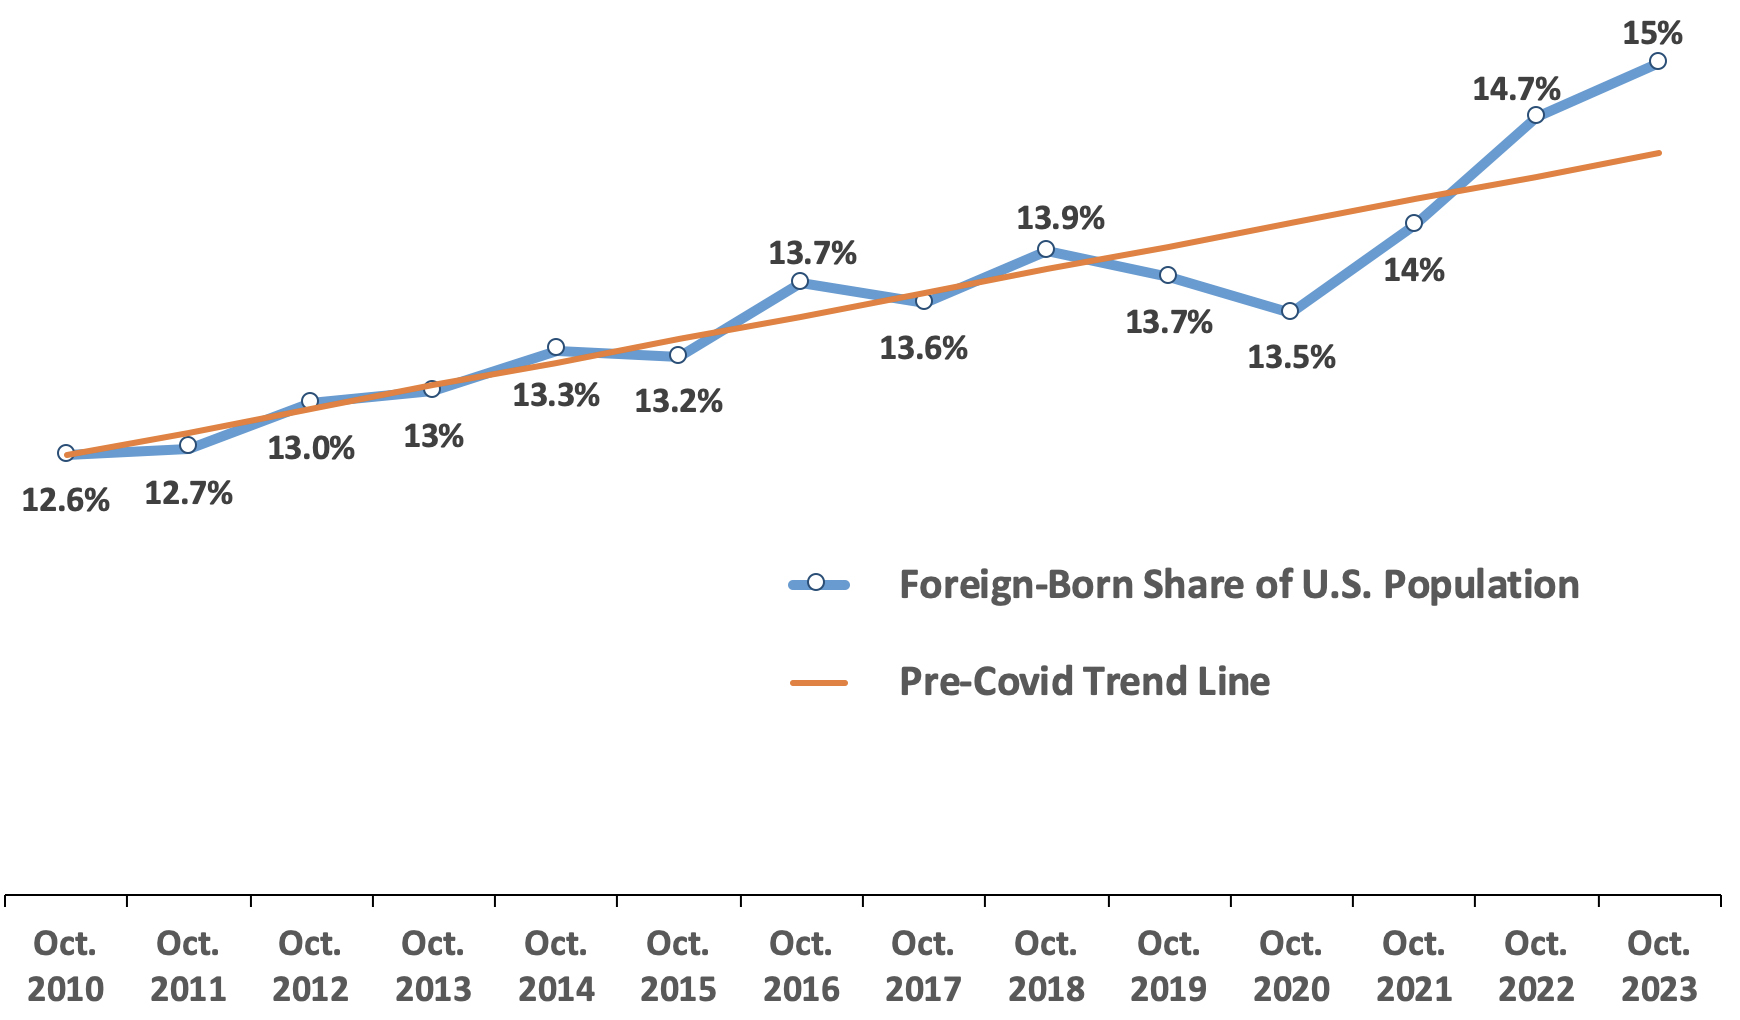 |
Source: October 2010 to October 2023 public-use Current Population Survey. |
Border Surge and Aliens Released. From January 2021 to October 2023, there have been roughly eight million “encounters” at U.S. borders.12 This appears to be a record for a 34-month period, though in the past they were called “apprehensions”, which is a slightly different concept. Even more important, court records and other information on the Department of Homeland Security (DHS) websites indicate that about 2.6 million (possibly 2.7 million) inadmissible aliens have been released into the country since the start of the Biden administration.13 It is important to note that as inadmissible aliens virtually all of those released are not considered to have been formally admitted into the United States. As such, they are subject to removal as illegal immigrants, even those who have been granted parole status. In addition, the number of “got-aways”, subjects observed entering illegally but not stopped or turned back, more than doubled to 391,000 in 2021 compared to 2019 before the pandemic.14 DHS has not updated this number. However, media accounts and DHS Secretary Mayorkas’ response to a reporter’s question in May 2023 suggest that there have been 1.5 million got-aways in FY 2021 and 2022 — five to six times the annual level pre-pandemic.15 Those released into the country and got-aways represent enormous new additions to the foreign-born population.
The huge increase in border encounters and got-aways seems closely related to the president’s campaign promises that created the accurate perception, well before he even took office, that he would curtail immigration enforcement. Ending the Migrant Protection Protocols (also called Remain in Mexico) for many asylum applicants, the scaling back of Title 42, and then the decision to end it all together also helped spur more illegal immigration. The decision to release so many people into the country also causes even more people to make their way to the border in the hopes of getting released. It also causes ever more people to use the new CBP One app created by the administration to help inadmissible aliens schedule their entry.
Fall in Interior Enforcement. Another factor that has played a role in encouraging illegal immigration is the dramatic decline in interior enforcement. In the first two years of the Biden administration, removals from within the country by Immigration and Customs Enforcement (ICE) were less than half what they were in prior years. In FY 2020, 186,000 aliens were removed. This fell to 59,000 in FY 2021 and increased only slightly to 72,000 in FY 2022.16 The administration has also refused to take custody of non-citizens released from jails and prisons in some cases. Corey Price, acting associate director for Enforcement and Removal Operations at ICE, testified in a lawsuit brought by Florida that the administration removed many fewer illegal immigrants than were removed a decade earlier as a matter of policy. The decision to reduce interior enforcement not only means more illegal immigrants remain in the country, it also encourages others to come and stay knowing that they will probably never be made to leave.
Visa Overstays. A significant number of new illegal immigrants, and perhaps a majority before the current border surge, were admitted legally on a temporary visa or under the visa waiver program and then did not leave the country when the time limit expired. DHS for FY 2022 showed 850,000 foreign visitors overstayed their authorized stay in that year.17 The total overstay rate for 2022 was 3.64 percent, which is more than double the rate of recent years. Of course, not all of these individuals stay long-term, and there is always some number of people who leave the country but whose departure was not properly recorded. Still, overstays have increased.18 Those overstayers who chose to stay long-term represent new additions to the nation’s immigrant population.
Rebound in Legal Immigration. The number of legal permanent residents (green card holders) arriving from abroad — in contrast to those “adjusting status” from within the U.S. — fell significantly during Covid, but it has rebounded since. In the first quarter of 2021, only 23,000 new green card holders were admitted from abroad, but the number increased steadily thereafter and was 105,000 by the fourth quarter of that year. Moreover, the number of permanent immigrants arriving from abroad increased from 227,000 for all of FY 2021 to 446,000 for FY 2022.19 The number of long-term temporary visas and refugee resettlement also show a significant rebound since Covid.20 Legal immigrants account for some 44 percent of the increase in the total foreign-born population since January 2021. Moreover, legal immigrants, including long-term temporary visitors, still account for three-quarters of the total foreign-born residing in the United States.
Estimating Illegal Immigration
Illegal Immigrants in the CPS. In testimony prepared in September for the Subcommittee on Health, Employment, Labor, and Pensions, of the Education and the Workforce Committee of the House of Representatives, we preliminarily estimated that the illegal population grew from 10.2 million in January 2021 to 12.6 million by May 2023. These figures are based on the CPS but are adjusted for those missed by the survey. Without an undercount adjustment, there were 12.3 million illegal immigrants in the May 2023 CPS, compared to 10 million in January 2021. Unfortunately, all of the administrative data on legal immigration is not yet available to properly estimate illegal immigration through October 2023. But given the ongoing border crisis we have no reason to believe that things have changed significantly since May. If that is correct, then about 2.5 million of the 4.5 million increase in the foreign-born in the CPS from January 2021 to October 2023 is due to illegal immigration. This number is unadjusted for undercount of illegal immigrants in the CPS. If adjusted, it could mean the illegal population was 12.8 million in October of this year, up from 10.2 million (undercount adjusted) in January 2021. All of these numbers represent a net increase — the number of new illegal immigrants arriving over the time period is a good deal higher but is offset by outmigration, adjustments of status (legalization), and deaths.
Indirect Evidence of Illegal Immigration. For the most part, illegal immigrants should show up in Census Bureau surveys as non-citizens who, because of the 1986 IRCA amnesty, arrived in 1980 or later.21 We also know from research by the federal government, the Center for Migration Studies, the Pew Research Center, and the Migration Policy Institute that roughly three-quarters of illegal immigrants are from Latin America.22 As a result, the post-1980 non-citizen Latin American immigrant population overlaps significantly with the illegal immigrant population.23 Figure 6 shows the relative stability in this population from October 2010 to October 2019. This relative stability is consistent with the estimates by the above organizations showing relatively modest changes in the illegal immigrant population over this time period.24 However, that has now changed. Compared to 2019, before Covid-19 hit, the Latin American immigrant population has increased by three million. To be sure, not all illegal immigrants come from the Western Hemisphere, and there are many legal immigrants from this region. That said, the growth of non-citizens from this part of the world adds support to the idea that the illegal immigrant population has grown considerably in recent years.
Figure 6. The number of non-citizen Latin American immigrants who arrived in 1980 or later,* who substantially overlap with illegal immigrants, was relatively stable prior to Covid-19, but it has increased significantly since (in millions). |
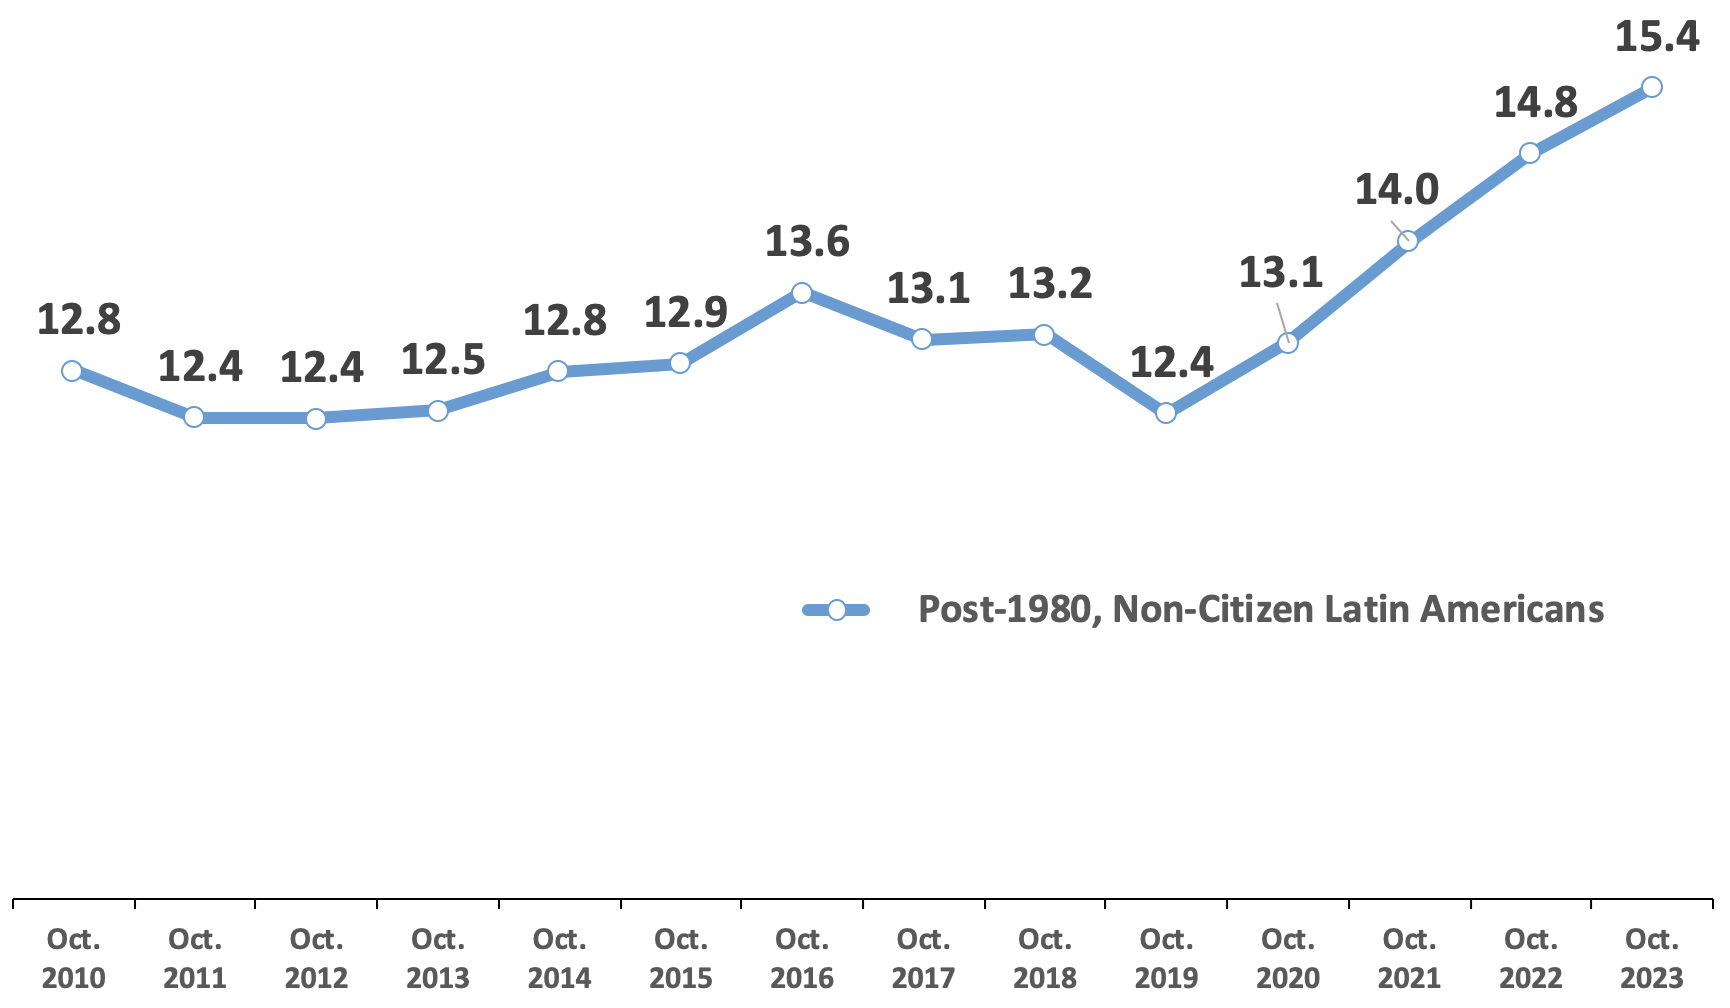 |
Source: October 2010 to October 2023 public-use Current Population Survey. |
Where We’re Headed
New Census Bureau Projections. On November 9 of this year the Census Bureau put out new population projections. When they were released, we expressed concerns about the level of net migration they estimated. The Census Bureau’s “main series” projection shows a level of migration that simply does not comport with what the CPS or ACS shows.25 Furthermore, for 2023 the projections show a total foreign-born population of 47.05 million — which is 2.5 million below what the October 2023 CPS shows. Moreover, the projections show that the foreign-born share of the U.S. population was not supposed to hit 15 percent until 2033, and the total number was not supposed to hit 49.5 million until 2027 or 2028.26 The recent run-up in the foreign-born numbers has been so rapid that it appears to have made the new projections obsolete.
Projecting the Near-Term. Figure 7 projects the foreign-born population to the end of a hypothetical Biden second term using a linear model based on trends since he took office in January 2021. It shows that the foreign-born would reach 51.3 million and 15.5 percent of the total U.S population by the end of his first term in December 2024. If present trends are allowed to continue, the total number of immigrants would reach 58.9 million and 17.3 percent of the total population by the end of a second Biden term. These numbers and percentages are, of course, all new record highs. If this happens it would mean that during his eight years, the foreign-born population would grow by 14 million — much of it illegal. This would exceed even the 11.1 million increase in the 10 years between 1990 and 2000, which is the largest numerical intercensal increase in the foreign-born population ever. Of course, this is far from certain. But Figure 7 does represent one possible future based on what’s happening right now.
Figure 7. The foreign-born number and share of the U.S. population are already at record levels. If present trends continue, new records will be set every year during a second Biden term. |
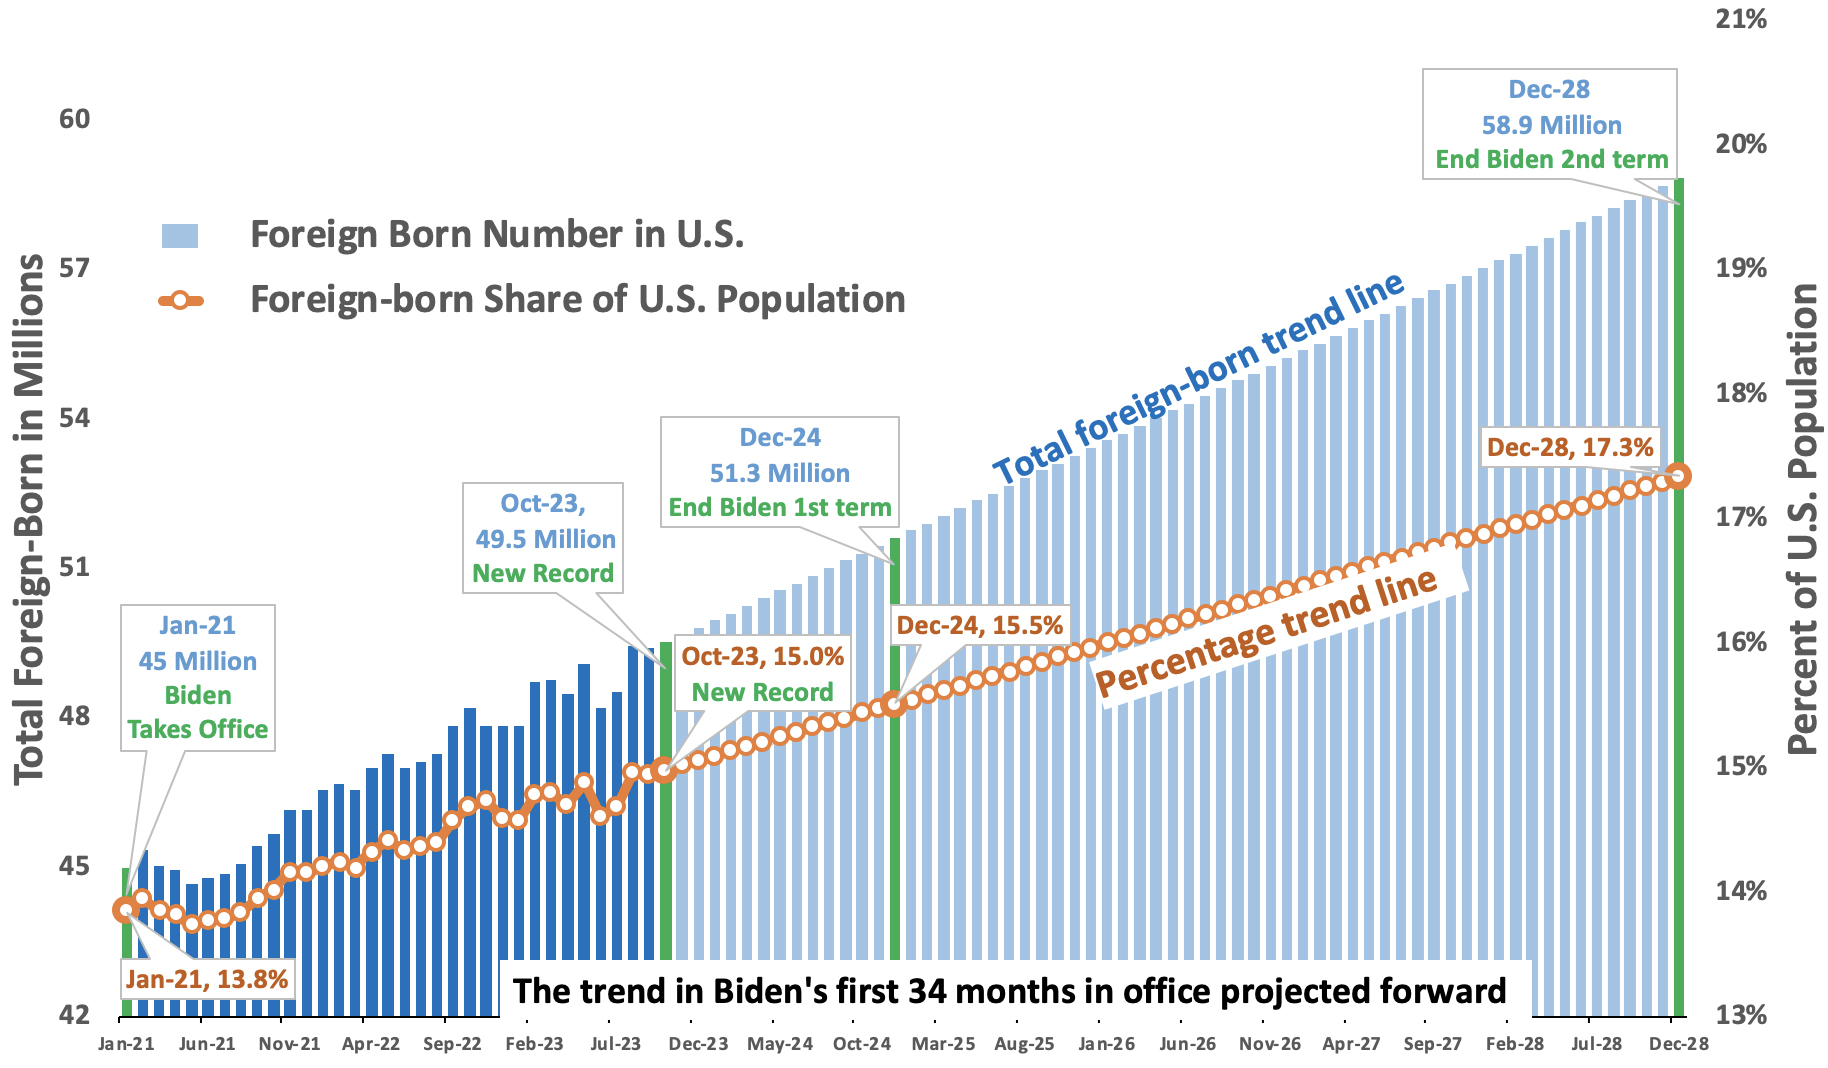 |
Sources: Trend lines reflect linear projections in the size of the foreign-born population and its share of the U.S. population based on the public-use files of the Current Population Surveys from January 2021 to October 2023. |
Conclusion
The current scale of immigration (legal and illegal) into the United States has been truly enormous. The October 2023 Current Population Survey (CPS), collected by the Census Bureau, shows that 15 percent of the U.S. population is now foreign-born — the largest share on record. The prior record was 14.8 percent, 133 years ago in 1890. The immigrant share of the population has more than tripled since 1970 and nearly doubled since 1990. The number of immigrants has increased five-fold since 1970, 2.5 times since 1990, and is up 59 percent since 2000. The 49.5 million foreign-born residents now living in the U.S. is a new record high in American history. Since President Biden took office in January 2021 it has increased by 4.5 million — larger than the individual populations of 25 U.S. states. It is very likely that more than half of this increase, 2.5 million, is from new illegal immigration. This recent growth has important implications for everything from the nation’s education and healthcare systems to its physical infrastructure and labor force. Perhaps the most fundamental question these numbers raise is whether America can successfully incorporate and assimilate this many people.
The size and growth of the immigrant population is not static. Legal immigration continues at least at the pre-Covid pace, and illegal immigration almost certainly remains very high. If legal and illegal immigration were to continue at the current level, we project that the total foreign-born population will reach nearly 59 million and 17.3 percent of population by the end of Biden’s second term in December 2028. Adding so many people to the country so fast may please employers and immigration advocacy groups, but any serious discussion of immigration policy has to grapple with these numbers and the implications they have for American society.
Appendix: Comparing Census Surveys
Understanding Survey Data. Like virtually all modern surveys, the CPS is weighted to reflect the size and characteristics of the population of interest. Census Bureau surveys are weighted by key variables such as sex, race, age, and Hispanic origin, so that the resulting population totals reflect what the bureau believes is the actual U.S. population. For example, each of the 340 non-Hispanic white men age 26 surveyed by the October CPS were given a weight of roughly 2,900 on average, and the 70 non-Hispanic black women in the survey age 26 were given a weight of roughly 5,000 on average. This is done based on what the Bureau believes is the total number of people in each of these populations. The weights used in Census surveys reflect the “population estimates”, which begin with the results of the decennial census that are then added to each year based on birth and death records and estimates of net migration. To a large extent, the quality of survey results depends on the accuracy of the weights.
Net Migration and the Weights. As we have discussed more than once in prior publications, the big issue with the population estimates, and the resulting weights used for surveys, is the migration component. The bureau has struggled with estimating what it calls “net international migration” (NIM) — the difference between the number of people coming vs. leaving each year — for a very long time. In December 2022 they even went back and re-estimated migration from 2010 to 2020 and found that they had underestimated NIM in every year by a combined 1.94 million. The sample weights do reflect illegal immigration, but even the new migration methodology cannot fully reflect the kind of dramatic and sudden increase in illegal immigration we have seen in the last few years. The bureau’s estimate of NIM partly relied on comparing ACS data year-over-year. Thus, their migration estimates and the weights that are based on them simply cannot account for the huge numbers released into the country and the increase in got-aways.
How the Weights Impact the Foreign-Born. In the discussion of the surveys’ results below, the ACS and CPS have somewhat different methodologies and population universes, but their weights reflect the same basic population estimates.27 If the migration component of the weights is underestimated, it means estimates of the foreign-born will be off, but not necessarily widely inaccurate. Being foreign-born is not one of the variables used by the bureau to weight the data. Being an immigrant is a characteristic, like unemployment or income, that is based on responses to the survey. Again, this is unlike a variable like race, which is controlled to a particular population total by the survey’s weights. However, because race and being an immigrant are correlated, an underestimate of migration will indirectly impact the size of the foreign-born. That is, nearly three-quarters of the foreign-born are Asian or Hispanic, so if estimates of migration are too low, they will result in weighted totals for the foreign-born that are too low.
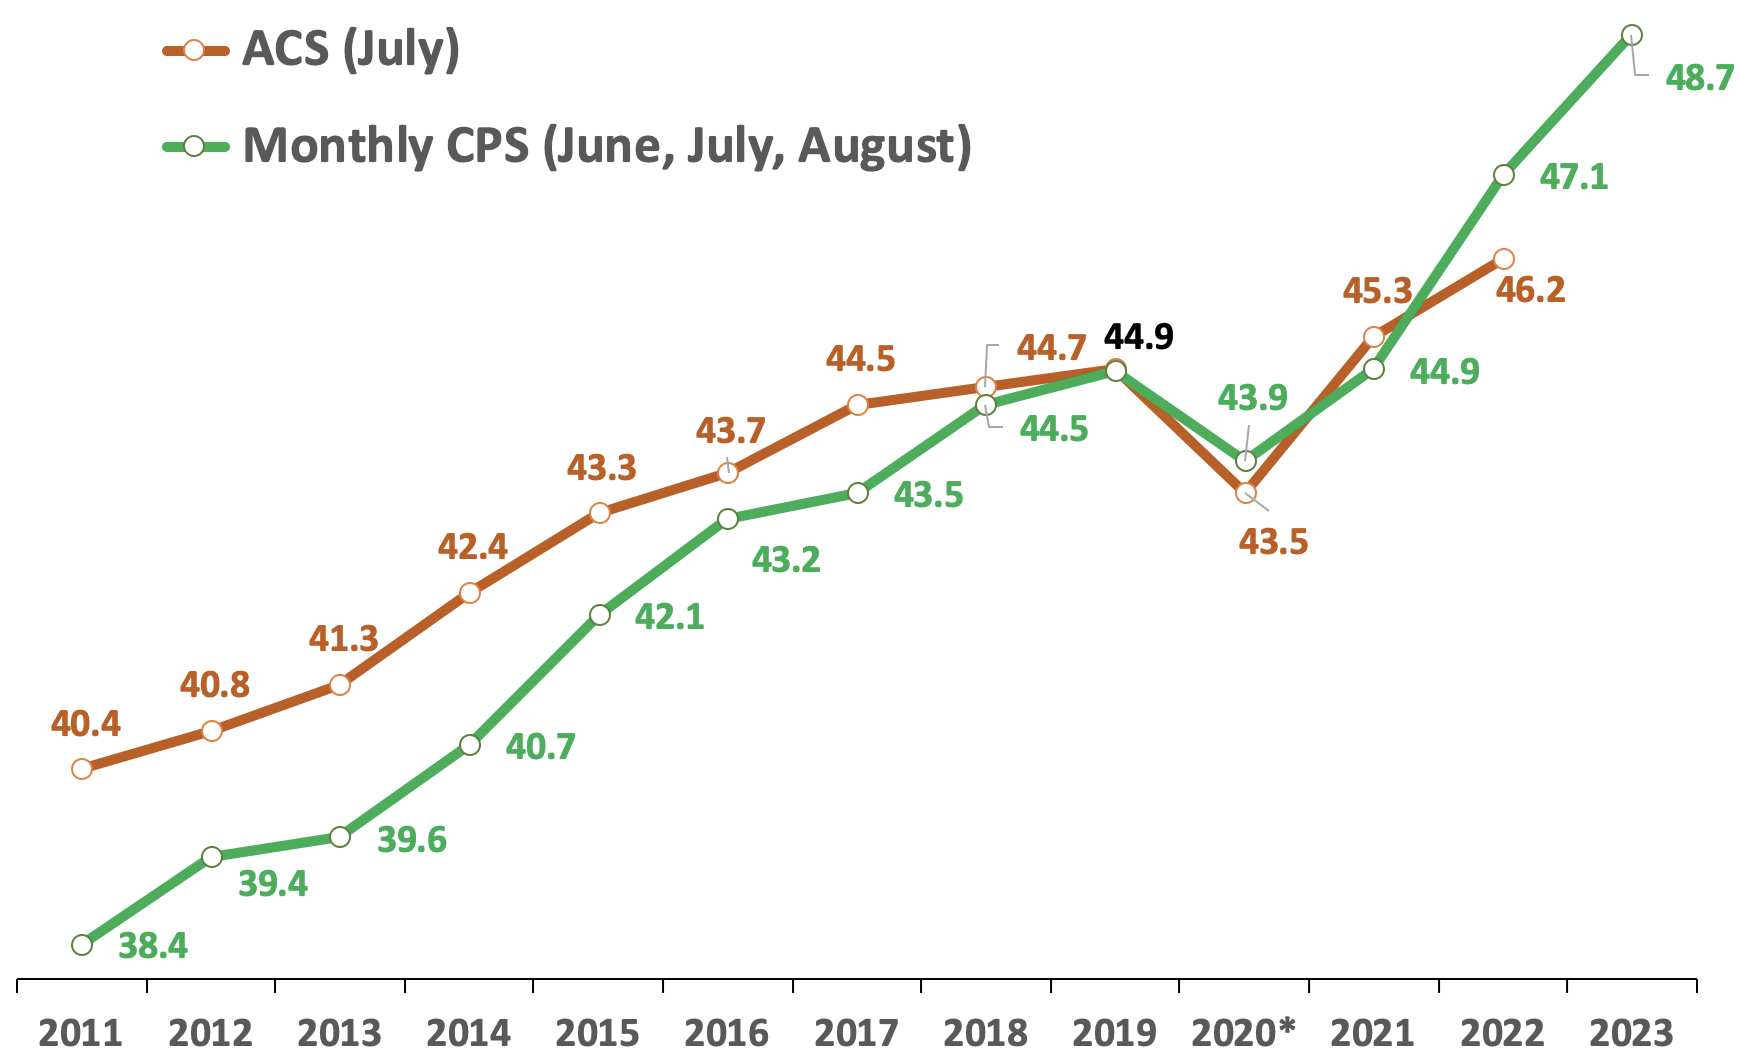
Monthly CPS Compared to ACS. The American Community Survey (ACS) is a much larger survey than the monthly CPS we use throughout this analysis.28 As we discussed in the introduction, the very large size of the ACS makes it ideal for studying subpopulations such as the foreign-born, but it is not released on as timely a basis as the CPS, so it does not reflect the current immigration situation as well. Figure 7 compares the foreign-born population in the ACS to a combined three-month sample (June, July, August) of the monthly CPS. Using the summer months allows us to roughly match the July control date of the ACS, and using three months creates more statistically robust estimates. The ACS consistently produced much larger estimates of the foreign-born than the summer CPS until 2018. This is expected because the ACS includes the institutionalized. From 2018 to 2021, the result of the surveys was similar, which is surprising. In 2022, the summer months of the CPS show a foreign-born population that is actually one million larger than the ACS — a statistically significant difference.29 The 880,000 growth in the foreign-born in the ACS from 2021 to 2022 is also much less than half the 2.2 million growth in the summer months of the CPS over this time period. Why the relative measurement of the foreign-born in the two surveys changed is unclear.
Is the CPS Better? Given the unprecedented nature of the current immigration influx, it is possible that, because the CPS requires an initial in-person interview, it better captures the foreign-born when the roster of household members is first established at the time of the first interview. Respondents can be confused about who is supposed to be considered part of the household, particularly if someone just arrived or is expected to stay only a short time. Speaking with a survey taker may help clear up any confusion, who will also reassure the respondent that all their answers are kept confidential. Moreover, those taking part in the CPS are told when they join that they will be in the survey for four months, leave for eight months, and then rejoin for four additional months. Knowing they will have many future interactions with the government may make them more likely to tell the bureau about foreign-born individuals in the household. Repeated interviews also create a relationship with Census employees that could increase the probability that respondents will let the bureau know when a person joins the household. In contrast, ACS respondents are surveyed only once, and most participants do so on paper or online. How all the differences between CPS and ACS impact estimates of the foreign-born, especially during the ongoing border crisis, is difficult to say.30 What is clear is that the CPS provides the most up-to-date picture of the rapidly evolving immigration situation.
Figure A1. The ACS once produced higher estimates of the foreign-born than the monthly CPS, but that has generally not been the case since 2018. The monthly CPS also shows very dramatic growth between 2021 and 2022, the ACS much less so. |
 |
Sources: Data for American Community Survey comes from data.census.gov, except 2020, which is from the public-use file. |
End Notes
1 The term “immigrant” has a specific meaning in U.S. immigration law, which is all those inspected and admitted as lawful permanent residents. In this analysis, we use the term “immigrant” in the non-technical sense to mean all those who were not U.S.-citizens at birth. Table A7 in the employment situation reports the number of foreign-born residents 16 and older each month. In October 2023, it shows 46.9 million immigrants 16 and older and our analysis of the public-use data shows an additional 2.6 million immigrants under age 16, for a total foreign-born population of 49.5 million.
2 The margins of error shown in Figure 2 are based on standard errors calculated using parameter estimates and an adjustment for foreign-born respondents, which reflects the survey’s complex design. To the best of our knowledge, neither the BLS nor the Census Bureau has provided parameter estimates or an adjustment specifically for the foreign-born that applies to the general population in the monthly CPS. For this reason, we use the parameter estimates and foreign-born adjustment provided by the government for the labor force.
3 Since the monthly CPS first asked about citizenship on a regular basis in 1994, there has never been a 33-month period that witnessed this kind of growth, except if the lows reached during Covid-19 in the late summer of 2020 are compared to the spring of 2023. However, the collection of Census Bureau surveys was disrupted by the pandemic, so the foreign-born count in 2020 may not be entirely accurate, creating a 33-month period of growth that is overstated. Of course, there must have been a real fall-off in the overall size of the foreign-born population from March to the late summer of 2020. Except for this very unusual time period, the foreign-born population has not grown by more than four million in a 33-month period going back to at least 1994. The BLS reports that response rates to the CPS after March 2020 were lower than prior to Covid-19, though rates have improved since hitting a low in June 2020. These lower rates increase the sampling error of the survey. However, in June 2020, when the problem was most pronounced, BLS stated that “Although the response rate was adversely affected by pandemic-related issues, BLS was still able to obtain estimates that met our standards for accuracy and reliability.” This is in contrast to the 2020 American Community Survey, which is the other large survey collected by the Census Bureau that identifies the foreign-born. The problems with that survey were such that the bureau stated that the 2020 ACS did not meet their quality standards.
4 The ACS does give us individual year of arrival data for 2020, based on the 2021 data, and it shows 695,000 immigrants arrived in that year. See Figure 1 in a prior CIS report.
5 See prior end note for figure showing number of new arrivals each year based on the American Community Survey.
6 Assuming 5.6 million arrivals from January 2021 to October 2023, and growth of 4.5 million, then the difference of 1.1 million might be seen as the level of outmigration. But we must also take into account deaths of 790,000 over this time period among the existing immigrant population. This would imply only 300,000 immigrants left between January 2021 and October 2023. This seems implausible. Prior to Covid-19, outmigration had been estimated at several times this amount using other Census Bureau data. Even if Covid-19 and subsequent Biden administration policies caused many more people to stay in the country than otherwise would have been the case, it seems extremely unlikely that outmigration could have fallen to such a low level.
7 The total foreign-born population in the CPS is a much more statistically robust number because it is based on the larger sample of all immigrants, not the smaller share who are newcomers. One other factor to keep in mind about new arrivals is that it does not include those who came in 2021, 2022, or earlier in 2023 and left the country or passed away before October 2023. The 5.6 million represents only those who were in the country in October 2023 and came in the prior 2.75 years.
8 The average increase for Obama’s first term reflects growth in the foreign-born population between January 2009 and December 2012 of 2.76 million, divided by 47 months to reflect the changes that occurred after January 2009 when he took office. (Although each presidential term lasts 48 months, there are only 47 monthly changes in the data in a single term, unless we count the change from the December before an administration begins to January of the next year when they take office.) The average increase for Obama’s second term reflects growth in the foreign-born population between January 2013 and December 2016 of 3.56 million divided by 47 months. For Trump’s term before Covid, the average increase reflects growth in the foreign-born population between January 2017 and February 2020 (before Covid-19) of 1.57 million divided by 37 months. We chose February 2020 to reflect pre-Covid growth in the foreign-born population because Covid lockdowns did not begin until March of that year. For Biden, the average reflects growth in the foreign-born population between January 2021 and October 2023 of 4.53 million divided by 33 months. Of course, adding one additional month to each presidency would produce very similar results for each administration. So for example if we divided by 48 months for each of Obama’s terms it would show 57,000 for his first term, and 74,000 for his second, which is very similar to the 59,000 and 76,000 when we divide by 47 months for each term. If we divide Trump’s pre-Covid time in office by 38 months we get average growth per month of 41,000 compared to 42,000 if we divided by 37 months. For President Biden, if we divide by 34 months we get an average monthly increase of 133,000 rather than 137,000 if we use 33 months.
9 We define regions in the following matter: East Asia: China, Japan, Korea, Mongolia, Cambodia, Indonesia, Laos, Malaysia, Philippines, Singapore, Thailand, Vietnam, Burma, Asia NEC/NS (Not elsewhere classified or not specified); Indian Subcontinent: India, Bangladesh, Bhutan, Pakistan, Sri Lanka, Nepal; Middle East: Afghanistan, Iran, Iraq, Israel, Palestine, Jordan, Lebanon, Saudi Arabia, Syria, Turkey, Kuwait, Yemen, United Arab Emirates, Azerbaijan, Uzbekistan, Kazakhstan, Northern Africa, Egypt/United Arab Rep., Morocco, Algeria, Sudan, Libya, and Middle East NS; Sub-Saharan Africa: Ghana, Nigeria, Cameroon, Cape Verde, Liberia, Senegal, Sierra Leone, Guinea, Ivory Coast, Togo, Eritrea, Ethiopia, Kenya, Somalia, Tanzania, Uganda, Zimbabwe, South Africa (Union of), Zaire, Congo, Zambia, and Africa NS/NEC. Unless otherwise specified; Europe: Denmark, Finland, Iceland, Norway, Sweden, United Kingdom, Ireland, Belgium, France, Netherlands, Switzerland, Greece, Italy, Portugal, Azores, Spain, Austria, Czechoslovakia, Slovakia, Czech Republic, Germany, Hungary, Poland, Romania, Bulgaria, Albania, Yugoslavia, Bosnia and Herzegovina, Croatia, Macedonia, Serbia, Kosovo, Montenegro, Estonia, Latvia, Lithuania, Other USSR/Russia, Ukraine, Belarus, Moldova, USSR NS, Cyprus, Armenia, Georgia, and Europe NS; Oceania/Elsewhere: Australia, New Zealand, Pacific Islands, Fiji, Tonga, Samoa, Marshall Islands, Micronesia, Other, NEC, North America NS, Canada, Americas NS/NEC and unknown; Central America: Belize/British Honduras, Costa Rica, El Salvador, Guatemala, Honduras, Nicaragua, Panama, Central America NS.; Caribbean: Cuba, Dominican Republic, Haiti, Jamaica, Bahamas, Barbados, Dominica, Grenada, Trinidad and Tobago, Antigua and Barbuda, St. Kitts-Nevis, St. Lucia, St. Vincent and the Grenadines, and the Caribbean NS; South America: Argentina, Bolivia, Brazil, Chile, Colombia, Ecuador, Guyana/British Guiana, Peru, Uruguay, Venezuela, Paraguay, and South America NS.
10 The CPS does not include the institutionalized population, which is included in the decennial census and American Community Survey (ACS). The institutionalized are primarily those in nursing homes and prisons. We can gauge the impact of including the institutionalized when calculating the foreign-born percentage by looking at the public-use 2021 ACS, which shows that when those in institutions are excluded it lowers the foreign-born share of the population by less than one-tenth of 1 percent. This is because immigrants are in the institutionalized population but are a lower share of it than they are of the non-institutionalized. The distribution of immigrants in the institutionalized and non-institutionalized population changes very little from year to year, so the foreign-born share of the population in October 2023 might have been roughly one-tenth of 1 percent lower if the institutionalized were included. But 14.9 percent would still be a new record high. Also, the margin of error for the foreign-born share of the population is ± 0.2 percent assuming a 90 percent confidence level. So it is possible that the foreign-born share in October of this year is 14.7 percent if one assumes the lower bound of the confidence interval. This would be just below the 14.77 percent in 1890, which likely had some error that is lost to history. That said, the 15 percent foreign-born share in October of this year is still the largest share ever recorded by any U.S. government census or survey.
11 When considering the impact of immigration on the country, the foreign-born share may seem like the only factor that matters. While percentages are important, the absolute size matters as well. For example, when thinking about the successful integration of immigrants, 500,000 foreign-language speakers may be enough to create linguistic and cultural enclaves, whether this 500,000 constitutes 10 percent of an urban area or 30 percent.
12 ”Nationwide Encounters”, U.S. Customs and Border Protection.
13 Former immigration judge and Resident Fellow in Law and Policy at the Center for Immigration Studies Andrew Arthur has estimated this number based on information released by DHS to comply with a disclosure order in Texas v. Biden (Northern District of Texas, Amarillo Division, Case No. 2:21-cv-00067-Z) as well as limited information at the CBP “Custody and Transfer Statistics” web page, and ICE’s “Detention Management” web page. For a detailed discussion on the number of inadmissible aliens released into the United States based on the available information, see Andrew Arthur, “It’s No Secret — Biden’s Hiding Bad Border Numbers”, Center for Immigration Studies blog, September 1, 2023.
14 For a contrast with the current numbers, see Table 2b in the “Border Security Metrics Report: 2022”, U.S. Department of Homeland Security, July 3, 2023.
15 “Border officials count 599,000 'got-away' migrants in Fiscal Year 2022”, Fox News October 2, 2022; Press Briefing by Press Secretary Karine Jean-Pierre and Secretary of Homeland Security Alejandro Mayorkas, May 11, 2023.
16 See Figure 20 on p. 20 in the PDF document, “ICE Annual Report Fiscal Year 2022”.
17 “Fiscal Year 2022 Entry/Exit Overstay Report”, Department of Homeland Security, June 2022.
18 For additional discussion about placing the FY2022 report in context, see “DHS Reports Record Number of Overstays in 2022”, Jessica M. Vaughan, Center for Immigration Studies, June 23, 2023.
19 “Legal Immigration and Adjustment of Status Report Quarterly Data”, Office of Immigration Statistics.
20 The State Department’s Bureau of Consular Affairs website on “Monthly Immigrant Visa Issuance Statistics” shows that the number of new legal immigrants issued a visa abroad quickly returned to pre-pandemic levels and now exceeds those levels. The Refugee Processing Center’s website shows the same thing.
21 In addition to IRCA, Section 249 of the Immigration and Nationality Act (INA) allows individuals who have lived in the United States since January 1972 to apply for lawful permanent residency under what is often referred to as the “registry provision” of the law. This provision also makes it very unlikely that there are substantial numbers of pre-1980 illegal immigrants in the country.
22 The individual countries listed by The Department of Homeland Security, which covers only 80 percent of their estimates, show that 69 percent of illegal immigrants are from Latin America. See Table 2 in “Estimates of the Unauthorized Immigrant Population Residing in the United States: January 2015–January 2018”, Bryan Baker, Office of Immigration Statistics. The Center for Migration Studies estimates that slightly more than three-quarters of all illegal immigrants come from Mexico, Central America, the Caribbean, and South America. The Migration Policy Institute estimates 71 percent of illegal immigrants are from Latin American countries based on the countries for which they report separate estimates. See Table 1 in “Turning Point for the Unauthorized Immigrant Population in the United States”, Jennifer Van Hook, Julia Gelatt, and Ariel G. Ruiz Soto, MPI. Pew Research estimates that 77 percent of illegal immigrants are from Latin America.
23 While many new non-citizens from Latin America entered over this time, these new arrivals were offset by outmigration and natural mortality. In addition, large numbers of legal immigrants from this region were naturalized and thereby “left” the non-citizen population.
24 The Migration Policy Institute has figures from all of these organizations as part of its latest estimates.
25 In our commentary on the new projections, we pointed out that the level of net migration implied by a year-over-year comparison of the foreign-born in both the CPS or even the ACS, which shows less growth, still indicate that the level of net migration is much higher than the Census Bureau is using in its new population projections. Net migration of the foreign-born can be calculated simply by looking at growth in the immigrant population year-over-year and then adding in deaths. For example, the largest Census Bureau Survey is the American Community Survey (ACS), which we discuss later in this report in more detail. It shows an increase of about 900,000 between 2021 and 2022, which implies net migration of 1.2 million once mortality is taken into account. This is still much larger than the 850,000 that the bureau is assuming in its projections. The Current Population Survey Annual Social and Economic Supplement (CPS ASEC), which we also discuss later in this report, shows an increase of two million between March 2022 and March 2023, which implies net annual migration of about 2.3 million immigrants when mortality is taken into account. The CPS ASEC is similar to the monthly CPS so it is not surprising that the two surveys show similar levels of net migration. One caveat about these migration numbers: The Census Bureau concept of net international migration used in its population projections includes U.S.-born residents coming and going from the country. However, by far the biggest source of change in net migration is among the foreign-born. Typically, the net migration of U.S. natives is roughly balanced each year.
26 See Excel Table np2023-t8 entitled “Projected Population by Nativity” on the Census Bureau’s projections page for the projected size of the foreign-born and the foreign-born share of the total population under the main series projections, “2023 Population Projections for the Nation by Age, Sex, Race, Hispanic Origin and Nativity”.
27 The population estimates reflect the population in July of each year and are issued at the end of the same calendar year. Thus, the ACS weights, which also reflect the population in July of each year, basically match the population estimates for that year. However, because the monthly CPS is available almost immediately each month starting in January, it has to be weighted based on what are, in effect, preliminary population estimates that are then carried forward until the following January, when the data is then readjusted.
28 In a 2019 publication we compared the CPS Annual Social and Economic Supplement (CPS ASEC) to the ACS. The CPS ASEC, or simply ASEC, includes the March CPS and an oversample of minorities. It also asks many additional questions and is the source for poverty rates and health insurance coverage. Unfortunately, like the ACS, the ASEC is available only once a year, about half a year after it is collected. Like the monthly CPS, the ASEC consistently produced lower foreign-born estimates than the ACS until 2018. Since then it has generally produced higher estimates, even though, like the monthly CPS, it does not include the institutionalized and so should produce slightly lower estimates than the ACS. The ASEC should also show a slightly lower foreign-born population because it reflects the population in March of each year, not July like the ACS. Although we outline some of the most important methodological differences between the ASEC and the ACS in our 2019 discussion, then as now we are not able to explain why the ACS stopped producing larger estimates of immigrants relative to the ASEC or the monthly CPS.
29 One of the reasons the 2022 ACS shows a seemingly low number of total foreign-born is that the public-use ACS shows only 1.46 million arrivals for all of 2021, which appears too low given all that has been happening.
30 Most of the differences between the two surveys have existed since 2006, when the ACS was fully implemented. This makes it less likely that they explain why the ACS no longer shows a larger foreign-born.