Download a pdf of this Backgrounder
Steven A. Camarota is the Director of Research at the Center for Immigration Studies. These projections were developed by Decision Demographics in consultation with the Center for Immigration Studies. The Center would like to thank Stephen Tordella, Thomas Godfrey, and Nancy Wemmerus of Decision Demographics for their contributions.
Using data provided by the U.S. Census Bureau, this study first recreates the Bureau's most recent population projections. We then vary the level of net immigration (the difference between those coming and those leaving) to discern its impact on the U.S. population. The findings show that immigration makes for a much larger overall population, while having only a small effect on slowing the aging of American society.
Among the findings:
- If immigration continues as the Census Bureau expects, the nation's population will increase from 309 million in 2010 to 436 million in 2050 — a 127 million (41 percent) increase.
- The projected increase of 127 million is larger than the combined populations of Great Britain and France. It also exceeds the entire U.S. population in 1930.
- The Census Bureau assumes net immigration (legal and illegal) by 2050 will total 68 million. These future immigrants plus their descendants will add 96 million residents to the U.S. population, accounting for three-fourths of future population growth.
- Even if immigration is half what the Census Bureau expects, the population will still grow 79 million by 2050, with immigration accounting for 61 percent of population growth.
- Without any immigration, the U.S. population will increase by 31 million by 2050.
- Though projections past 2050 are much more speculative, if the level of immigration the Census Bureau foresees in 2050 were to continue after that date, the U.S. population would reach 618 million by 2100 — double the 2010 population.
- The immigrant (legal and illegal) share of the population will reach one in six U.S. residents by 2030, a new record, and nearly one in five residents by 2050.
- The above projections follow the Census Bureau's assumptions about future levels of immigration, as well as death and birth rates, including a decline in the birth rate for Hispanics.
- Consistent with prior research, the projections show immigration only slightly increases the working-age (18 to 65) share of the population. Assuming the Census Bureau's immigration level, 58 percent of the population will be of working-age in 2050, compared to 57 percent if there is no immigration.
- Raising the retirement age by one year would have a larger positive impact on the working-age share over the next 40 years than would the Census Bureau's total projected level of net immigration (68 million).
- While immigrants do tend to arrive relatively young and have higher fertility than natives, immigrants age just like everyone else, and the differences with natives are not large enough to fundamentally increase the share of the population who are potential workers.
- The Center for Immigration Studies, as well as other researchers, has reported that immigration levels have fallen somewhat in recent years. While there is no way to know if the level will remain lower, this change can be incorporated into these projections.
- Assuming immigration is one-third below what the Census Bureau's expects for 10 years (2010-2020) produces a total U.S. population of 428 million in 2050 — a 118 million increase over 2010. By itself immigration would account for 87 million additional U.S. residents under this scenario.
- A one-third reduction in the Census Bureau's level of immigration over the entirety of the next four decades (2010-2050) produces a total U.S. population of 404 million in 2050 — a 95 million increase over 2010. By itself immigration would account for 64 million additional U.S. residents under this scenario.
- Assuming immigration is one-third below what the Census Bureau's expects for 10 years (2010-2020) produces a total U.S. population of 428 million in 2050 — a 118 million increase over 2010. By itself immigration would account for 87 million additional U.S. residents under this scenario.
- Because the underlying level of immigration is so high, even a one-third reduction in what the Bureau expects over the next four decades would still add tens of millions of new residents to the U.S. population and account for most of the population growth.
- The importance of immigration to population growth can be seen by projecting the impact of reduced fertility. If the fertility of natives were to fall 20 percent more than the Census expects by 2030, but immigration continued at the pace the Bureau expects, the U.S. population would still grow to 409 million by 2050 — a 99 million increase over 2010.
- Immigration is a discretionary policy of the government and can be changed. The fundamental question for the American public and policy makers is whether a much larger population and the resulting greater population density will add to or diminish the quality of life in the United States.
Introduction
While it has not been at the center of the nation's immigration debate, increasing the nation's total population is one of immigration's clearest and most direct effects. Supporters of low immigration point to the congestion, pollution, loss of open spaces, and restrictions on personal freedom that could result from adding large numbers to the U.S. population. Supporters of high immigration argue that population growth may create more opportunities for businesses, workers, and consumers. Based on data provided by the Census Bureau, the projections in this report show that the U.S. population will grow by nearly 127 million between 2010 and 2050. Immigrants who will arrive over the next four decades plus their descendants will account for about 96 million of this increase. The 96 million increase in new residents caused by immigration is larger than the combined populations of 33 U.S. states. It is also more than all of the population growth that occurred in the first 120 years of American history, 1790 to 1910.
The Methodology Appendix at the end of this report explains in detail how the projections were created. In sum, we first replicated the official 2008 Census Bureau projections by race/ethnicity. This was possible because the Census Bureau Projections Branch was kind enough to share with us unpublished data that it used to generate its last major series of projections. Throughout this report we refer to the "Census Bureau immigration level" or "Census immigration" to mean the level of net immigration the Bureau used in its 2008 projections, which were the Bureau's last full set of projections.1 Net immigration is the difference between the number coming versus the number leaving the country. In total, the Bureau's net immigration projection is 68.3 million for the period 2010 to 2050.
With the information provided by the Census Bureau, we were able to match the Bureau's projections. We were also able to vary the Bureau's assumptions to estimate the impact of immigration, as well as other factors, on future population size and composition. One distinguishing feature of these projections is that we track the size of the immigrant or foreign-born (used synonymously in this report) population separately from the native-born population. This allows us to report the size of the immigrant population under different immigration scenarios. Most prior projections by the Census Bureau, as well as other researchers, have not done this.2 Most important, immigrants and natives have different fertility rates, so tracking them separately is critical if we are to accurately project the population under different immigration scenarios.
Like all prior projections, this report indicates that immigration makes for a much larger U.S. population. The question for the public and policy makers is not whether immigration is the key determinant of population increase — it is. There is also no question that immigration has only a small impact on slowing the decline in the share of the population that is of working-age. The key question for the country is: What are the costs and benefits that come from having a much larger population?
Immigration's Impact on Population Growth
Census Bureau-Based Projections. Figure 1 reports the size of the U.S. population through 2050 under different immigration scenarios using the Census Bureau's level of net immigration as a baseline. Fertility and mortality assumptions follow the Census Bureau's projection; only immigration is varied. Figure 1 shows the enormous impact that immigration will have on population growth in the United States over the next four decades.
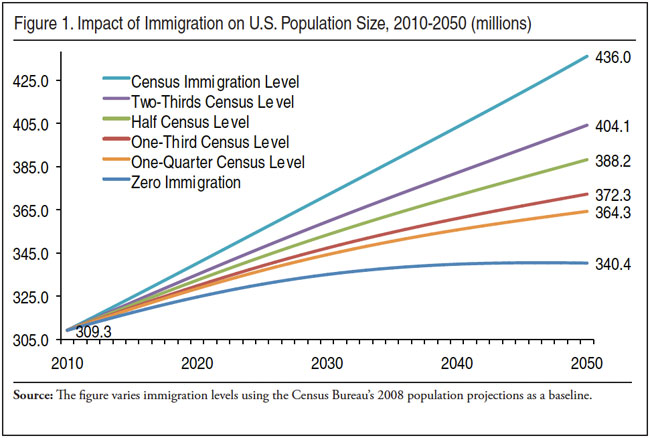
The top line in Figure 1 shows that if immigration unfolds as the Census Bureau expects, the nation's population will increase from 309.3 million in 2010 to 436.0 million in 2050 — a 126.7 million (41 percent) increase in just four decades. The figure also shows that if there is no net immigration (bottom line), the U.S. population would still grow to 340.4 million, a 31.1 million increase over 2010. The difference between 126.7 million and 31.1 million is 95.6 million, which is the impact of future immigration by itself on population growth. This means that immigrants who will arrive in the coming decades will account for about three-fourths of future population increase.
The alterative immigration scenarios in Figure 1 also show that even if there was a substantial reduction in the level of immigration from what the Census Bureau expects, there would still be significant population growth. For example, if net immigration was two-thirds of what the Census Bureau expects, the total U.S. population would still reach 404.1 by 2050 — a 94.8 million increase over 2010. Even if immigration is half what the Census Bureau expects, the population will still grow 78.9 million by 2050, with immigration accounting for 61 percent of population growth.
It would take a more significant reduction in immigration to really slow U.S. population growth. If immigration was reduced to only one-third of what the Census Bureau expects, Figure 1 shows that the total U.S. population would reach 372.3 million in 2050 — a 63.0 million increase over 2010. This is about half of the 126.7 million increase the Census Bureau projects. Thus, reducing immigration to one-third of what the Bureau anticipates would cut population growth in half by 2050. Still, even with this significant reduction in immigration, the total population would increase by almost 63 million and immigration by itself would add some 32 million new residents to the country by 2050. The next to bottom line shows that if net immigration was reduced to 25 percent of what the Census expects, the total population in 2050 would be 364.3 million. This is still a significant increase over 2010. Even under this scenario where immigration is reduced by three-fourths, it would still account for about 43 percent of future population growth.
Immigration Levels. The top portion of Table 1 reports more immigration scenarios than Figure 1, including projections that assume immigration levels above what the Census Bureau expects. Again, fertility and mortality assumptions follow the Census Bureau's projection, only immigration is varied. The middle portion of the table reports the net annual level of immigration under each scenario. The bottom of Table 1 reports the cumulative level of immigration from 2010 to 2050. The table shows that the Census Bureau projects net immigration of 1.34 million in 2010 and then assumes that level grows over time to 1.47 million by 2020, 1.66 million by 2030, 1.86 million by 2040, and to just over two million by 2050. Immigration levels have generally increased over the last half-century so the Bureau's assumption that this will continue is reasonable. However, it is only an educated guess about future levels of immigration based on past patterns. The level of immigration is dependent on many factors including conditions in the United States, conditions in sending countries, and U.S. immigration policies, including the level of resources devoted to controlling illegal immigration.

The bottom of Table 1 reports the cumulative level of immigration for each immigration scenario. The Census Bureau assumes cumulative net immigration will total 68.3 million immigrants between 2010 and 2050, an amount equal to eight New York Cities. It is important to note this is net immigration, not the number of new arrivals. More than 68.3 million new immigrants (legal and illegal) will arrive, but new arrivals will be offset by out-migration.
There is no way to know for certain what the level of immigration will be in the future. Table 1 provides a number of different immigration scenarios, including what would happen if immigration exceeds the level assumed by the Census Bureau. Table A1 in Appendix A reports projections out to the year 2100 assuming different shares of the Census Bureau's immigration level. Table A2 reports projections in 10 percent increments starting with 10 percent of the Census level and running to 250 percent of the Census level. Table A3 projects the size of the U.S. population assuming a constant level of net immigration in 100,000 increments annually to 2.5 million annually. Tables A1 to A3 provide a wide variety of possible immigration scenarios and their impact on population growth.
Foreign-Born Share. One of the innovations of this analysis is that we project the size of the native and foreign-born populations separately. Figure 2 projects the foreign-born (legal and illegal) share of the U.S. population 2010 to 2050 under different immigration scenarios using Census Bureau projections as the baseline. The figure also reports the foreign-born share 1970 to 2010. Figure 2 shows that if immigration unfolds as the Census Bureau expects, the nation's foreign-born share of the population will increase from 12.9 percent in 2010 to 19.3 percent by 2050.

While the number of immigrants in the country is already higher than at any time in U.S. history, the immigrant share was higher around the turn of the 20th Century, with a peak of 14.8 percent in 1890 and 14.7 percent in 1910. Projecting the immigrant population forward shows that their share will surpass this level in the next decade. Figure 2 shows that if immigration unfolds as the Census Bureau expects, the foreign-born share of the population will reach 15 percent in 2021, higher than at any time in American history.
Figure 2 also shows that if immigration is three-fourths of the Census level the foreign-born share will still reach a new record high of 15 percent in 2030. If immigration was reduced to two-thirds of what the Census Bureau expects, the immigrant share will reach the record level of 15 percent in 2038. These projections indicate that even assuming significantly lower levels of net immigration, the foreign-born share of the population will continue to grow for decades.
Table 2 reports the percentages used for Figure 2 by decade, as well as the number of the foreign-born through 2050. The table shows the size of the foreign-born population will continue to grow throughout the first half of this century assuming the Census's Bureau's level of immigration or even a significant reduction in the level. Figure 2 and Table 2 indicate that the number and share of the population that is immigrant will not stabilize before 2050 under the Census Bureau's baseline projections or anything close to that level.3 Absent a really significant change in immigration policy, immigration's impact will continue to grow as the size of foreign-born population continues to grow.

Illegal Immigrants. So far in this analysis we have treated legal and illegal immigration together. The Census Bureau concept of net immigration assumes both a legal and illegal component of new arrivals and departures. There are an estimated 11 to 12 million illegal immigrants in the country. Roughly 90 percent of them are included in the population estimates and 2010 Census figures that are the basis for this analysis.4 What to do about illegal immigrants already in the country is one of the most vexing political and policy issues facing the United States. The projections discussed so far assume that illegal immigrants remain in the country.
A significant out-migration of illegal immigrants can be incorporated into the population projections. In the discussion that follows, we assume that some share of the illegal immigrants in the United States will leave the country in the next five years. We also assume that the U.S.-born children of illegal immigrants will remain in the country. Since it is impossible for all of the illegal immigrants to leave at once, these projections assume that the reduction in the existing stock of illegal immigrants would take place over a five-year period. The five-year time period for the departure of illegal immigrants is not used because it reflects a specific policy prescription. Rather, it is simply used as a point of reference in order to gain insight into what would happen if there was a significant reduction in the number of illegal immigrants.
Figure 3 reports different scenarios dealing with the departure of illegal immigrants and different levels of future immigration.5 The top line is provided for comparison and shows the size of the U.S. population assuming the Census Bureau level of immigration through 2050 and that the entire illegal immigrant population remains. The second line assumes the Bureau's level of immigration, but that half of illegal immigrants leave within five years. The third line also reflects the Census Bureau's immigration level, but it reports what would happen if all illegal immigrants left within five years. By comparing the third line to the first we can see the effect of allowing the roughly 11 million illegal immigrants in the country to stay. If illegal immigrants are allowed to remain in the country, the nation's population will be 15.4 million larger in 2050 than it otherwise would be, assuming the same level of immigration. It should be remembered that these projections assume that all of the U.S.-born children of illegal immigrants will remain in the country, even though in reality some fraction of minor children would almost certainly leave with their parent. This means that Figure 3 likely understates the long-term impact of allowing illegal immigrants to stay on future population size.
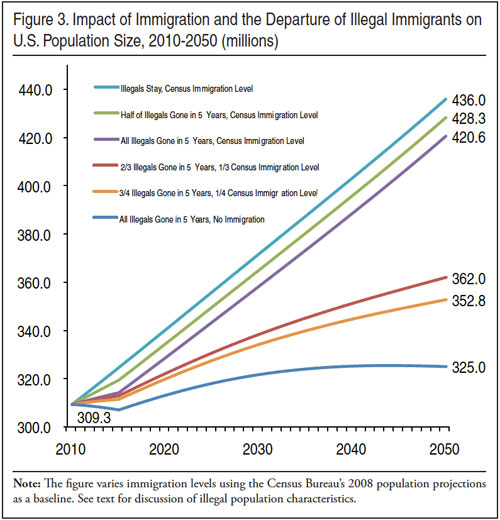
The lower portion of Figure 3 reduces future levels of immigration in addition to reducing the illegal immigrant population. The fourth line assumes two-thirds of illegal immigrants return home within five years and that immigration is reduced to one-third of the level projected by the Census Bureau. The fifth line from the top reports population size assuming that three-fourths of illegals leave within five years and immigration is one-fourth the Census Bureau level. For those who wish to stabilize the U.S. population, the fourth and fifth lines from the top might be seen as the best outcome that is realistic.
The fourth and fifth lines represent both a significant reduction in the illegal immigrant population and the level of future immigration (legal and illegal). Even with these reductions, Figure 3 still shows that the U.S. population would increase by 44 to 53 million. Nonetheless this is still 74 to 83 million less than the top line in the figure, which assumes illegal immigrants stay and future immigration is what the Census Bureau expects. Table A4 in Appendix A reports several additional scenarios for reductions in the illegal immigrant population and reduced future immigration levels.
Immigration and Aging
A number of commentators over the years have argued that immigration is the fix for an aging society. One has even called it a "magic elixir" that can counter the graying of America. Ben Wattenberg of the American Enterprise Institute is a prominent thinker espousing this point. But he is by no means alone. Washington Post columnist Charles Krauthammer has said that America has been "saved by immigrants" from the kind of aging taking place in other first-world countries.6 Those who make this argument worry that there will not be enough workers to support the economy or government. Adding young immigrants, it is argued, will largely solve this problem.
However, most actual demographers have long known that immigration levels that are practical have only a small impact on slowing the aging of a society with low fertility. In an important article 20 years ago in Demography, the nation's top demographic academic journal, Carl P. Schmertmann laid out the mathematical reasons why immigration to a society with declining fertility can have only a small impact on slowing aging. He explains that while immigration can stop population decline, it simply cannot have a large impact on slowing aging. It fact, Schmertmann points out that constant inflows of immigrants to a low fertility country may even contribute to population aging.7 As the Census Bureau itself stated in the discussion that accompanied its projections in 2000, immigration is a "highly inefficient" means of reducing the ratio of workers to those not of working-age in the long run.8 Prior research makes clear that immigration has a positive but small impact on slowing aging in a society with relatively low fertility like the United States.
Working-Age Population. The aging of society can be measured in a number of different ways. The most common is the "dependence ratio". Demographers use this term to refer to the ratio of those of working-age relative to those who are too old or too young to work. In the discussion that follows we report this ratio as the percentage of the U.S. population that is of working-age because a percentage is easier to understand for most non-demographers. We define working-age several different ways. Figure 4 defines working-age as 18 to 65 and reports their share of the nation's total population under different immigration scenarios. Figure 4 makes clear what other research has shown: Immigration has a positive but small impact on the share of the population that is of working-age.

In 2010, 63.8 percent of the population was ages 18 to 65. If there was no immigration the working-age share will be 56.9 percent in 2050 — a 7.0 percentage-point decline. If immigration unfolds as the Census Bureau expects over the next four decades, then 57.7 percent of the population will be adults of working-age — a 6.1 percentage-point decline. Thus net immigration of 68.3 million immigrants (the Census Bureau's level) offsets only 0.9 percentage points of the decline in the working-age share of the population.9 Put a different way, net immigration of more than 68 million in the next 40 years will offset just 13 percent of the 7.0 percentage-point decline that would otherwise have occurred when working-age is defined as 18 to 65.
The 18 to 65 population comprises 95 percent of all workers, so examining their share of the population provides a good picture of the share of the population who are potential workers.10 However, there are workers outside of this age group. Some researchers include 16- and 17-year-olds as part of the working-age, though the share of these individuals working has declined significantly over the last two decades.11
Figure 5 uses the 16- to 65-year-old population as the working-age. Figure 5 shows the share of the population who are in this age group under different levels of immigration. Like Figure 4, Figure 5 shows a significant decline in the working-age population regardless of the level of immigration. Without immigration, the working-age (16 to 65) share will decline from 66.6 percent of the population in 2010 to 59.2 percent by 2050 — a 7.4 percentage-point change. If the Census Bureau's level of immigration occurs, the working-age (16 to 65) population will decline to 60.3 percent — a 6.3 percentage-point change from 2010. The difference between 60.3 and 59.2 is 1.1 percentage points, which represents the improvement that comes from immigration. The 1.1 percentage-point improvement means that immigration offsets about 15 percent of the decline in the working-age share of the population that will occur without immigration if we include 16- and 17-year-olds as part of the working-age population. This is very similar to the 13 percent improvement that immigration creates when you use 18 to 65 as the working-age.

Whether we use 16- or 18-year-olds as the bottom end of the working-age, the impact of immigration on slowing the decline in the working-age share can only be described as small. Or put a different way, the overwhelming majority of the decline in the working-age would still occur even assuming net immigration of 68 million over the next four decades.
People at the ends of the working-age distributions tend to work less. Figure 6 reports the share of the population 25 to 54 years of age under different immigration scenarios. Income often peaks for workers in this age group and they can be seen as the most productive part of the population. If we use 25- to 54-year-olds as the target population the results are very similar to Figures 4 and 5. Immigration would offset one percentage point or 18 percent of the decline in the 25- to 54-year-old population. This is larger than the impact when 16 or 18 is used as the bottom of the age range. Nonetheless, Figure 6 still indicates that the vast majority of the decline would occur assuming the Census Bureau's projected immigration level.

Taken together, Figures 4, 5, and 6 make clear that immigration has as a positive but small impact on slowing the decline in the percentage of the population who are potential workers no matter how we define this population. If we wish to reduce immigration, we can do so secure in the knowledge that it will have almost no impact on the share of the population that is of working-age in the future.
It is worth noting that the discussion above may overstate the impact of immigration because we compare zero immigration to the Census level. It seems very unlikely that net immigration would fall to zero. If we use one-third of the Census level, which is more realistic, as a point of comparison, and compare that to the Census Bureau's level of immigration, we see the impact on the share of the working-age population is even smaller. So, for example, Figure 4 shows that if immigration was one-third the level of what the Census Bureau expects, the working-age share (18 to 65), would be 57.2 percent of the population compared to 57.7 percent under the Census Bureau's level.
Instead of examining the percentage of the population that is of working-age, it is also possible to measure the number of working-age people relative to the number of likely retirees. However, such comparisons also show that immigration has a small impact on slowing the aging of society. For example, at present there are 4.81 working-age (18 to 64) people for every person over age 65. If immigration is zero it will decline to 2.38 potential workers to likely retirees by 2050 — a 2.43 decline. But if immigration unfolds as the Census Bureau expects, there will be 2.81 workers — a 2.0 decline. This means that immigration offsets .43 of the decline in workers to retirees (18 percent) that would other otherwise have occurred, which is very similar to its impact on the working-age share reported in Figures 4, 5, and 6.
It may be worth remembering that one reason immigration has such a small impact on aging is it not only makes the working-age population larger, it also increases the number of retirees in the long run. So, for example, the 65 and older population would be 8.2 million larger in 2050 using the Census level of immigration compared to zero immigration. Immigration simply cannot have a large impact on slowing the aging of society, particularly the share who are of working-age.
Raising the Retirement Age. Putting aside the issue of immigration, Figures 4 through 6 make clear that the share of the population who are potential workers is going to decline significantly in the coming decades. As is well known, this decline primarily reflects Baby Boomers reaching retirement age coupled with the decline in fertility from the late 1960s onward. While immigration has little impact on this problem, concern about this issue is not misplaced.
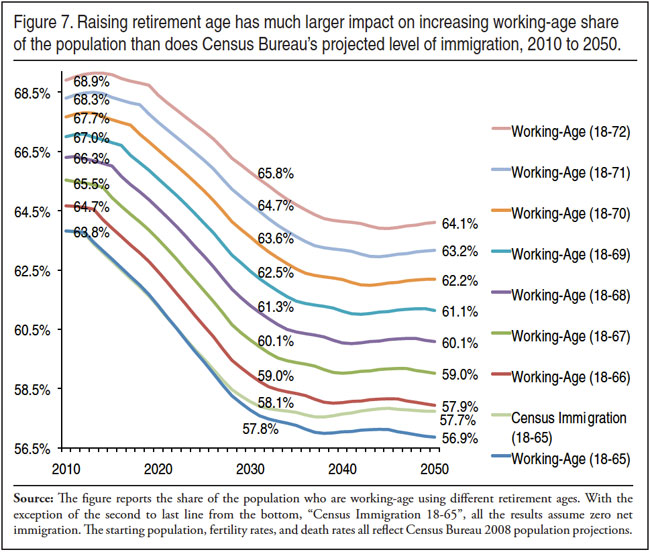
Figure 8 reports the working-age share of the population using different ages for the top end of the working-age distribution, with 18 as the bottom of the age distribution. All the results in the figure assume no immigration between 2010 and 2050. The bottom line in Figure 8 shows the working-age share if retirement is age 65, the next line up assumes retirement at age 66, the next line assumes retirement at age 67 and so on up to age 72. Figure 8 indicates that each one-year increase in the retirement age improves the working-age share of the population by roughly one percentage point, whether we look at 2050 or 2030. This one percentage point improvement exists up to an increase in retirement to age 72.

As will be recalled from Figure 4, the Census Bureau's projected level of net immigration — 68.3 million from 2010 to 2050 — improved the retirement age by about one percentage point, with the working-age defined as 18 to 65. This means that four decades of immigration has about the same effect as increasing the retirement age by just one year. This suggests that raising the retirement age is a much more effective means of dealing with the decline in the working-age share of the population than is immigration. However, it must be pointed out that immigration will tend to slightly increase the number of potential workers across the age distribution, while increasing the retirement age by one year can only increase the number of workers at the top end of the age distribution.
Figure 8 demonstrates in clear terms how the Census Bureau's level of immigration compares to raising the retirement age. The figure shows the working-age share of the population with zero immigration and a retirement age of 66, compared to the Census Bureau level of immigration with a retirement age of 65. Figure 8 demonstrates that raising the retirement age one year has a slightly more positive impact on the working-age share of the population then does the roughly 68 million immigrants the Census Bureau expects over the next four decades.
It is perhaps worth noting that if we doubled immigration from what the Census Bureau projects, it would still only give the country a working-age share (18 to 65) that is 58.3 percent, still not much different than the 56.9 percent with no immigration. Thus net immigration of nearly 140 million over four decades is equal to about a two-year increase in the retirement age.
The bottom line from this analysis is that for those concerned about the decline in the working-age share of the population, increasing the retirement age would seem to be a more effective way of dealing with this problem. This confirms Schmertmann's analysis of 20 years ago that immigration cannot significant change the share of society that is of working-age in societies with relatively low fertility, such as our own.
The Impact of Fertility
While there is no question that immigration has an impact on the future size of the U.S. population, fertility and mortality matter as well. In our view, it does not make sense to vary the Census Bureau's mortality assumptions because barring an unforeseeable national calamity or the introduction of some unforeseeable life-extending technology that dramatically reduces mortality, there is every reason to think that age-specific death rates will continue to decline slowly in the way the Census Bureau assumes. While mortality has fallen steadily and relatively predictably over the last half century, fertility has varied significantly. Moreover, while mortality does not vary widely among developed countries, fertility does vary. Therefore in the following section we vary fertility and immigration to discern their relative importance, but we leave the Census Bureau's mortality assumptions unchanged.
The Impact of Lower Fertility. Figure 9 reports the size of the U.S. population assuming different levels of fertility. Except for the bottom two lines in the figure, all projections assume the Census Bureau's projected level of immigration. For comparison, the first line in Figure 9 simply reports population size for 2010 to 2050 using the Census Bureau levels of both immigration and fertility. Because fertility is very unlikely to drop dramatically and immediately, the different low-fertility scenarios reported in the figure use 2030 as the target date for a change. The first low-fertility projection assumes fertility will be 10 percent lower than the Bureau's assumption by 2030 for only the native-born population. The second low-fertility projection assumes that both native and immigrant fertility will be 10 percent lower by 2030. Both projections assume that fertility will remain 10 percent below what the Census Bureau assumes through 2050.
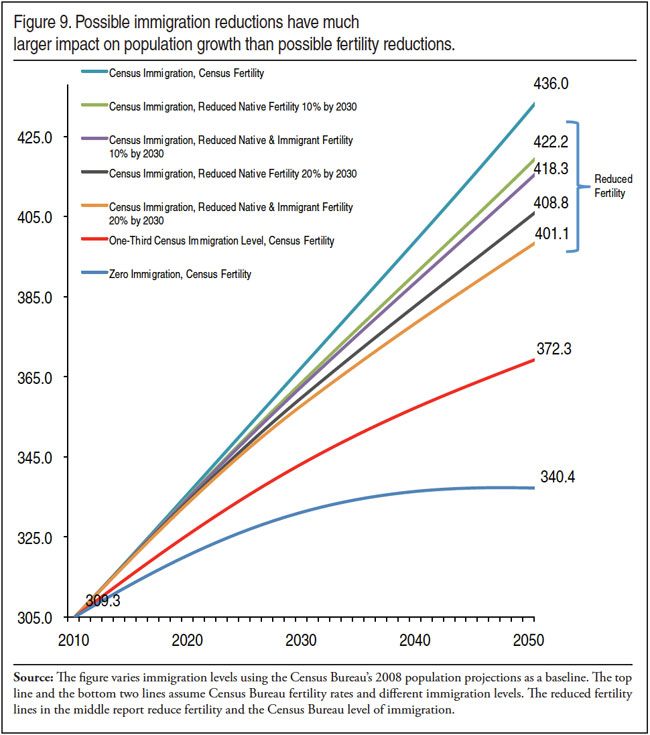
The third low-fertility projection assumes that fertility will be 20 percent lower by 2030 for natives alone and the fourth low-fertility projection assumes it will be 20 percent lower for both natives and immigrants. Like the projections that assume a 10-percent reduction in fertility, the 20-percent reduction scenarios both assume that fertility will remain at this lower level after 2030. Figure 9 shows that fertility can play a meaningful role in population growth. But even with fertility 20 percent below the decline the Census Bureau already foresees, the U.S. population would still reach 401 million in 2050 if immigration unfolds as the Bureau anticipates. This would represent a 91.8 million increase over 2010.
A 20 percent reduction in fertility for both the native- and foreign-born by 2030 is quite substantial. It means for example that every major racial and ethnic group in the United States would have fertility rates lower than at any time in American history, even a good deal lower than during the so called "baby bust" of the 1970s.12
What's more, under the 20 percent reduction scenario (native and immigrant) there would be 35.1 million fewer births over the next 40 years than would be anticipated using the Census Bureau's fertility assumptions. But even assuming much lower levels of fertility, the population will still increase by nearly 92 million due to immigration. If we wish to stabilize the U.S. population, fertility can play some role in reaching this goal. But relative to the level of immigration the Census Bureau expects in the coming decades, lower fertility can only have a modest impact.
Projections to 2100
The most recent Census Bureau projections, which are the basis for this analysis, only go to 2050. It is possible to project out the size of the U.S. population after that date, however. Figure 10 projects the size of the U.S. population to 2100. (Tables A1, A2, and A3 in the Appendix have additional immigration scenarios out to 2100.) To create this long-term projection we assume that the levels of immigration, fertility, and mortality foreseen by the Census Bureau in 2050 continue to 2100. While we have confidence that our projections accurately reflect these assumptions, it must be emphasized that the Census Bureau did not project out to 2100 in its 2008 projections. Nonetheless, long-term projections can provide some insight into the size of the U.S. population if immigration continues.

If the level of immigration the Census Bureau foresees in 2050 were to continue after that date, then the U.S. population would hit 506 million by 2070 and slightly more than 617 million by 2100. This means that the U.S. population would double during this century from slightly more than 309 million in 2010 to more than 600 million by 2100. January 2000 was the last time the Census Bureau did a very long-term projection of this kind. Those projections show a U.S. population in 2100 of 571 million using their middle-range migration assumption and 854.3 million using their high-migration assumption.13 Our projection of 618 million falls between those two values because the net migration level used by the Census Bureau in its newer projections, which are the basis of our projections, falls between the high and middle migration assumptions used by the Bureau's projections done in 2000.
An important finding in Figure 10 is that even if immigration was half the level forecast by the Census Bureau, the U.S. population would still grow to 469 million, an increase of nearly 160 million since 2010. If immigration was reduced to only one-fourth of what the Bureau expects, the population in 2100 would still be nearly 395 million, an increase of 85 million over 2010. Figure 10 indicates it would take a very substantial reduction in immigration to stabilize the size of the U.S. population by 2100. In fact, immigration at almost any level will cause the country to be a good deal larger by 2100 than it would be in the absence of immigration.
Recent Trends
Immigration levels can and do change over time. While the long-term trend since the end of World War II has been a steady increase, there is good evidence that the level has fallen in recent years, though the overall level remains high.14 It seems that the decline in immigration in recent years has been primarily among illegal immigrants. Demographically this means that it is Hispanic immigration that has declined because the Department of Homeland Security and others have estimated that at least three-fourths of illegal immigrants are Hispanic.15 It is unclear whether this trend will continue. It is possible immigration will stabilize at a lower level. It is also possible that it will resume its long-term upward trend.
It seems likely that, as the economy recovers, so will immigration levels. The high standard of living in the United States means that it remains an attractive option for migration, particularly for people in less-developed countries. There is also a significant body of research showing that immigration is in part driven by social networks of prior immigrants in the receiving country.16 As the size of an immigrant community grows in the host country, previously arrived immigrants draw in family and friends. With 40 million foreign-born residents residing in the United States, the social networks are now large and well established. Moreover, U.S. legal immigration policy remains very generous, issuing more than a million new green cards (permanent residency) in every year since the Great Recession began at the end of 2007.
The Current Population Survey (CPS), collected by the Census Bureau in March 2012 shows that 2.3 million new immigrants (legal and illegal) arrived in the United States in 2010, 2011, and the first two months of 2012. This is about 22 percent below the number of new arrivals in the two years prior to 2006, based on the same survey, when immigration was a good deal higher. It is also about 32 percent below the number of new arrivals shown by the same survey in March 2002, the peak of immigration in the last two decades. These figures are unadjusted for undercount, so the actual level of new arrivals is almost certainly higher. On the other hand, these figures are for those coming to the United States — not net immigration. Estimating out-migration is more difficult than estimating the number of new arrivals. But the drop in new arrivals provides an idea about how much immigration may have fallen in recent years.
The decline seems to be entirely among Hispanics. Of new arrivals in 2002, 47 percent were Hispanic as were 53 percent in 2006; this compares to 27 percent in 2012. The Census Bureau assumes in its projections that immigration will be roughly 50 percent Hispanic for the next three decades. To be sure, it is very early to say for sure what is happening in immigration trends. It is also unknown whether the current trend will continue. Nonetheless, it is possible to incorporate changes into the projection model used in this report. Doing so may provide some insight into the possible impact of such changes on population size.
Figure 11 shows several different immigration scenarios that attempt to provide some insight into what the change in immigration trends could mean for the growth of the U.S. population. The figure shows the long-term impact if immigration is reduced by one-fourth or one-third for 10 years 2010 to 2020, after which the level reverts to that foreseen by the Census Bureau.
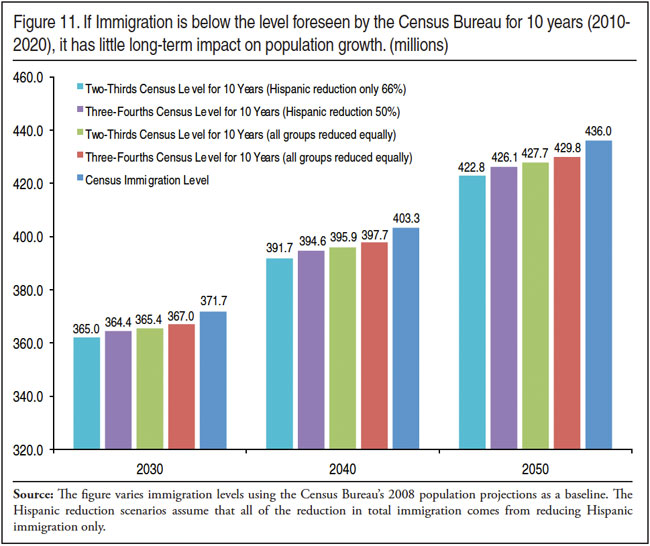
The first set of projections shows immigration at two-thirds and three-fourths of the Census Bureau level for 10 years, but assumes that all of the reduction is among Hispanics. These projections assume that after 10 years the level of immigration reverts to that foreseen by the Census Bureau. As discussed above, the latest data indicate that most of the falloff in immigration has been among Hispanics. Hispanics have the highest fertility among major racial/ethnic groups, so their impact on population growth tends to be somewhat larger. However, Figure 11 shows that a 10-year reduction in Hispanic immigration still has only a modest impact on total population size in 2030 or 2050.
The next set of bars assumes immigration will be two-thirds and three-fourths the Census Bureau's level of immigration for the 10-year period 2010-2020. In these two projections, the arrivals of all immigrant groups are reduced equally. The final bar shows population size assuming the Census Bureau level of immigration, which has been reported throughout this report. All four 10-year reduction scenarios in the figure produce a total population in 2050 that is within 13 million of the Census Bureau level of immigration, whether the reduction in immigration is only among Hispanics or evenly distributed across all groups.
Figure 12 shows another set of scenarios that are similar to those in Figure 11, except that the reductions in the Census level of immigration continues through 2050, rather than stopping at 10 years. The first line again reports population size based on the Census Bureau's level of immigration. The next two show immigration at three-quarters and two-thirds of the Bureau's level of immigration. (These same figures can also be found in Figure 1 and Table 1.) The next pair of lines also report immigration at three-fourths and two-thirds of the Census Bureau level, but with all of the reduction coming from lower Hispanic immigration.

Figure 12 shows that assuming all of the reduction is in Hispanic immigration does have a somewhat larger long-term impact on population size than simply assuming a reduction in immigration across the board. Nevertheless, the difference is not very large. The same is true assuming immigration at two-thirds the Census level. The 2050 population is similar whether or not the reduction is just among Hispanics. These projections demonstrate that it is really the overall level of immigration that drives population increase, not the Hispanic share.
Even assuming the recent falloff in immigration continues the U.S. population will continue to increase significantly in size. This is particularly the case if the level of immigration is lower than the Census Bureau expects for only a decade. Figures 11 and 12 also make clear that the share that is Hispanic makes little difference. Although Hispanics have significantly higher fertility than other groups, especially in the first generation, the long-term impact of Hispanic immigration on population growth is very similar to non-Hispanic immigration.
Conclusion
The projections in this report are based on the immigration, fertility, and mortality assumptions of the U.S. Census Bureau. The Census Bureau projects that net immigration from 2010 to 2050 will total 68.3 million. Consistent with all prior research on this topic, the findings show that future immigration levels have a very large impact on population growth. Also consistent with all prior research, we find that immigration has a positive, but small effect on slowing the aging of American society.
The projections show that if immigration unfolds as the Census Bureau expects, the U.S. population will reach nearly 372 million by 2030 and 436 million by 2050, a 127 million increase over 2010. The projected increase from 2010 to 2050 is equal to the combined current populations of California, Texas, New York State, Florida, Illinois, and Pennsylvania. Immigration by itself will add 96 million new residents to the United States over this time period, accounting for three-fourths of population increase. While immigration is the primary driver of population growth, even without immigration, the population will increase by 31 million by 2050. Even if immigration is half what the Census Bureau expects, the population will still grow 78.9 million by 2050, with immigration accounting for 61 percent of population growth.
Although immigration makes for a much larger population, consistent with prior research, including work done by the Census Bureau, these projections show immigration has only a small impact on increasing the share of the population that is of working-age. Assuming the Bureau's projected immigration level, 58 percent of the U.S. population will be working-age adults (18 to 65) in 2050 compared to 57 percent if there is no immigration. While immigrants do tend to arrive relatively young and have somewhat higher fertility than natives, immigrants age just like everyone else and the differences with natives are not large enough to fundamentally increase the share of the population made up of potential workers.
Raising the retirement age is a much more effective way of increasing the share of the population who are potential workers. Raising the retirement age by one year has about the same impact on the share of the population who will be of working-age in the long-run as the Census Bureau level of net immigration over the same time period.
The Center for Immigration Studies, as well as other researchers, has reported that immigration levels have fallen somewhat in recent years. While there is no way to know if the level will remain lower, this change can be incorporated into these projections. Assuming immigration is 25 percent below the Census Bureau's level of immigration for 10 years (2010-2020) produces a total U.S. population of 430 million in 2050 — a 120 million increase over 2010. By itself immigration would account for 89 million additional U.S. residents under this scenario. A 25 percent reduction in the Census Bureau's level of immigration over the entirety of the next four decades (2010-2050) produces a total U.S. population of 412 million in 2050 — a 103 million increase over 2010. By itself immigration would account for 72 million additional U.S. residents under this scenario. Thus, even if immigration is significantly below the level the Census Bureau foresees, it will still add enormously to the size of the U.S. population.
The importance of immigration to population growth can also be seen by projecting the impact of reduced fertility. If the fertility of natives were to fall 20 percent more than the Census already assumes by 2030, but immigration continued at the pace the Bureau expects, the U.S. population would still grow to 409 million by 2050 — a 99 million or a 32 percent increase from 2010.
The debate over immigration should not be whether it makes for a much larger population — without question it does. The debate over immigration should also not be whether it has a large impact on increasing the working-age share of the population — without question it does not. The key question for the public and policy-makers is what costs and benefits come with having a much larger population and a more densely settled country.
Some foresee a deteriorating quality of life with a larger population, including added pollution, congestion, loss of open spaces, and sprawl. Others feel that a much larger population will create more opportunities for businesses, workers, and consumers. These projections do not resolve those questions. What the projections do tell us is where we are headed as a country. The question for the nation is: Do we wish to go there?
Appendix A


Appendix B: Methodology
We created the projections in this report using a model based on the U.S. Census Bureau's 2008 national population projections. We replicated the Census Bureau projection results for the period 2008 to 2050, however we enhanced our model to separate the native-born and foreign-born components of the population and adjusted the race groups. Finally, we revised the starting point, employing the July 1, 2010, Census Bureau population estimates. The 2010 starting point incorporates the results of the 2010 Census, however the baseline assumptions about births, deaths, and immigration are still derived from the 2008 projection series. In effect, we attempt to replicate the Census Bureau's 2008 projections with an updated starting point.
Below, we describe the race adjustments, replication process, and separation of native and immigrant components for our 2008-based projections, followed by a description of the adjustments made to create projections used in this document that are based on the 2010 starting point.
Replicating 2008 Census Bureau Projections with 5 Race Groups
The roots of the 2008 Census projections are in the 2000 Census.17 While the published data start in 2008, Decision Demographics obtained unpublished details of the model's annual increments from 2000 through 2050 from the Census Bureau's Projections Branch. The Census projections provide data for all years in several racial/ethnic combinations. Our race/ethnic groups were derived from the seven Census groups by collapsing some of the small racial categories. For example, non-Hispanic NHOPI are only 0.1 percent of the U.S. population. This was done in anticipation of separating the native and immigrant components within each race group, which would have created many small groups. Our tests showed that the race changes have a negligible impact on the results. Our five race/ethnic groups were derived from the following seven Census groups:

To create the five race groups, the Asian non-Hispanic and Native Hawaiian and Other Pacific Islander (NHOPI) non-Hispanic groups were combined to create an Asian and Pacific Islander (API) non-Hispanic group; the 2+ race non-Hispanic group was distributed across the four non-Hispanic race groups using allocation factors developed from the 2002 Current Population Survey (CPS).18 These CPS-based allocation factors used to distribute and assign multi-race persons back to single race categories are listed below. American Indian/Alaska Natives in the table below are denoted as AIAN.

The Census Bureau-projected births were combined into our race groups, allocating 2+ race non-Hispanic births to our four non-Hispanic race groups. Census annual projections of male and female births to 2050 were combined and the total fertility rates for women ages 10 to 49 were calculated for the five race groups. Unpublished counts of projected deaths were provided to Decision Demographics by the Census Bureau with complete race, sex, and age detail. The race groups were adjusted to the same five race groups and deaths of persons of 2+ races were allocated to our four non-Hispanic race groups using the same 2002 CPS factors. Unpublished counts of projected immigrants were also provided to Decision Demographics by the Census Bureau by full race, sex, and age detail. These official projections of migrants by race and age from the 2008 projections were allocated to our five race groups in the same manner as the population, births, and deaths using the 2002 CPS factors.
Replication Accuracy. After converting the Census projection model data inputs to our race groups, our cohort-projection model exactly projects the same population to 2050 while using the Census numbers of annual births. In preparation for adding the native and foreign components to the model, the model was tested with calculated total fertility rates (TFRs). With TFRs, the 2040 projection was within 0.2 percent of the Census results; the error rate rose very gradually through 2040. By 2050, the calculation was off by 0.6 percent from Census results. Slight error was introduced by the sex ratios of births that did not exactly follow the Census Bureau sex ratios. Decision Demographics applied an average sex ratio within each of our race groups. These factors were derived by averaging race with the sex ratios implicit in the Census Bureau's projections over all projection years.
Foreign- and Native-Born. The starting populations were divided by immigrant and native status for each race, age, and sex group, using analyses of the annual American Community Survey (ACS) Public-Use Microdata Sample (PUMS) for 2008 and 2010. In the development of native/immigrant allocation ratios, some ACS PUMS race/age groups were combined to maintain adequate sample size for smaller groups and for those with low immigrant representation. For Hispanics, whites, blacks, and API, single-year native and foreign shares by sex were used up to age 34. For ages 35 to 85-plus, the native-foreign ratios for five-year age groups were used. For the smaller AIAN group, all ratios were based on five-year age groups by sex up to ages 70-74. Then the ratio for AIAN groups ages 75-84 and 85-plus were used. Application of these ratios distributed the starting population into two groups, one native-born and the other foreign-born.
For the ACS-based tabulation of the native- and foreign-born shares by our race groups, as well as the TFR tabulations described below, the ACS PUMS data were adjusted to conform to our five race groups. Since the ACS PUMS are individual-level data, the allocation of persons of 2+ races in Census data to our five race categories is somewhat different than when working with aggregate data. The Non-Hispanic 2+ category is small, representing 2.0 percent of the U.S. population.
For each person who indicated belonging to more than one race group, the data record was replicated once for each race group named. These new records were weighted by dividing the original weight by the number of races the respondent indicated. For example, if a person responded that he or she was white, black, and Asian, three copies of the data record were made, one for each of the three races — though with a person level weight one-third of the original value.
The ACS-PUMS data required two additional steps to allocate non-Hispanic persons of an "other" race. The non-Hispanic other race category is small, representing only 0.2 percent of the U.S. population. First, multiple race persons who indicated one of their races as "other" were allocated in the following manner: If, for example, a person indicated they were white and other, then the undefined other response was dropped. A small number of persons indicated they were of only one race, which was "other". These records were treated similarly to persons of multiple races except their weight was assigned proportionately to the existing race distribution. The proportions for this distribution were quite similar to the allocation factors used to distribute 2+ race persons in the aggregate data from the Census Bureau 2008 projection model. The exact allocation factors used were calculated from the ACS file independently for each ACS year.
Analysis of the 2006 through 2008 ACS showed that immigrant women have a higher TFR than native-born women. Next, the ratio of native ACS TFR to overall ACS TFR was calculated for each race. Likewise the ratio of immigrant TFR to overall TFR as reported in the ACS was calculated for each race. These ratios were then applied to the 2008 to 2050 projected TFR levels from the Census projections. For example, for each year and race:
As a result, two TFR schedules were developed for the 2008 to 2050 projection period: one for native-born women and one for foreign-born women. Note that births to foreign-born women are actually native births. Thus when female offspring of foreign-born women reach their childbearing years themselves, the model employs native TFRs to estimate births to these women.
As the replication accuracy discussion above mentions, the use of TFRs introduced a small but compounding error due to sex ratio differences. With the application of native and foreign TFR schedules, a TFR adjustment factor was calculated and applied for each year and race group so the total projected population counts matched the Census projections. Even with adjustments, slight differences in the number of males and females remain.
Death rates were calculated from the 2008 Census Bureau projections using the unpublished counts of projected deaths by age, sex, and race provided to Decision Demographics by the Census Bureau. The native- and foreign-born populations were assumed to have the same death rates. Immigration was incorporated into the model using the concept of net immigration, which represents the difference between the number of people arriving and the number leaving the country. Table 1 in the body of the report shows the number of net migrants used by the Census Bureau. The shares of migrants by age, race, and sex are allocated based on the Census 2008 Projections.19 All net immigration was assumed to accrue to the foreign-born population.20
2010-Based Model. The 2010-based model uses the same birth, death, and migration data derived from the 2008 Census Bureau projections. The only difference is that our projections start from 2010, with the starting population taken from the published 2010 Census Bureau estimates. Essentially, the 2010 estimates represent the April 1, 2010 Census counts projected forward to July 1, 2010. As before, the estimates were adjusted to our five race/ethnic groups. The 2010 estimates were then divided into native and foreign components using the 2010 ACS-based ratios as described above for 2008. All other model inputs remained the same.
End Notes
1 The summary methodology for the Census Bureau's 2008 projections can be found on their website.
2 Some groups of immigrants have much higher fertility than their native-born counterparts. Tracking the foreign-born separately helps to improve the accuracy of our projections, especially when we vary the level of immigration. It also allows us to project the size of the immigrant population under different immigration scenarios.
3 Long-term, using the Census Bureau level of immigration, our projections to the end of this century show that the immigrant population will continue increase, peaking at 20 percent around 2060, and remaining at roughly that level for two decades before declining slightly to 18.7 percent by 2100.
4 See Micheal Hoefer, Nancy Rytina, and Bryan Baker, "Estimates of the Unauthorized Immigrant Population Residing in the United States: January 2011", March 2012, DHS Office of Immigration Statistics.
5 We assume that there are slightly less than 10 million illegal immigrants in the population estimates for 2010. Based on DHS estimates, we further assume that illegal immigrants are 80 percent Hispanic, 11 percent Asian, 3 percent white, 3 percent black, and 3 percent all others. DHS estimates also indicate that 11.4 percent of illegal immigrants are under age 18 and that the adult population is 58 percent male. We then subject this population to removal in our projections over five years based on different departure scenarios.
6 See Ben Wattenberg, Fewer: How the New Demography of Depopulation Will Shape Our Future, 2005. Charles Krauthammer, "Saved by Immigrants", The Washington Post, July 17, 1998; Page A21. Gary Endelman, "Immigration and the Graying of America", visalaw.com.
7 Carl P. Schmertmann, "Immigrants' Ages and the Structure of Stationary Populations with Below-Replacement Fertility", Demography, November 1992, pp. 595-612.
8 Frederick W. Hollmann, Tammany J. Mulder, and Jeffrey E. Kallan, "Methodology and Assumptions for the Population Projections of the United States: 1999 to 2100", Population Division Working Paper No. 38, U.S. Census Bureau, January 13, 2000. Table F on page 29 reports the impact of different levels of immigration on dependency ratios.
9 The .9 percentage-point difference reflects rounding; the actual difference is slightly smaller — .86 percentage points.
10 The July 2012 public-use file of the Current Population Survey shows that 94.5 percent of all employed persons were in this age group.
11 See Steven A. Camarota and Karen Zeigler, "A Drought of Summer Jobs: Immigration and the Long-Term Decline in Employment Among U.S.-Born Teenagers", Center for Immigration Studies, May 2010.
12 The Total Fertility Rate (TFR), which represents the average number of children a woman will have in her lifetime, is 1.94 for natives and 2.58 for immigrants in 2010. If fertility falls 20 percent by 2030 from what the Census Bureau expects, native TFR would be 1.56 for natives and 2.04 for immigrants in 2030. In contrast, the Bureau projects a native TFR of 1.94 in 2030 and a 2.55 TFR for immigrants.
13 See Frederick W. Hollmann, Tammany J. Mulder, and Jeffrey E. Kallan, "Methodology and Assumptions for the Population Projections of the United States: 1999 to 2100", Population Division Working Paper No. 38, U.S. Census Bureau, January 13, 2000.
14 Steven A. Camarota and Karen Zeigler, "A Shifting Tide: Recent Trends in the Illegal Immigrant Population", Center for Immigration Studies, July 2009; Steven A. Camarota and Karen Zeigler, "Homeward Bound: Recent Immigration Enforcement and the Decline in the Illegal Alien Population", Center for Immigration Studies, July 2008; Jeffrey Passel, D'Vera Cohn, and Ana Gonzalez-Barrera "Net Migration from Mexico Falls to Zero — and Perhaps Less", Pew Hispanic Center, April 23, 2012.
15 See Table 3 in Micheal Hoefer, Nancy Rytina, and Bryan Baker, "Estimates of the Unauthorized Immigrant Population Residing in the United States: January 2011", March 2012, DHS Office of Immigration Statistics.
16 See Maritsa V. Poros, "Migrant Social Networks: Vehicles for Migration, Integration, and Development", Migration Policy Institute, March 2011. See also earlier work: Douglas Massey, "The Social and Economic Origins of immigration", Annals of the American Academy of Political and Social Science; Douglas Massey, and Felipe Garcia Espafia, "The social process of international migration", Science, August 1987.
17 "United States Population Projections by Age, Sex, Race, and Hispanic Origin: July 1, 2000-2050", U.S. Census Bureau, 2008. Accessed January 11, 2012.
18 We used the formation developed by Anne Polivka to distribute these racial groups. See Anne Polivka, "Methodologies for Maintaining Data Comparability for the Current Population Survey: One Year Into the Implementation of the 1997 Race and Ethnicity Standard", U.S. Bureau of Labor Statistics, 2003. Unpublished version of Table 3 showing all ages. Paper presented at the American Statistical Association's Joint Statistical Meetings in San Francisco, Calif., August 5, 2003.
19 For our race groups, the Census Bureau assumes that Hispanics will comprise about half of new immigrants for the entire 40-year period, from 49.3 percent in 2010 to 50.1 percent in 2030 and 49.5 percent in 2050. Asians rise slowly from 22.8 percent of new immigrants in 2010 to 25 percent in 2030 and 25.8 percent by 2050. Whites fall slightly from 19.7 percent of new immigrants in 2010 to 15.8 percent in 2050, while blacks rise slightly from about 8 to 9 percent over the same time period.
20 We recognize that this is an incorrect assumption for young adult ages because of military and student flows. Likewise, this assumption is also somewhat in error for those older adults who are return migrants.