Download a pdf of this Backgrounder
Related Publications: Video, Transcript
Steven A. Camarota is the Director of Research and Karen Jensenius is a demographer at the Center for Immigration Studies.
Editor's Note: When we first released this report on May 11, 2010, we acknowledged that factors in addition to immigration contributed to the decline in teen labor force participation. A policy brief issued by the Economic Policy Institute (EPI) in response to our study argued that an increase in summer school enrollment explained the entire decline in teenage employment, stating that enrollment "more than makes up for the decline in teen employment.” This is mistaken. After discussions with Heidi Shierholz, the brief’s author, EPI revised the brief and it now states that the increase in enrollment accounts for “roughly one-third” of the decline. Both CIS and EPI agree that the overwhelming majority of the decline in teen employment would have occurred had there been no increase in summer school enrollment.
This revised version of our paper includes a brief discussion of school enrollment and teen employment.
The share of U.S.-born teenagers (16 to 19) in the labor force — working or looking for work — during the summer has been declining for more than a decade, long before the current recession. In 1994, nearly two-thirds of U.S.-born teenagers were in the summer labor force; by 2007 it was less than half. At the same time, the overall number of immigrants (legal and illegal) holding a job doubled. The evidence indicates that immigration accounts for a significant share of the decline in teen labor force participation. The decline in teen work is worrisome because research shows that those who do not hold jobs as teenagers often fail to develop the work habits necessary to function in the labor market, creating significant negative consequences for them later in life.
Among the findings:
- The summer of 2009 was the worst summer ever experienced by U.S.-born teenagers (16-19) since citizenship data was first collected in 1994. Just 45 percent were in the labor force, which means they worked or were looking for work. Only one-third actually held a job.
- Even before the current recession, the summer labor force participation of U.S.-born teenagers was deteriorating. Between the summers of 1994 and 2000, a period of significant economic expansion, the labor force participation of U.S.-born teens actually declined from 64 percent to 61 percent.
- After 2000, the summer labor force participation of U.S.-born teenagers declined from 61 percent to 48 percent by 2007. Thus even before the current recession fewer teens were in the labor force.
- Teen unemployment — the share looking for a job — has also tended to rise somewhat over time. But the big decline has been in the share of teenagers who are looking for work.
- The number of U.S.-born teenagers not in the labor force increased from 4.7 million in 1994 to 8.1 million in 2007. In the summer of 2009 it stood at 8.8 million.
- The severity of the decline is similar for U.S.-born black, Hispanic, and white teens. Between 1994 and 2007 the summer labor force participation of black teens declined from 50 to 35 percent; for Hispanic teens from 52 to 37 percent; and for whites it declined 69 to 55 percent.
- The fall-off is also similar for U.S.-born teenagers from both high- and low-income households.
- Although a larger share of teens are enrolled in summer school, the fall-off in employment is similar for those in school and those who are not. As a result, the overwhelming majority of the decline in labor force participation would have occurred regardless of the increase in enrollment.
- Immigrants and teenagers often do the same kind of work. In the summer of 2007, in the 10 occupations employing the most U.S.-born teenagers, one in five workers was an immigrant.
- Between 1994 and 2007, in occupations where teenage employment declined the most, immigrants made significant job gains.
- Comparisons across states in 2007 show that in the 10 states where immigrants are the largest share of workers, just 45 percent of U.S.-born teens were in the summer labor force, compared to 58 percent in the 10 states where immigrants are the smallest share of workers.
- Looking at change over time shows that in the 10 states where immigrants increased the most as a share of workers, labor force participation of U.S.-born teenagers declined 17 percentage points. In the 10 states where immigrants increased the least, teen labor force participation declined 9 percent.
- We also find that, on average, a 10 percentage-point increase in the immigrant share of a state’s work force from 1994 to 2007 reduced the labor force participation rate of U.S.-born teenagers by 7.9 percentage points.
- The most likely reason immigrants displace U.S.-born teenagers is that the vast majority of immigrants are fully developed adults — relatively few people migrate before age 20. This gives immigrants a significant advantage over U.S.-born teenagers who typically have much less work experience.
- The labor force participation of immigrant teenagers has also declined, though it was low even in the early 1990s. This along with the similar decline for U.S.-born teens from all racial and income backgrounds supports the idea that the arrival of so many adult immigrants, who work at the kinds of jobs traditionally done by teenagers, crowds all teenagers out of the labor force, both U.S.-born and foreign-born.
- Summer is the focus of this report; however, the decline in the employment of U.S.-born teenagers is year-round, including a decline during the other peak period of seasonal employment at Christmas.
- Although there is good evidence that immigration is reducing teenage labor market participation, other factors have likely also contributed to this problem.
- One factor that does not explain the decline is an increase in unpaid internships among U.S.-born teenagers.
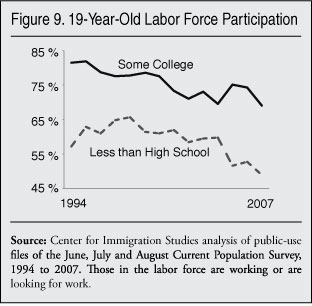
- First, 19-year-old high school dropouts show a similar decline as 19-year-olds who attend college — dropouts are very unlikely to be in unpaid internships.
- Second, 16- and 17-year-olds show the same decline as 18- and 19-year-olds, even though younger teens are much less likely to be in internships.
- Third, teenagers who come from low-income families show the same decline as teenagers from high-income families. But research shows that unpaid internships are much more common for higher-income teenagers.
- Fourth, according to Princeton Review’s Internship Bible, there are only about 100,000 internships (paid and unpaid) in the country. The increase in U.S.-born teenagers not in the labor force was 3.4 million between 1994 and 2007.
Introduction
Teenagers working in the summer are an enduring image of life in the United States. As the weather warms, older high school students, some who failed to graduate high school, new high school graduates, and those in the first years of college have traditionally filled jobs as waiters, waitresses, life guards, babysitters, landscapers, laborers, cashiers, and other occupations that require relatively little formal education. But this rite of summer has become less and less common for American teens. In 1994, nearly two-thirds of U.S.-born teenagers were in the summer labor force; by 2007 less than half were in the labor force. While 2008 and 2009 were particularly bad summers for U.S.-born teens, the deterioration began long before the current recession.
At the same time as U.S.-born teenagers are working less and less in the summer, many business associations are lobbying Congress to increase the number of immigrants allowed into the country. Those employers arguing specifically for an increase in seasonal guest workers were among the most politically active. The U.S. Chamber of Commerce has been in the forefront of arguing that legal immigration has to be increased because there are not enough workers available. Also, the Essential Worker Immigration Coalition (EWIC) was specifically founded to work for legal status for illegal immigrants and to increase legal immigration, including guestworker programs to allow in more unskilled workers. EWIC includes the National Restaurant Association, American Hotel & Lodging Association, American Nursery & Landscape Association, International Association of Amusement Parks and Attractions, International Franchise Association, National Association of Home Builders, National Retail Federation, and the Outdoor Amusement Business Association.1 All of these industries employ large numbers of seasonal workers to do jobs that require modest levels of formal education. These are specifically the type of jobs traditionally done by teenagers.
It is very difficult to reconcile the perspective of employers who argue that there are not enough seasonal workers with the huge decline in teenage summer employment. If workers were in short supply, then more teenagers should have been drawn into the labor market, the opposite of what actually happened.
While some employers have argued that immigration needs to be substantially increased, the level of immigration is already very high. Between 1994 and 2007 the number of immigrants (legal and illegal) holding jobs doubled to 23.2 million. Nearly one million green cards (permanent immigration) were issued each year on average over this time period and the number of illegal immigrants in the country is estimated to have roughly doubled.2 While much smaller in scale than illegal immigration and permanent legal immigration, there are also a number of programs that allow foreign temporary workers to take unskilled seasonal jobs outside of agriculture.
One of the most important programs for seasonal non-agricultural workers is the H-2B program. More than 900,000 H-2B guest worker visas for seasonal non-agricultural work were issued between 1994 and 2009. Created in 1990, the annual number of H-2B visas rose from 10,400 in 1994 to a peak of 129,547 in 2007.3 In addition, nearly four million J visas (excluding family members) were issued to exchange visitors between 1994 and 2009 in 12 different programs. About two-thirds of all exchange visitors in the United States are working, rather than studying or doing research. While many J visa workers are likely not in competition with teenagers, between 2001-2007 1.19 million exchange workers were issued for Au Pair, Camp Counselor, Intern, Summer Work/Travel, and J-1 Trainees. Many of these individuals work in occupations that often employ large numbers of teenagers. There is also the Q-1 visa, sometimes referred to as the “Disney visa.” Created in 1990 at the request of the owners of large theme parks, from 1994 to 2009 24,789 Q-1 visas were issued. Since so many of the workers in the H2B, J, Q-1 visa programs are employed in jobs that require relatively little education, often in the summer, the impact on American teenagers is likely to be significant.4 However, the vast majority of the increase in unskilled immigrant labor was due to legal permanent immigration and illegal immigration.
As we will see, there is good evidence that immigrants (legal and illegal) are crowding out U.S.-born teenagers in the labor market. Perhaps employers perceive immigrants as better workers and therefore discriminate against U.S.-born teenagers. But the most likely reason immigrants displace U.S.-born teenagers is that the immigrants are overwhelmingly adults over age 20. It may be very difficult for teenagers, especially younger teenagers 16 and 17, to compete with mature workers. Perhaps it is due to a willingness by immigrants to work for less. Perhaps it is because immigrants have more effective social networks for finding employment. Whatever the reason, non-work is becoming the norm among teenagers as more and more of them sit idle each summer. In fact, more and more are sitting idle in non-summer months as well.
The fall-off in teenage employment is similar for white, black, and Hispanic teens. It is also similar for teenagers from higher income households and lower income households. In addition, the fall-off in employment is similar for those enrolled in school and those who are not. Because teenagers from all backgrounds are affected, it strongly suggests that the cause of this decline is a change in the U.S. labor market rather than some change in the teenagers themselves.
The decline in teenage employment may contribute to significant problems for U.S. workers down the road and should be a concern for policy makers and the public. A number of studies have found that early labor market experiences have a significant impact on wages and labor market attachment later in life. Those who do not work as teens often do not work or work much less later in life, particularly those who do not go on to college. When formulating immigration policy, the potential impact on Americans teenagers should be a consideration.
Why Teenage Employment Matters
There are two primary reasons to be concerned about the decline in the employment of teenagers. The first and most immediate is that many teenagers or their families need the money that employment provides. There are about 260,000 births a year to U.S.-born teenage mothers.5 While most commentators believe teen pregnancy to be a problem, the fact remains that most of these girls choose to keep their babies and thus must support them in some way. Moreover, one in seven U.S.-born teenagers lives in poverty and one in three lives in a low-income family.6 Even a few thousand dollars a year contributed by a teenager working part-time can significantly improve the well-being of such families. A teenager making $8 an hour working seven hours a week year-round or full-time for nine weeks in the summer can contribute about $3,000 a year to a family’s income. This would represent a 10 percent increase for a family with income of only $30,000. Lack of work among teenagers may create real hardship for some low-income families.
The second reason to be concerned about the decline in work among teenagers is the long-term negative consequences for teenagers themselves, and potentially for society. Andrew Sum and his colleagues at Northeastern University have been writing for some time on the difficulty that young and less-educated workers face in the labor market and the problems this is creating. Sum argues that the decline in teenage employment is very worrisome. He observes:
A substantial and growing body of literature on the early labor market experiences of young adults over the past 30 years indicates quite consistently that employment during the high school years generates a diverse number of favorable short-term and long-run positive impacts on their employability, wages, and earnings, especially among those who do not go on to complete any substantive amount of post-secondary education.
Teenagers who have more frequent and intensive employment in the labor market during their junior and senior years of high school tend to have greater participation and less time unemployed during their first year following high school.7
The negative impact of not working in one’s teenage years can last a very long time. Lauren Rich has focused on high school graduates who do not pursue higher education, at least not soon after high school. She finds that work experience during high school significantly relates to future work experience after controlling for background variables. The impact of high school work experience on future economic attainment is significant eight years after terminating schooling. Teens employed in high school earn more than teens who did not work in the first year after graduation, with wage differences tending to increase over time. Also, teens who were employed in high school are more likely to be employed and work more hours during the year, with a significant relationship between hours worked in high school and subsequent hours worked and wages earned.
Rich also points out that when youths have problems transitioning from school to the labor market, the result is high early rates of unemployment that negatively affect future employment and lead to weak (or discouraged) labor force attachment. This finding is particularly problematic among disadvantaged and minority youth.8 Other studies show that minority youths holding jobs have higher success rates in the labor market after high school than those who do not work in high school. Leventhal and Brooks-Gunn sample low-income African American youth. They find the subset of teens that did not work is significantly more disadvantaged than that of those who did work and that earlier entry into the workforce leads to a greater chance of completing high school.9
Ruhm finds that holding a job in one’s senior year of high school is associated with substantially better future economic attainment in the form of earnings, wages, occupational status, and the receipt of fringe benefits. Also, jobs held during the senior year yield substantial and lasting benefits for those who remained in high school through graduation. For example, six to nine years later, seniors who worked 20 hours per week earn approximately 22 percent more annually and obtain 9 percent higher hourly wages and 11 percent greater hourly compensation than their counterparts who did not work. Also, non-college bound teens who worked 20 hours a week in high school earn about 20 percent more than teens not attending college who did not work.10
There are other studies that support the finding that working while a teenager creates significant long-term benefits. Mortimer et al. followed teenagers until age 29 or 30 and found that teenage work patterns influenced the amount of time it takes to reach what is considered a career job.11 Carr et al. also find a positive effect on labor force outcomes such as labor force participation, labor force status, and income for teens who had worked in high school. Holding background factors constant, working in high school leads to a greater chance of being in the work force as well as higher earnings.12
The biggest benefit of working as a teenager seems to be for those who do not go on to college. While it may seem at times that everyone who graduates high school goes on to college, a very large share of U.S.-born teenagers do not go on to college. Of U.S.-born 20-year-olds in 2008, 42 percent had no additional schooling after high school. This includes college or other training. And the overwhelming majority of Americans have not completed a four-year degree. This is true for every age group. In 2008, only 27 percent of U.S.-born 25-year-olds, for example, had completed a bachelor’s degree.
Researchers have identified several reasons for why working as a teenager creates so many short- and long-term benefits. Holding a job as a teenager seems to instill the habits and values that are helpful in finding or retaining gainful employment later in life. This may include showing up on time, following a supervisor’s directions, completing tasks, dealing politely with customers, and working hard. Learning good work habits and values seems to become much less likely without holding a job at a young age. Once a person who has little or no work experience reaches full adulthood, learning these skills seems to become more difficult. Other factors also may explain the benefits of early employment. Teenagers may gain social contacts on one job that provide them the opportunity to find their next job as their career develops. In some cases teenagers may even acquire specific skills that make them more employable, such basic auto repair or learning to be a short order cook. Whatever the reason for the benefits of teenage employment, they are large and long-lasting.
There is another reason to be concerned about the decline in teenage labor force participation and employment: As time goes on and some jobs are done increasingly by immigrants, society in general is likely to become less interested in the wages and working conditions or even safety of such jobs. If some fraction of native-born Americans have worked as construction laborers or landscapers, even if only in their youth, then they will at least have some appreciation for what the jobs entail and some connection to those who do them. While this problem may be difficult to define, it still can be a real problem. A society in which some types of jobs are seen as beneath the station of Americans may not be a very attractive society.
Data and Methodology
The data for this study come primarily from the public-use files of the June, July, and August Current Population Surveys (CPS) collected monthly by the Census Bureau for the Bureau of Labor Statistics. By combining the three summer months we are able to get more robust estimates. This is especially useful when examining smaller sub-populations, such as U.S.-born minorities.13 Each month the CPS includes about 130,000 respondents, roughly half of whom are in the labor force. The CPS is the nation’s primary source for unemployment data and other labor force statistics. It does not include persons in institutions, such as prisons or nursing homes. The government publishes employment statistics that are both seasonally adjusted and unadjusted from the survey. This report provides both seasonally adjusted and unadjusted unemployment rates for U.S.-born teenagers from 1994 to 2009. There is little difference in the seasonally adjusted data compared to the seasonally unadjusted data because we are comparing the same months each year. Most of the statistics reported here are seasonally unadjusted because they are computationally simpler and therefore much easier for other researchers to replicate.
Beginning in 1994, the Current Population Survey included a question on whether a person was foreign-born. In this report we use the terms foreign-born and immigrant synonymously. The foreign-born are defined as persons living in the United States who were not U.S. citizens at birth. This includes naturalized American citizens, legal permanent residents (green card holders), illegal immigrants, and people on long-term temporary visas such as students or guestworkers. It does not include those born abroad of American parents or those born in outlying territories of the United States such as Puerto Rico, who are considered U.S.-born or native-born. Prior research indicates that Census Bureau data like the CPS capture the overwhelming majority of both legal and illegal immigrants. The Department of Homeland Security (DHS) Office of Immigration Statistics estimates that the undercount in Census Bureau data for immigrants is about 5.5 percent. Most of this undercount is of the illegal immigrant population. The undercount of illegal immigrants specifically is thought by DHS to be 10 percent.14
What’s Been Happening to Teen Summer Employment?
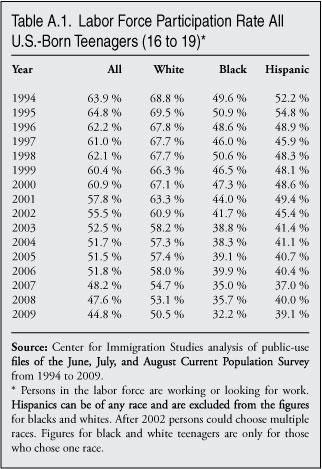
A Long-Term Decline in Teen Labor Force Participation. Teenagers can, of course, work any month. But summer has traditionally been a time when many more teenagers look for and find jobs. Those looking for a job or holding a job are considered to be in the labor force. Those not working nor looking for work are considered not in the labor force. Figure 1 shows the labor force participation of U.S.-born teenagers from the summer of 1994 to 2009. That is, it shows the share of teenagers working or looking for work. (Table A.1 in the Appendix reports the percentages shown in Figure 1.) In this report we tend to concentrate more on the figures for 1994 to 2007 because after 2007 the economy deteriorated dramatically. The very low summer labor force participation in 2008 and 2009 among U.S.-born teens should improve significantly as the economy recovers from the current recession. Though if the pattern from the last recession holds, it will not return to pre-recession levels. It makes sense to focus more on trends before the current recession; otherwise our assessment will be overly pessimistic. However, we do report figures for the summers of 1994 to 2009.
Figure 1 indicates that the decline in summer labor force participation among U.S.-born white, black, and Hispanic teenagers has been almost identical. But because whites had much higher labor force participation to begin with, whites continue to have higher labor force participation through 2009. The decline for all U.S.-born teenagers from 1994 to 2000 is three percentage points. For whites it is 1.7 percentage points; for Blacks it is 2.3 percentage points; and for Hispanics it is 3.6 percentage points. This decline, while not enormous, is difficult to explain because 1994 to 2000 was a period of significant economic expansion, yet a smaller share of teenagers was in the labor force at the end of this period than the beginning. Of course, it was also a period of very high immigration.
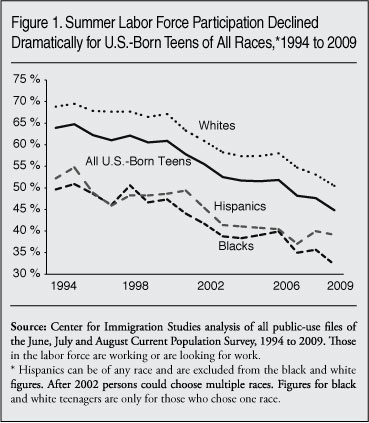
Since 2000 things have deteriorated very significantly. The overall summer labor force participation rate for U.S.-born teenagers declined 12.7 percentage points from 2000 to 2007, with fewer than half — 48.2 percent — in the labor force in the summer of 2007. The summer of 2006 seems to have been somewhat better for U.S.-born teenagers than 2007, even though the recession did not officially begin until the end of 2007. If the summer of 2006 is compared to 2000 it still shows a very large decline. The decline was again almost identical for all three racial/ethnic groups in the 2000 to 2006 period. Overall, Figure 1 shows that U.S.-born teenagers have gone from nearly two-thirds being in the summer labor force in 1994, to the majority of teenagers not working or looking for work in the summer of 2007.
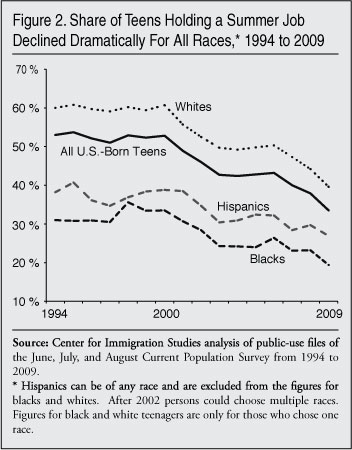
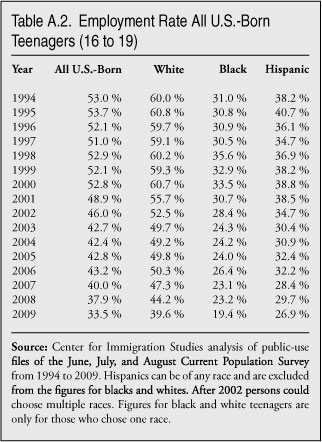
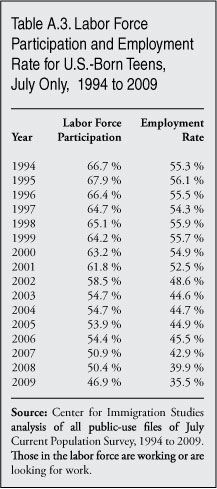
There are other ways to look at the labor market and employment in addition to labor force participation. Figure 2 reports the summer employment rate for U.S.-born teenagers from 1994 to 2009. The employment rate is the share of U.S.-born teenagers actually holding a job. (Table A.2 in the Appendix shows the numbers for Figure 2.) Like the decline in labor force participation in Figure 1, Figure 2 shows a significant decline in employment rates. In 1994, 53 percent of U.S.-born teenagers held a summer job, but in 2006 it was 43 percent and in 2007 it was 40 percent. By 2009, it was just 33 percent. For U.S.-born minorities the employment rate is extremely low. In the summer of 2007 just 23 percent of U.S.-born black teenagers were employed, as were 28 percent of U.S.-born Hispanic teenagers. For whites it was 47 percent. The figures for the summer of 2009 are much worse, with just 19 percent of U.S.-born black and 27 percent of U.S.-born Hispanic teenagers holding a job.
The decline in summer labor force participation and employment rates for U.S.-born teens almost certainly goes back further than 1994. There is evidence that a larger share of U.S.-born teens was in the labor force or employed in the late 1980s. We estimate that in the summer of 1989 the labor force participation rate of U.S.-born teenagers was 68 percent and the employment rate was 58 percent.15 If we compare the current rates, or those in 2007 before the recession, to the level back in 1989 the decline is even steeper.
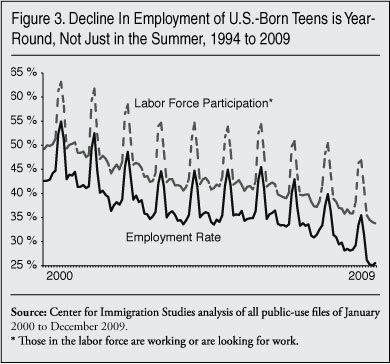
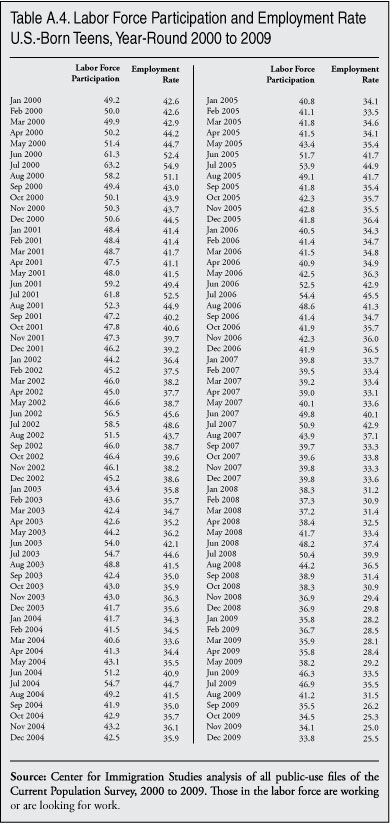
Figure 3 shows the labor force participation rate and employment rate of U.S.-born teenagers for all months January 2000 to December 2009. (Table A.4 in the Appendix reports the numbers for Figure 3.) The peaks are the summer months. The overall downward trend is the same as it is for the summer months shown in Figures 1 and 2. For example, the Christmas season is another period of high seasonal employment. In December 2000, 50.6 percent of U.S.-born teenagers were in the labor force; in 2007 it was just 39.8 percent. Month-over-month comparisons for other years show a very similar decline.
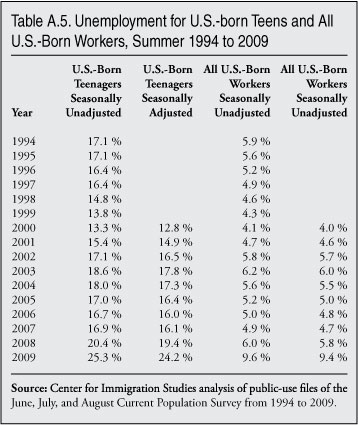
Unemployment Does Not Explain Growth in Teen Non-Work. Though economists examine many measures of employment; the measure familiar to most people is the unemployment rate. The unemployment rate is the share of people looking for work divided by the number of people with a job plus those looking for work. People who are not working or actively looking for a job are not included in the numerator or denominator of the unemployment rate. To be considered unemployed one has to be actively looking for a job and have done so within the last four weeks. Figure 4 shows the summer unemployment rate from 1994 to 2009 for U.S.-born teenagers. (Table A.5 in the Appendix shows the numbers for Figure 4). Both seasonally adjusted and unadjusted figures are reported. The government publishes both adjusted and unadjusted figures. Since we are comparing the same time of year (summer) from 1994 to 2009, it makes little difference whether figures are seasonally adjusted or not. The unemployment rate for U.S.-born teenagers shows variation based on the economy. Teen unemployment declined as the country came out of the recession in the early 1990s, then rose during the recession in 2001 and then went up again during the current recession.
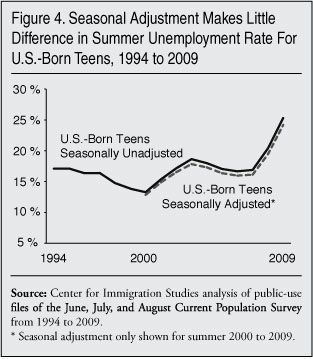
The situation after the 2001 recession for teenage summer unemployment is odd because unemployment never really recovers for teenagers. In both 2006 and 2007 it was nearly 17 percent and never got back to pre-recession levels of only about 13 percent in 2000. But the rise in unemployment does not explain the deterioration in labor force participation. Again, those who are unemployed are considered in the labor force. During recessions, labor force participation does generally decline as people give up looking for work. However, it is not typically as closely linked to the business cycle as the unemployment rate. But as will be recalled from Figure 1, labor force participation for U.S.-born teenagers declined even as unemployment fell in the 1990s. We can see this most clearly by looking at Figure 5. (It should be noted that the unemployment percentages in Figure 5 do not match those in Figure 4 because the standard definition of unemployment, shown in Figure 4, uses only those working and those looking for work as the denominator. In Figure 5 the entire U.S.-born teenage population is the denominator.)
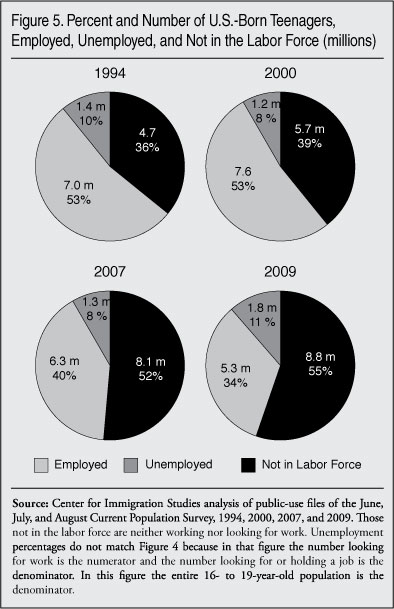
What Figure 5 shows is that it is not the number or share that are unemployed that really changed dramatically, rather it is an enormous growth in the share who are not in the labor force. This is very difficult to explain. Economic growth from 1994 to 2000 and 2003 to 2007 should have drawn more teens into the labor market. But this is not what happened. Fewer U.S.-born teens were working or looking for work in the summer even as the economy expanded significantly in the 1990s. This was even more the case during the economic expansion from 2003 to 2007.
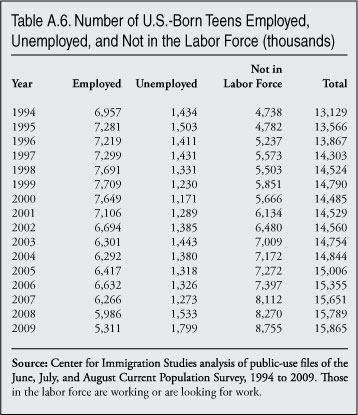
Number of Teenagers Not in Labor Force Grew Dramatically. Figures 1 through 5 report percentages. Figure 6 reports numbers. It shows the total number of U.S.-born teenagers — employed, unemployed, and not in the labor force in the summer. (Table A.6 in the Appendix reports the numbers for Figure 6.) The number unemployed has increased recently, but that’s not the key finding in Figure 6. Instead, what is striking about Figure 6 is that the number not in the labor force has grown dramatically. During the economic expansion of the 1990s, the number of U.S.-born teenagers not working actually increased by 900,000.16 Not surprisingly, the number not in the labor force rose from 2000 to 2003 as the country headed into and slowly recovered from the recession. Although the recession was over after 2001, it always takes a year or two for employment to recover. But after the summer of 2002 or 2003 the number not in the labor force continued to increase even though the economy and employment for other workers was generally recovering. Overall, the number not working or looking for work was 400,000 higher in 2006 than in 2003, and it was 1.1 million higher in 2007 than in 2003. Year-over-year comparisons show that in all but two years from 1994 to 2009 there was an increase in the number of U.S.-born teenagers not in the labor force. It must be remembered that during this time period business groups continued to argue that no seasonal workers were available and that more immigrant workers needed to be allowed into the country. This argument is difficult to reconcile with the findings in Figure 6.
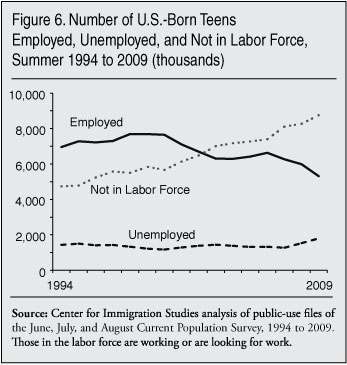
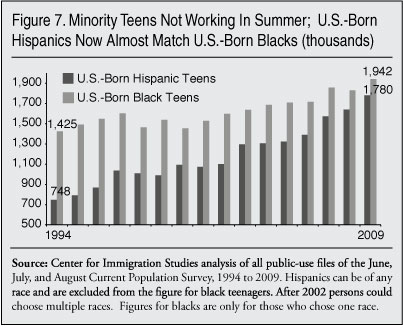
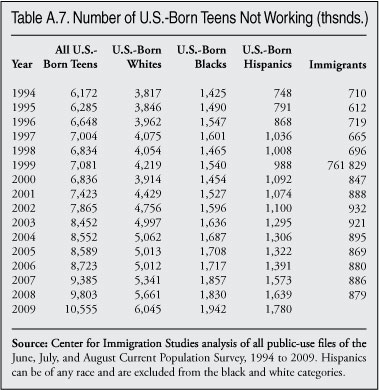
Figure 7 shows the growth in the number of minority teenagers not working — unemployed or not in the labor force. (Table A.7 in the Appendix shows the numbers for Figure 7) Reflecting the large growth in the overall number of U.S.-born Hispanic teenagers, and the significant deterioration in their employment situation, Figure 7 shows an enormous increase in the number of U.S.-born Hispanics not working.17 The number of U.S.-born Hispanic teenagers not working in the summer grew 110 percent between 1994 and 2007. If current trends continue, in just a few years there will be significantly more U.S.-born Hispanic teenagers not working than African American teenagers.
What Accounts for the Decline?
Internships Not the Cause of Decline. The fall-off in labor force participation among U.S.-born teenagers is certainly profound. But the question remains: Why did this happen? One possible explanation is that there has been a dramatic increase in unpaid summer internships among high school students or those in the first year or two of college. Unpaid internships are generally undertaken as a means of improving one’s resume. But according to Princeton Review’s Internship Bible, there were only about 100,000 internship positions in the United States and abroad, perhaps half of which are unpaid. The increase in the number of U.S.-born teenagers not in the labor force is 3.4 million. The number of internships seems far too small to account for the huge decline in teenage employment.
There is no way to directly measure internships in the Census Bureau data used here. If the internship is paid it will show up as employment. If it is unpaid an individual will shown up in the data as unemployed if they are also looking for a paid position or as not in the labor force if they report they are not looking for work. What information is available in the data shows that unpaid internships almost certainly do not explain the decline in labor force participation of teenagers.
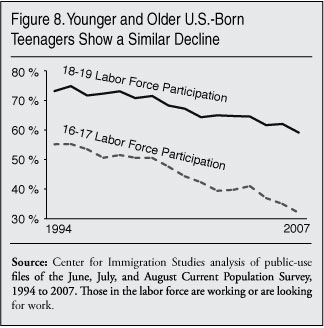
Unpaid internships should be more common among older teens, as it is something college students generally do, not high school students. If more teens are holding unpaid internships and this is causing the decline in reported employment, then we would expect to see a larger decline among older teens. Figure 8 shows labor force participation for U.S.-born 16- and 17-year-olds separately from 18- and 19-year-olds. It shows that the decline was actually somewhat steeper among younger teens, the group least likely to be in unpaid summer internships. Figure 9 examines labor force participation for U.S.-born 19-year-olds who report that they have completed some college and for U.S.-born 19-year-olds who report that they have not completed high school. These are two populations on very different career tracks. Those who have attended college are the teenagers most likely to be in unpaid summer internships. High school dropouts on the other hand are very unlikely to have an unpaid internship. Yet the decline looks to be similar for both groups.18 Figures 8 and 9 both indicate that unpaid internships cannot account for the overall decline in labor force participation for U.S.-born teenagers. It is also worth noting that the summer labor force participation rate of U.S.-born 15-year olds, who would seldom if ever be in unpaid internships, has declined proportionally in the same manner as teenagers 16 to 19 years of age.
Children of Affluent Parents Working Less? Internships are much more likely to be associated with affluent college students.19 They are one of the many advantages that come from having parents who can support non-working teenage children. More generally, affluent parents may be one of the reasons fewer teenagers are working. They can provide their children with material possessions, summer vacations, or support during an unpaid internship. If this is the case, the decline in work among teenagers should be more pronounced among teenagers with more educated parents who have higher incomes.
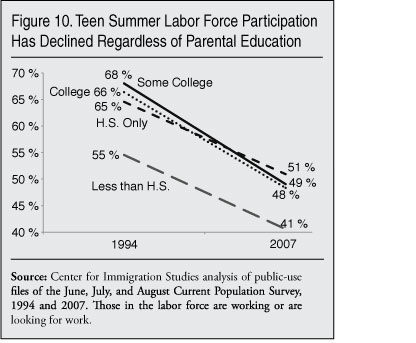
Figure 10 reports the summer labor force participation rate for teenagers based on the education level of the household head. The figure is measuring teenage labor force participation by the education level of their parent(s). The figure shows teenagers with more-educated parents are more likely to work than those with the least-educated parents. Moreover, the decline is very similar for all groups. College-educated parents are the ones most likely to have the resources to spoil their children. But the pattern of decline is almost identical for teens by the education level of their parents. This does not support the idea that it is the children of affluent, indulgent parents who are working less and less.
Examining teen employment by the income of the household in which they live is not really possible with the summer CPS data used in this study. The monthly data do not provide a complete picture of total household income from all sources. However, the CPS collected in March of each year, referred to as the Annual Social and Economic Supplement (ASES), does ask questions about income from all sources. It has traditionally been the primary source of statistics on household income in the United States. The ASES also asks respondents about employment in the calendar year prior to the survey. Using the 1995 and 2008 ASES, Figure 11 reports the share of U.S.-born teenagers holding a job at any time during 1994 and 2007 by household income. Although it measures employment for the entire year, not just in the summer, the results in Figure 11 are very similar to the decline in summer employment shown elsewhere in this report.
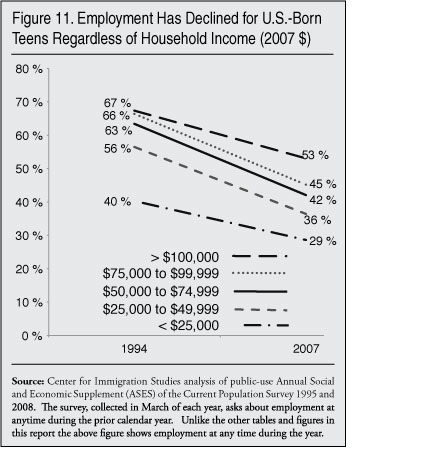
Figure 11 shows that employment has fallen for teenagers from all income groups, with the middle income groups exhibiting a somewhat steeper decline than the lowest and the highest groups. The teenagers with the largest percentage-point decline are those in households with incomes of $25,000 to $50,000 a year. This income group also shows the largest proportional decline. The smallest proportional decline is for teenagers in households with incomes of $100,000 or more a year. Figure 11 also shows that teenagers from higher income households were still much more likely to work in 2007, as they were in 1994. These findings are entirely inconsistent with the idea that non-work among teens reflects growing affluence and the indulgence of their parents. The teens least likely to work are from the lowest-income households and the declines are less pronounced for teens from the highest income households. To be sure, all income groups show a similar decline, but it is not related to income.
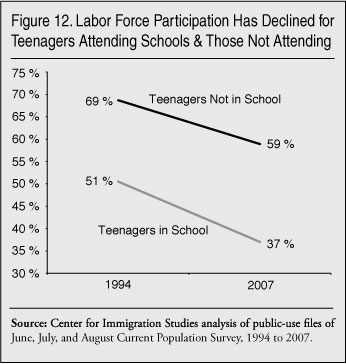
Figure 12 reports labor force participation for teenagers who are enrolled in school and those not enrolled in school. It shows that labor force participation has declined for both groups in a similar fashion. The figure also shows that those U.S.-born teenagers in school are much less likely to be in the summer labor market. At the same time, there has been a significant increase in the share of teenagers who are enrolled in school during the summer. Between 1994 and 2007, the share of U.S.-born teenagers in summer school increased from 26.3 to 51.1 percent. One way to estimate the relative importance of the increase in enrollment is to assume that the labor force participation rates for enrolled and non-enrolled students remained unchanged, but the share in summer school increased as it did between 1994 and 2007. Using this approach allows us to estimate how much of the decline in teen summer employment may be due to the increases in the share of teenagers who are in school. This type of analysis shows that the increase in enrollment by itself explains 4.8 percentage points instead of the 15.7 percentage-point decline that actually occurred between 1994 and 2007. This implies that the increases in enrollment accounted for 28.7 percent (4.51/15.74) of the decline in labor force participation.
Later in this report we compare differences across states over time using an OLS regression model. The model does not find that the increase in school enrollment played a statistically significant role in the decline in teen labor force participation. It seems likely to us that the increase in school enrollment did play some role in reducing labor force participation for U.S.-born teenagers, but factors other than increased school enrollment were much more important.
When we first released this report on May 11, 2010, we did not include a discussion of school enrollment’s possible role in reducing teenage employment. Instead, we simply observed that factors in addition to immigration explain the decline in teen labor force participation. However, an Economic Policy Institute (EPI) policy brief issued in response to our study argued that the large increase in school enrollment, “more than makes up for the decline in teen employment.” This implies that the increase in enrollment explains the entire decline in teenage employment. As the above analysis makes clear, EPI is mistaken about this assertion. After friendly discussions with Heidi Shierholz, the brief’s author, EPI revised the brief and it now states that the increases in enrollment account for “roughly one-third” of the decline. This is very similar to the 28.7 percent we report above. Both we and EPI agree that the overwhelming majority of the decline would have occurred had there been no increase in summer school enrollment.
It is also worth pointing out that the increase in the share of U.S.-born teenagers enrolled in school explains none of the decline when those enrolled and those not enrolled are considered separately. The decline in labor force participation for both groups considered separately is large and is an important trend by itself.
The decline in teenage employment is very broad. It has fallen for teenagers with well-educated parents and those whose parents are less educated. It has fallen for teenagers from high-income households and for those from low-income households. As we have also seen, it has fallen in a similar fashion for white, black, and Hispanic teens. Younger teens and older teens have been equally affected. It has fallen for teenage high school dropouts and those who attend college. Because teenagers from all backgrounds are affected, it strongly suggests that the cause of this decline is a change in the U.S. labor market rather than some underlying change in the teenagers themselves.
Immigration’s Impact on U.S.-Born Teens
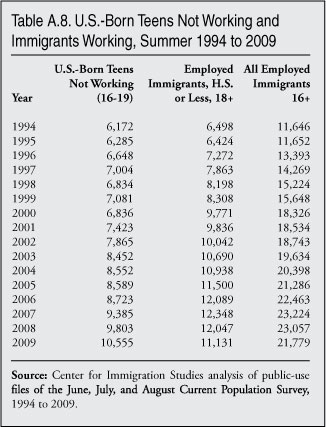
Immigration and the Growth of Non-Work Among Teens. Figure 13 shows the number of U.S.-born teenagers not working from 1994 to 2007. This includes those not in the labor force and those unemployed. It also shows the number of immigrants (legal and illegal) who are holding a job in the summer and the number of less-educated immigrants holding a job. Less-educated is defined as having no education beyond high school. (Table A.8 in the appendix shows the numbers used for Figure 13.) We report less-educated foreign-born workers separately because immigrants in the occupations employing the most U.S.-born teenagers in the summer often have no education beyond high school.20
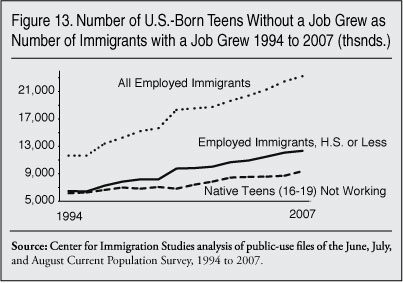
Figure 13 shows that the number of immigrants working in the summer doubled from 11.6 million in 1994 to 23.2 million in 2007. At the same time, the number of U.S.-born teenagers not in the labor force increased by 3.2 million from 1994 to 2007. Since 2007 it has grown another 1.2 million, and stood at an all time high of 10.5 million in the summer of 2009. It is important to note that most immigrants working in the summer are not seasonal workers — in contrast to teens, many of whom only work in the summer. On the other hand, many immigrants are seasonal workers. More importantly, as we will see, immigrants now comprise a very large share of workers in many occupations that employ teenagers.
Comparisons Across Occupations
Teenagers and Immigrants Often Work the Same Jobs. There is no question that as the number of immigrants holding a job has increased, the share and number of U.S.-born teenagers not holding a job has also increased. But the question remains: Do U.S.-born teenagers and immigrants do the same kind of work? Or perhaps more accurately, are there a large share of immigrants in the occupations that employ teenagers?
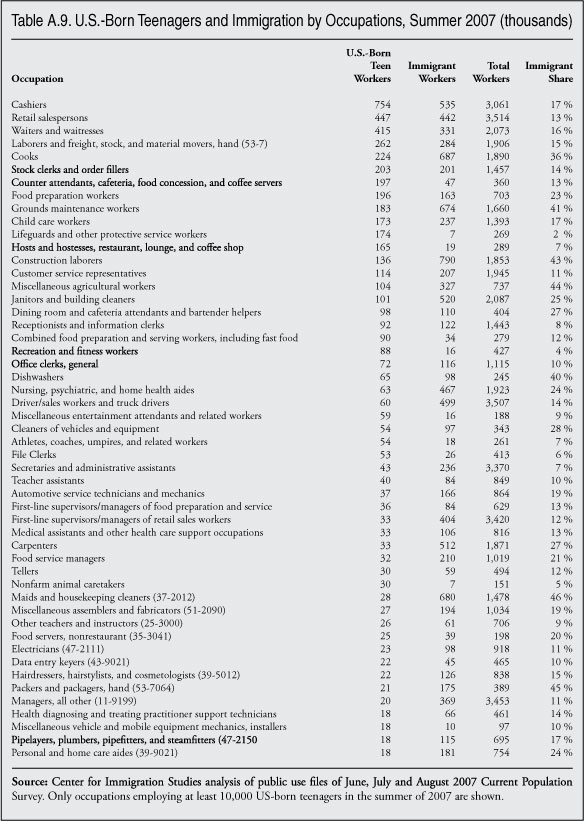
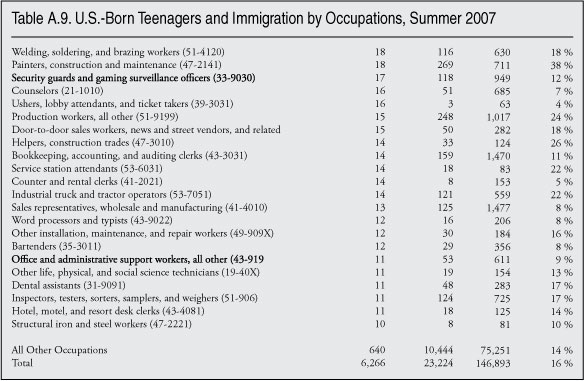
Table A.9 in the Appendix shows a detailed occupational break down for teenagers and immigrants in the summer of 2007, before the recession. The table ranks the occupations by the number of teenage workers. The table shows that, in fact, many teenagers are employed in high-immigrant occupations. For example, nearly half (48.7 percent) of all U.S.-born teenagers employed in the summer of 2007 worked in the 10 occupations listed first in Table A.9. On average, 20.2 percent, or one out of five workers, were legal or illegal immigrants in the top-10 teenage occupations. In the top-15 teenage occupations shown in the table, which employed 59.9 percent of all U.S.-born teenagers in the summer of 2007, on average 21 percent of all workers are immigrants. There were a total of 3.7 million U.S.-born teenagers in the top-15 teen occupations in the summer of 2007. These same occupations employed five million immigrants. In short, most U.S.-born teenagers work in occupations where immigrants make up a large share of workers. The argument that immigrants do jobs that no American teenager would want is simply incorrect.
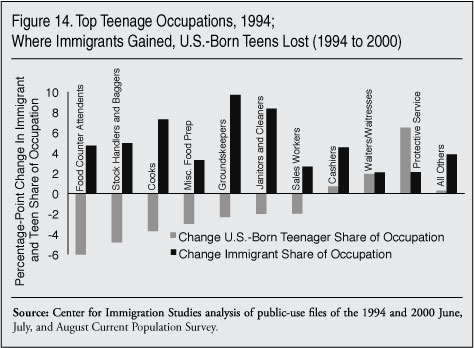
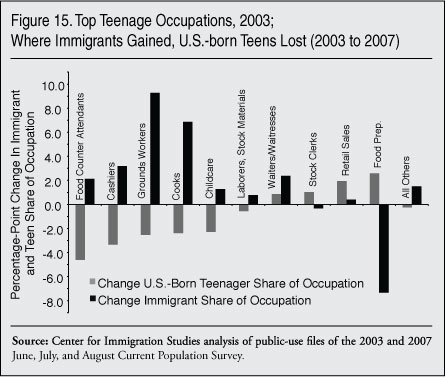
Immigrant Gains, Native Losses. One way to compare the specific impact of immigration on the employment of teenagers is to examine changes over time by occupation. Unfortunately, the way the Department of Commerce and the Census Bureau defined occupations changed significantly after 2002. The Census Bureau documentation warns that even when occupations retain the same name, the meaning may still be different. Thus, it is not possible to directly compare 1994 to 2007. But occupations are consistent from 1994 to 2000, when the economy peaked. They are also consistent, though different from the earlier period, from 2003 to 2007. The 1994 to 2000 period and the 2003 to 2007 period should both show significant employment growth for U.S.-born teenagers because they were periods of economic expansion.
Figure 14 reports the change (1994-2000) in the share of each occupation that is comprised of U.S.-born teenagers and of immigrants in the 10 occupations that employed the most U.S.-born teenagers in 1994. So, for example, the table reads as follows: Between 1994 and 2000 the share of all food counter workers who are U.S.-born teenagers declined six percentage points, while the share comprised of immigrants increased five percentage points. Figure 15 shows the change from 2003 to 2007 for the top-10 teenage occupations in 2003. Both figures show that among the occupations employing the most teenagers, where immigrants gained employment, the U.S.-born teenager share generally declined. On the other hand, Figures 14 and 15 show that in occupations where immigrants made modest employment gains or even fell as a share of workers, U.S.-born teenagers generally did much better.
It is worth noting that U.S.-born teenagers were the same share of the total working-age population (16 to 65) in 1994, as they were in 2007 or in 2009 — about 8 percent. In fact, they increased their share of the potential worker population slightly.21 Thus it might be expected that they would have maintained or even slightly increased their share of occupations in which they were well represented. Figures 13 and 14 show this is not the case in the top teenage occupations. It is also not the case when we look at all summer workers. U.S.-born teenagers were 5.6 percent of all summer workers in 1994, 4.3 percent in 2007, and 3.8 percent in 2009. Although they are the same share of potential workers, they account for a falling share of actual workers. This is not conclusive proof that immigrants are displacing U.S.-born teenagers. But the findings are consistent with that possibility.
Comparisons Across States
One way to examine the relationship between immigration and the employment of teenagers is to look for differences across the country, comparing the relationship between the immigrant share of an area and employment among U.S.-born workers. While this approach makes intuitive sense, there are two fundamental problems with it. First, in the economics literature there is evidence that comparisons across labor markets are problematic when it comes to immigration because the movement of capital and labor from place to place in response to immigration means that the effects of immigration may be diffuse and not confined to only areas of immigrant settlement. There is certainly evidence that this is going on in the United States.22 The comprehensive study of immigration by the National Research Council in 1997 observed, “If native workers or native capital responds to immigration by moving to other labor markets, the impact of immigration on labor market opportunities will be relatively small when spatial correlations are calculated at the city level.”23 In other words, the movement of people and capital between areas of the country in response to immigration will tend to equalize differences in wages or employment between high- and low-immigrant areas.
The migration decisions of immigrants themselves might also be influenced by differences in employment opportunities across localities. All other things being equal, immigrants can be expected to settle in high-employment-growth areas. This tendency would mask the effect of immigration at the local level. It could still mean that immigration is negatively impacting natives, but the effect is spread across the country and not confined to higher-immigration localities. If that is correct, cross-city or cross-state comparisons will tend to understate the impact of immigration. Although teenagers normally live with their parents and thus do not move as easily as other workers, the movement of adult workers, capital, and the settlement decisions of immigrants themselves may still create labor market equilibrium across localities.
The second problem with comparing differences across the country is that the public-use file of the Current Population Survey used in this study does not really allow for cross-city comparisons. Local labor markets, such as metropolitan areas, are not identified in the data. So even if the potential problems with cross-city comparisons are ignored such an analysis cannot really be done with the available data. States can be compared, but they are a very imperfect approximation of a labor market and their number is limited to just 51, if the District of Columbia is included. Even with these limitations, comparisons across the country may still provide some insight into the impact of immigration.
State Differences. Table 1 examines differences across states in the share of their labor forces comprised of immigrants and the labor force participation of U.S.-born teenagers. The first column in Table 1 reports the share of each state’s (including the District of Columbia) labor force that is comprised of immigrants in 1994-1995. (We combine two years of data to get more statistically robust estimates for smaller states.24) The second column shows the share of U.S.-born teenagers in the state who are in the labor force in 1994-95. Columns three and four show the same information for 2006-2007. So, for example, in Nevada immigrants were 12.5 percent of the labor force in 1994-95 and in 2006-2007 they were 24.1 percent — an 11.8 percentage-point increase. At the same time, the share of U.S.-born teenagers who were in the summer labor force in Nevada fell dramatically, from 71.5 percent to 46.6 percent — a 24.9 percentage-point decline. The last two columns in the Table 1 simply report the percentage-point change in the immigrant share of the labor force and the change in the share of U.S.-born teenagers who were in the labor force. The states are ranked based on the percentage-point increase in the immigrant share of their labor force from 1994-95 to 2006-07. This means that the states at the top of the table should be those in which the impact of immigration is largest over this time period.
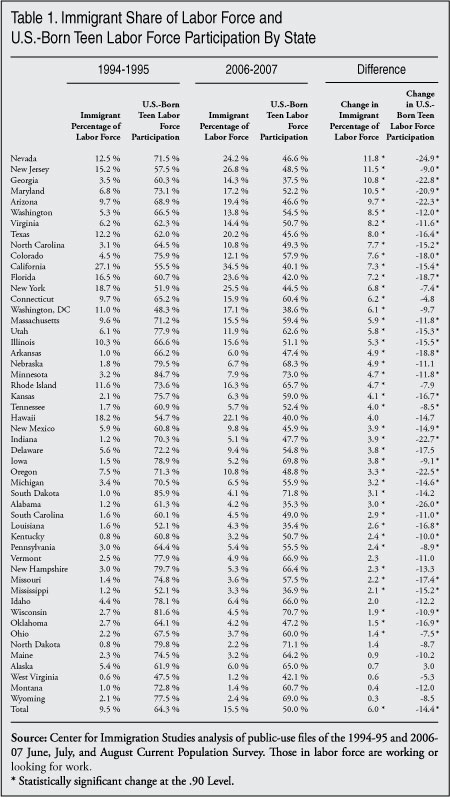
The table does show that, in general, states with large immigrant populations in 1994-95 or 2006-2007 tended to have lower teenage labor force participation. In 1994-95 in the 10 states where immigrants were the largest share of the labor force, teen labor force participation averaged just 60.2 percent, compared to 67.2 percent in the 10 states where immigrants are the smallest share of the labor force. For 2006-07 in the top-10 immigrant states, 44.5 percent of U.S.-born teenagers were in the labor force compared to 58.4 percent in the lowest-10 immigrant states. In both time periods, a smaller fraction of U.S.-born teenagers worked or looked for work in areas of very high immigrant settlement.
If we compare the increase 1994-95 to 2006-07 we see a similar pattern. Table 1 shows that in the 10 states with the largest increase in the immigrant share of the labor force, teenage summer labor force participation declined 17.3 percentage points on average. In the 10 states with the smallest increase in the immigrant share of the labor force, the labor force participation rate of U.S.-born teenagers declined 8.9 percentage points on average. While all the states with large increases in the immigrant share of the labor force saw significant fall-off in teenage labor force participation, there are a number of states with large employment declines that did not have large increases in their immigrant populations. Given the limitations of state comparisons discussed at the outset of this section, it may not be too surprising that some states are outliers to the overall pattern. Without question, where immigrants increased the most the share of U.S.-born teenagers working or looking for work in the summer typically declined the most. But the state comparisons indicate that immigration is not the only factor that explains the fall-off in labor force participation among American teenagers.
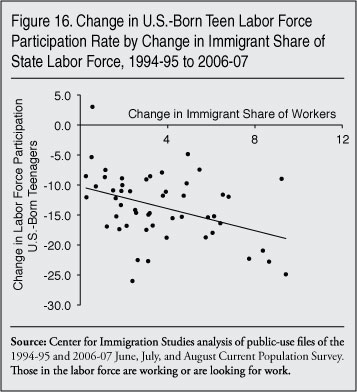
A more systematic way of examining the possible relationship between immigration and teen labor force participation is the scatter plot shown in Figure 16. The horizontal axis is the percentage-point increase in the immigrant share of the labor force by state and the vertical axis is the percentage-point change in the share of teenagers in the labor force. (These are the last two columns in Table 1.) The trend line shows the relationship between the two. Increases in the immigrant share of the labor force are clearly associated with a decline in the share of U.S.-born teenagers in the labor force.
A Statistical Model
It is possible to compare the immigrant share of each state’s labor force and labor force participation of U.S.-born teenagers while controlling for several other factors at the same time. We use the following OLS regression models to examine the impact of immigrants on labor force participation among U.S.-born teenagers:
Model I:
TL = a + b1(PI) + b2(AA) b3(R) + e
Model II:
CTL = a + b1(CPI) + b2(CAA) + b3(ILF) + b4(CSE) + b5(R) + e
The first regression is a simple cross-sectional comparison where TL is the percentage of U.S.-born teenagers in the labor market in each state at one point in time, PI is the percentage of the state’s labor force that is immigrant, AA is the share of the state’s U.S.-born teenagers who are African American, and R is the region of the country coded as dummy variables with the South as the comparison region. We do this cross-state comparison for both 1994-95 and 2006-07. The second regression model examines changes 1994-95 to 2006-07 by state. CTL is the change in the percentage of U.S.-born teenagers who are in the labor market, CPI is the change in percentage of each states’ labor force that is comprised of immigrants, CAA is the change in percentage of the state’s U.S.-born teenage population that is African American, ILF is the initial labor force participation rate of teens in 1994-95, CSE is the change in the share of U.S.-born teenagers enrolled in school, and R is the region of the country coded as dummy variables with the South as the comparison region.
Impact of Immigration on Teen Labor Force Participation. The left side of Table 2 reports the results of the cross-sectional (Model I) regression for both time periods, 1994-95 and 2006-07. The model shows that as the African American share of a state’s teenage population increases, labor force participation is lower. Most of the regional variables in Model I are also statistically significant. In terms of the impact of immigrants, Model I indicates that the larger the immigrant share of the labor force in the state, the lower the labor force participation rate of U.S.-born teenagers. This is true both in 1994-95 and 2006-07. On average, a 10 percentage-point increase in the immigrant share of the labor force reduces the labor force participation rate of U.S.-born teenagers by 5.79 percentage points in 1994-95 and 4.57 percentage points in 2006-07. In 1994-95 immigrants were already 10 percent of the nation’s labor force and in 2006-07 immigrants were almost 16 percent of the nation’s total labor force. In seven states they were more than 20 percent of the labor force in 2006-07. Model I indicates that the impact of immigration is likely to be quite large in these states. In fact, a number of states with large immigrant populations also account for a large fraction of the nation’s U.S.-born teenagers, including California, Texas, New York, Florida, and New Jersey.
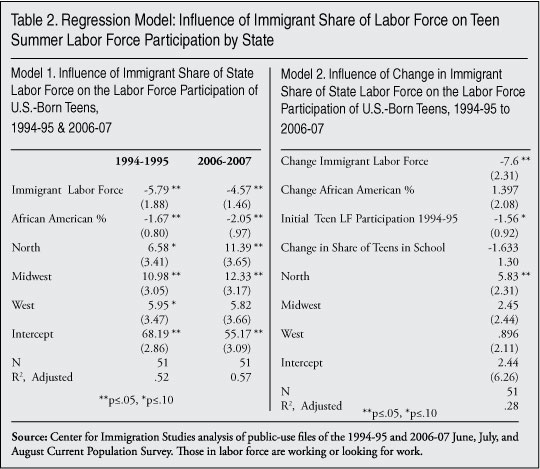
Unlike the comparison at one point in time in Model I, Model II on the right side of Table 2 reports the impact of change in the percentage of the labor force comprised of immigrants between 1994-95 and 2006-07. This may better test the effects of immigration than Model I because in Model II each state is being compared to itself over time rather than to other states at the same point in time. The increase in the African American share of the teenage population in a state is not statistically significant, but the initial labor force participation rate of U.S.-born teenagers in 1994-95 is significant. Model II shows that a 10 percentage-point increase in the immigrant share of a state’s labor force between 1994-95 and 2006-7 reduced the labor force participation rate of U.S.-born teenagers by 7.60 percentage points. The results in Model II indicate that, even after controlling for several factors, the impact of immigration is substantial. Interestingly, the increase in the share of teens enrolled in school does not have a statistically significant impact on teen labor force participation.25
While studies of adult native-born workers have generally not found large employment effects, a new study of younger teenagers by an economist at the Federal Reserve shows results that parallel our own.26 Our findings also are consistent with a study of 16- to 24-year-olds done in 2006.27 Overall, the results from our OLS regressions are consistent with the few studies that have focused on the younger workers and show that the impact from immigration is large and negative.
Why Immigration Impacts Teenagers. By increasing the supply of labor (workers), immigration should reduce wages, all other things being equal. As wages fall fewer U.S.-born teenagers will offer themselves on the labor market. Economists refer to this as the elasticity of supply. There is research showing that a 10 percent increase in the supply of workers from immigration reduces the weekly wages of U.S.-born workers by 4.5 percent and annual earnings by 8 percent.28 The decline in labor force participation we report from immigration is quite large and implies that the wage impact of immigration is larger than 4.5 to 8 percent. On the other hand it may be that teenage employment is more sensitive to a decline in wages than is the employment of other workers, so the elasticity of supply could be much larger than it is for workers in general. Economists talk of potential workers having a “reservation wage.” That is, a wage below which they will not work. Since most teenagers live with their parents and generally do not have to work, it is likely that their reservation wage is different from that of other workers, making their employment much more sensitive to a decline in wages.
It is possible that immigrants who compete with U.S.-born teenagers are willing to work for substantially less. While evidence that immigrants work for significantly less than U.S.-born Americans is mixed, if it does happen it would reduce wages more than might be expected just from their increasing the supply of workers.29 That is, immigrants do the same jobs for less and pull wages down more than they would simply by increasing the supply of workers. If immigrants work for less it may also help them out-compete U.S.-born teenagers for jobs, making them more desirable workers from an employer’s perspective.
Social networks are an important way in which to think about the labor market. All workers, especially teenagers, often find work through their family and friends. However, immigrant social networks may be supplanting those that once supplied employers with teenage workers in the summer. Consider the example of an employer who used to rely on friends, family, a local minister, and school guidance counselors to find “good kids” each summer to fill his seasonal jobs. But after hiring a few immigrants one year he then comes to rely on their social networks to fill his summer jobs. American teenagers would still take the jobs at the current wages, but now never even hear about them. In the old system the employer proactively recruited workers, but now his recruitment is largely done for him by immigrants. Since this may simplify his hiring practices, it is easy to understand why business might find this situation desirable.
Also consider the example of a teenager who would be willing to work in what is now an immigrant-heavy occupation, but feels unwelcome because he does not speak the language of the immigrants who comprise a growing share of the occupation’s workers. There is also the question of expectations and values. If fewer and fewer members of one one’s peer group work, then over time not working each summer seems normal to the teenagers themselves and to their parents. The arrival of immigrants and their increasing use by employers may shape the views of U.S.-born teenagers and their families with regard to work.
In our view, the most important reason immigrants (legal and illegal) displace teenagers (U.S.-born or foreign-born), is that immigrants are overwhelmingly much older than 20 years of age. During the summer of 2007 in the 10 occupations employing the most U.S.-born teenagers, just 6 percent of the immigrants were teenagers, the rest being 20 years of age or older. In the top-15 teenage occupations, just five percent of the immigrant workers are teenagers. It may be very difficult for U.S.-born teenagers, especially younger teenagers who are 16 or 17, to compete with mature immigrant workers who have much more work experience.
What’s more, teenagers typically have school schedules and extracurricular actives that employers have to work around. With adult immigrants, employers do not have to deal with this problem, which may also make them preferred workers. While not the focus of this report, teenage immigrants, like their U.S.-born counterparts, have also had great difficulty in the labor market. The labor force participation of immigrant teenagers, already low at 46.4 percent in 1994 declined to 38.6 by 2007. This supports the idea that the arrival of so many adult immigrants, who work at the kinds of jobs traditionally done by teenagers, crowds all teenagers out of the labor force.
Conclusion
The findings of this study indicate that the teenage labor force participation and employment rate of U.S.-born teenagers (16 to 19) in the summer has declined dramatically over the last decade and a half. This decline pre-dates the current economic downturn. While the decline was particularly steep between 2000 and 2007, even in the 1990s during the economic expansion teenage summer labor force participation declined. The teenage summer labor force participation rate — those working or looking for work — declined from 64 percent in 1994 to 48 percent by 2007. The number of U.S.-born teenagers not in the labor force during the summer increased by 3.4 million from 1994 to 2007.
The decline in teenage employment may not seem particularly worrisome to some. However a significant number of teenagers live in or near poverty, and by working they could help their families. Perhaps more important, a large and growing body of research indicates that it is as a young person that workers develop the skills and habits necessary to function in the labor market. Poor work habits and weak labor force attachment developed as a teenagers can follow a person throughout life. Those who do not work as teenagers earn less and work less often later in life than those who were employed in their teenage years. This is especially the case for those who do not go on to get more education after high school.
The decline in teenage summer employment has impacted teenagers from every segment of society. The fall-off is similar for white, black, and Hispanic teens. It is similar for older teens and younger teens. The decline has impacted high school dropout teens and those who attend college. The decline for teenagers from the highest-income households is similar to the decline for teenagers from the lowest-income households. The deterioration in employment is also similar for those enrolled in summer school and those who are not enrolled. The extremely broad nature of this decline has two important implications: First, it is clear that the decline was not due to teenagers from affluent families no longer working because their parents provide them with everything they need or want. Second, the broad nature of the decline is an indication that changes in the U.S. labor market rather than some change in the composition or characteristics of the teenagers themselves has created this phenomenon.
Businesses have repeatedly argued that there are not enough seasonal workers. It is very difficult to reconcile the decline in teen employment with the contention that seasonal workers are not available. If seasonal workers were in short supply, the share of teenagers in the labor force would have increased significantly, not fallen dramatically. Perhaps the needs of seasonal employers have changed in some fundamental way that teenagers can no longer satisfy. But it is hard to see what changes have taken place since the early 1990s or even since 2000 in the nature of seasonal food service, cleaning, retail, construction, and child care jobs that traditionally have employed most teenagers.
There is good evidence that immigration accounts for a significant share of the decline in teenage summer labor force participation. In many of the occupations where teenage employment declined the most, immigrants made significant job gains. Comparisons across states in 2007 show that in the 10 states where immigrants are the largest share of workers, just 45 percent of U.S.-born teens were in the summer labor force in 2007, compared to 58 percent in the 10 lowest-immigration states. Looking at change over time shows that for every 10 percentage-point increase in the immigrant share of a state’s labor force between 1994-95 and 2006-07, the summer labor force participation rate of U.S.-born teenagers declined almost eight percentage points. Our results are similar to two studies that have estimated the impact of immigration on teenage employment, including a newly published working paper from the Washington, D.C., Federal Reserve.
The decision to allow in large numbers of legal immigrants (temporary and permanent) and to tolerate large-scale illegal immigration and turn away from employing U.S.-born teenagers may be seen as desirable by some businesses. However this policy choice may have significant long-term consequences for American workers as they enter adulthood, especially those who do not go on to college. As non-work and idleness become the norm for more Americans after they leave their teenage years, there may be significant negative consequences for society. The potential impact of continued large-scale immigration on teenagers is something that should be considered when formulating immigration policy in the future.
Appendix
End Notes
1 The Chamber’s position on immigration can be found in “Immigration and Labor: Policy Positions and Activities,” at http://www.uschamber.com. The policy positions of EWIC can be found at http://www.ewic.org//index.php?option=com_content&task=view&id=15&Itemid=52.
2 Between 1994 and 2008, an average of 914,000 green cards were issued annually. See Table 1 in Yearbook of Immigration Statistics: 2008, http://www.dhs.gov/xlibrary/assets/statistics/yearbook/2008/ois_yb_2008.pdf. For estimates of the illegal immigrant population going back to 1980, see Figure 2 in “The Size and Characteristics of the Unauthorized Migrant Population in the U.S.,” Pew Hispanic Center, http://pewhispanic.org/files/reports/61.pdf.
3 Responding to the demands of employer pressure groups, in 2005 Congress passed a temporary provision to allow returning H-2B workers to be exempt from the cap from March 2005 to September 2007, allowing the program to significantly exceed the cap originally placed on it.
4 The number of H-2B and Q visas is reported in the State Department’s annual Report of the Visa Office, at http://travel.state.gov/visa/frvi/statistics/statistics_1476.html. These numbers represent the number of visas issued by consular officers overseas; it is possible that some of the individuals do not ever arrive or use the visa, but this number is estimated to be small. The source for the different categories of J-1 visas is the annual reports and annual program inventories of the Interagency Working Group on U.S. Government Sponsored International Exchanges and Training. These reports are published at http://www.iawg.gov/reports/annual/. These numbers are derived from the Department of Homeland Security’s Student and Exchange Visitor Information System (SEVIS). The SEVIS Office provides the Working Group with a count of all students and exchange visitors who participated in an exchange as of September 30 each year.
5 Figures are from the 2008 public-use file of the American Community Survey, which asks all women over age 16 if they have given birth in the last year.
6 Figures are based on the 2007 Current Population Survey, Annual Social and Demographic Supplement, which is the primary source for poverty statistics. Low-income is considered less than 200 percent of the poverty threshold.
7 “The Projected Summer 2007 Job Outlook for the Nation’s Teens and the Implications of Summer Employment for Jobs for America’s Graduates’ Programs.” Paper Prepared for the Jobs for America Graduates. Alexandria VA, April 2007, p. 20, at www.skillscommission.org/pdf/commissioned_papers/Education%20and%20Labor.... For a more extensive review of many of the problems created by young people not working, see Confronting the Youth Demographic Challenge: The Labor Market Prospects of At Risk Youth, Sar Levitan Center for Social Policy Studies, Baltimore, 2000.
8 Rich, Lauren M. (1996), “The Long-Run Impact of Teenage Work Experience: A Reexamination,” The Review of Black Political Economy, 25(2), 11-36.
9 Leventhal, T., Graber, J. A., & Brooks-Gunn, J. (2001), “Adolescent Transitions to Young Adulthood: Antecedents, Correlates, and Consequences of Adolescent Employment,” Journal of Research on Adolescence, 11(3), 297-323.
10 Ruhm, Christopher J. (1997), “Is High School Employment Consumption or Investment?” Journal of Labor Economics, 15(4), 735-776. Ruhm, Christopher J. (1995). “The Extent and Consequences of High School Employment.” Journal of Labor Research, 16(3), 293-303.
11 Mortimer, J. T., Vuolo, M., Staff, J., Wakefield, & S., Xie, W. (2008), “Tracing the Timing of ‘Career’ Acquisition in a Contemporary Youth Cohort,” Work and Occupations, 35(1), 44-84.
12 Carr, R., Wright, J. D., & Brody, C. J. (1996), “Effects of High School Work Experience a Decade Later: Evidence from the National Longitudinal Survey,” Sociology of Education, 69(1), 66-81.
13 Table A.3 in the Appendix shows labor force participation and employment rates for U.S.-born teenagers in just the month of July from 1994 to 2009. The trends are the same as they are in the other figures in this report for the three months of June, July, and August.
14 See Table 2 in “Estimates of the Unauthorized Immigrant Population Residing in the United States: January 2009,” at http://www.dhs.gov/xlibrary/assets/statistics/publications/ois_ill_pe_20.... DHS estimates use the American Community Survey, which like the Current Population Survey used in this report, is collected by the Census Bureau. The data in both cases are weighted in a similar fashion, so the results are similar.
15 The 1989 CPS for June, July, and August shows a labor force participation rate of 68.1 percent and an employment rate of 58.4 percent for all (immigrant and native) non-Hispanic teenagers. As already discussed, immigrant and native-born Americans cannot be distinguished in the CPS prior to 1994. However, the 1990 Census, which does distinguish immigrants and natives, shows that only 3.8 percent of all non-Hispanic teenagers in the country were immigrants. Although we cannot separate out immigrants and U.S.-born teenagers from the 1989 data, we are confident that the figures reported above come very close to the actual rates for U.S.-born teenagers in 1989.
16 The Census Bureau data re-weighted after the 2000 Census revealed that the weights being used in 1990 were slightly off. New weights were issued in 2002 for 2001 and 2000. This means that there is some break in the continuity of the data between 1999 and 2000 if the new weights are used. In this report we use the revised weights for 2000 to 2001. (There are no revised weights for 1994 to 1999.) The impact on the size of the U.S.-born teenage population using the original weights versus the revised weights is trivial. The new weights reduce the size of the U.S.-born teenage population by just 1.5 percent. Thus the growth in the number of U.S.-born teenagers not in the labor force may be slightly understated, though the effect is not meaningful. The percentage employed or not in the labor force or unemployed are impacted even less by the change in weights because the employed, unemployed, and those not in the labor force are all re-weighted.
17 Starting in 2003, respondents to the CPS were allowed to choose more than one race. This was done so that the CPS would match the new race question on the 2000 Census. This change should not significantly impact the percentages for white and black teens reported in Figures 1 through 5, but it could impact the totals slightly. Hispanics are unaffected by the change because being Hispanic is determined by a different question that has not changed substantially over this time period.
18 Because Figure 9 examines only 19-year-olds the sample is much smaller, resulting in more sampling variability. This causes the numbers to change more than in the other graphs. If we compare the decline from 1994 to 2007, we find a decline of eight percentage points for 19-year-old dropouts and 12 percentage points for 19-year-olds with some college. This might support the idea that unpaid internships account for some of the decline. But if we compare 1995 to 2007 we find that labor force participation fell 14 percentage points for dropouts, while declining 13 percentage points for those with some college. The decline is also larger for dropouts from 2000 to 2007. Thus, sampling variability due to smaller sample size seems to explain the results for 1994 to 2007. Overall, Figure 9 shows that the decline in labor force participation is very similar for U.S.-born 19-year-old high school dropouts and 19-year-olds who have attended college.
19 See for example, Anthony Paletta, “The Internship Racket” in Inside Higher Education, at www.insidehighered.com/views/2008/02/19/paletta. Also see, “America’s New Glass Ceiling: Unpaid Internships, the Fair Labor Standards Act, and the Urgent Need for Change,” by Jessica Curiale in Hasting Law Journal, June 2010. Also a forthcoming study from the Economic Policy Institute, Unpaid and Unfair: Financing Internships for Low-income Students, makes the case that low-income students often cannot afford to take unpaid internships and that they are in effect only for the children of affluent parents. http://www.epi.org/.
20 Roughly two-thirds of immigrants employed in the 10 occupations employing the most teenagers had no more than a high school education in both 1994 and 2007.
21 In the summer of 1994, U.S.-born teenagers were 7.8 percent of all working-age (16 to 65) people in America. This includes all immigrants and all native-born Americans. In 2007 and 2009, they were 7.9 percent.
22 For example, immigrants may settle in what has traditionally been a high-employment-growth city like Los Angles. This in turn may reduce the number of native-born Americans moving to that city from low-employment-growth areas like Pittsburgh. By staying put, Pittsburgh workers increase the supply of labor above what it would otherwise have been had immigrants not arrived in Los Angles. Moreover, if immigration reduces wages in L.A., native-born workers may leave that city and increase the supply of workers in another community. In this way the arrival of immigrants in one city may impact the labor market of many cities, even those with few immigrants. The argument that immigration may reduce the net in-migration of less-educated natives is most associated with the work of William Frey. See William H. Frey, “Immigration and Internal Migration ‘Flight’ from U.S. Metropolitan Areas: Toward a New Demographic Balkanisation,” Urban Studies, 32 (4-5), pp. 733-757, 1995; and William H. Frey, Immigration and Domestic Migration in U.S. Metro Areas: 2000 and 1990 Census Findings by Education and Race, Research Report 05-572, Population Studies Center, 2005.
23 Page 231 in The New Americans: Economic, Demographic, and Fiscal Effects of Immigration, 1997, James P. Smith and Barry Edmonston, eds., National Academies Press.
24 Since figures for each year are for the three summer months, our two-year estimates are actually based on six months of data, making for robust estimates.
25 Since we have only 51 states (including the District of Columbia) that can be compared, we are limited in the number of variables that can be included in the models. Thus, other factors that may impact teenage labor force participation may not be included in the model. But both models indicate a significant impact from immigration on the labor force participation rate of U.S.-born teens.
26 See Christopher L. Smith, “The Impact of Low-Skilled Immigration on the Youth Labor Market,” Finance and Economics Discussion Series, Divisions of Research & Statistics and Monetary Affairs, Federal Reserve Board, Washington, D.C. http://www.federalreserve.gov/Pubs/Feds/2010/201003/201003pap.pdf.
27 See Sum, Andrew, et al.,“The Impact of New Immigrants on Young Native-Born Workers, 2000-2005,” http://www.cis.org/sites/cis.org/files/articles/2006/back806.pdf.
28 See Borjas, George J. “The Labor Demand Curve Is Downward Sloping: Reexamining the Impact of Immigration on the Labor Market,” The Quarterly Journal of Economics, November 2003. For a less technical version of the paper, see “Increasing the Supply of Labor Through Immigration: Measuring the Impact on Native-Born Workers,” April 2004, at: http://www.cis.org/node/238.
29 Simple comparisons of the wages of immigrants and native-born workers by age and education do not show large differences. In the summer of 2009, for example, looking at the average hourly wages of immigrants (20 to 29 years of age) who did not graduate high school, shows they earned 93 percent as much as the average native-born American with the same education. It is also 93 percent for immigrants with only a high school education (ages 20 to 29). This comparison does not account for the limited knowledge of English of many immigrants. Immigrants do earn significantly less than natives on average overall, but this primarily reflects the fact that a much larger share of immigrants than natives have relatively little education. On illegal immigration in particular the best research shows that wages for those legalized by the 1986 amnesty rose 6 percent within a few years as a result of the legalization. While not a huge difference, this could give illegal immigrants an advantage over U.S.-born teenagers. See Sherrie A. Kossoudji and Deborah A. Cobb-Clark, “Coming Out of the Shadows: Learning about Legal Status and Wages From the Legalized Population,” Journal of Labor Economics, vol. 20, no. 3, July 2002: 598-628. Francisco L. Rivera-Batiz argues that the difference may be larger; see, “Undocumented Workers in the Labor Market: An Analysis of the Earnings of Legal and Illegal Immigrants in the U.S.,” Journal of Population Economics, February 1999.