Download a PDF of this Backgrounder.
A Center for Immigration Studies (CIS) analysis of newly released data from the Census Bureau's American Community Survey (ACS) shows that 1.5 million new immigrants (legal and illegal) are settling in the country each year. The ACS is the Bureau's largest survey and the new findings confirm research published by the Center in June of this year based on a much smaller Bureau survey, which also showed a significant increase in new arrivals in 2014 and 2015.1 Newly arrived immigrants include new green card holders (permanent residents); long-term "temporary" visitors who often stay permanently, such as guest workers and foreign students; and new illegal immigrants.
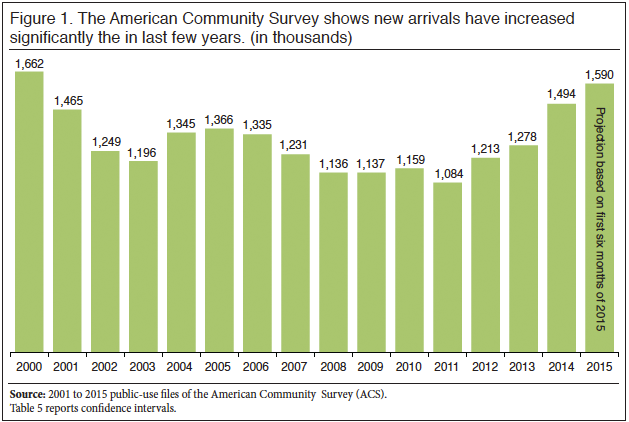
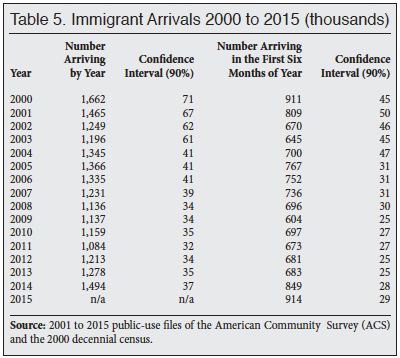
- The just-released public-use data from the American Community Survey shows 1.5 million new immigrants (legal and illegal) arrived in 2014, and another 914,000 arrived in just the first six months of 2015.
- Between three-fourths and two-thirds of the 1.5 million new immigrants settling in the country are legal immigrants, including permanent residents as well as long-term visitors (e.g. guest workers and foreign students). The remainder are new illegal immigrants.
- Data released thus far for the first six months of the year indicate that new arrivals may have reached 1.6 million in 2015.2
- The number who arrived in 2014 represent a 17 percent increase over the number who came in 2013, and a 38 percent increase over the number who came in 2011.
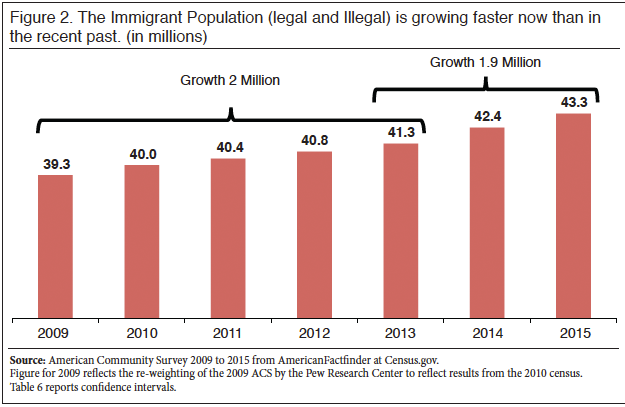
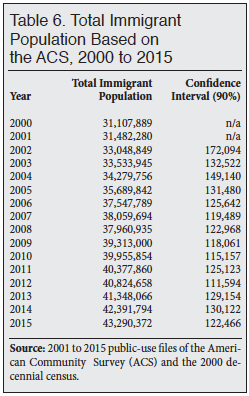
- The overall immigrant population grew about twice as fast in the last two years as it did in the prior four years.3 The 1.9 million increase in the immigrant population in just the last two years almost equals the two million growth in the four-year period from 2009 to 2013.
- It is important to note that arrivals are offset by those immigrants who leave the country each year and by normal mortality of about 300,000 annually among the existing immigrant population.4 Therefore, growth in the overall immigrant population is less than new arrivals.
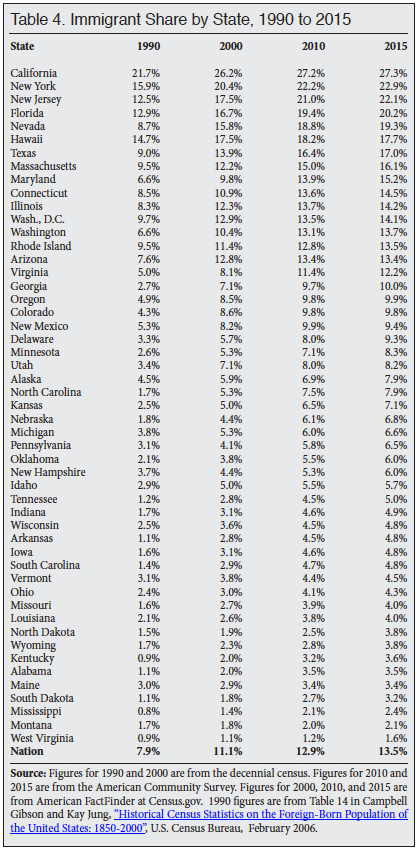
- As a share of the U.S. population, 13.5 percent are now immigrants — the highest percentage in 105 years. As recently as 1970, less than 5 percent of the population were immigrants.
- Based on current trends and Census Bureau projections, the immigrant share of the population will surpass the highest level in American history seven years from now.5
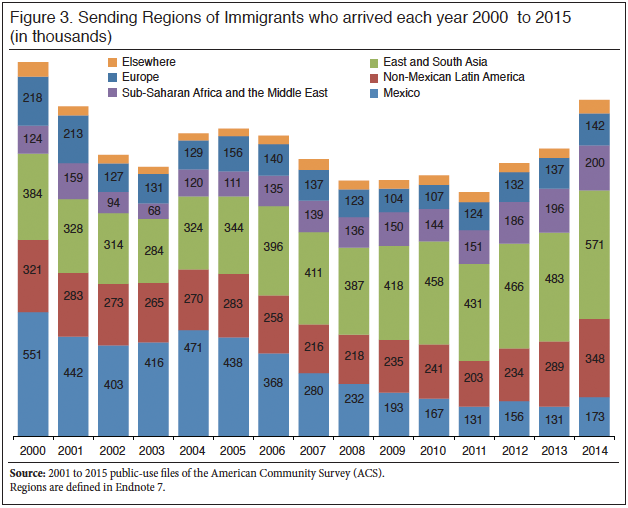
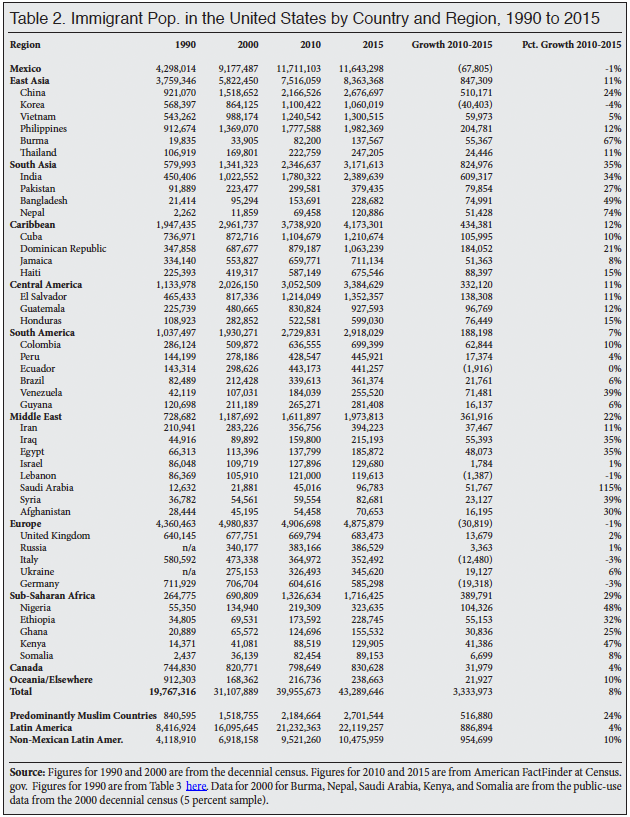
- Sending regions with the largest numerical increases in immigrants living in the United States since 2010 were East Asia (up 847,000), South Asia (up 825,000), the Caribbean (up 434,000), Sub-Saharan Africa (up 390,000), the Middle East (up 362,000), and Central America (up 332,000). The number of European immigrants declined by 31,000.6
- Major sending countries with the largest numerical increases in immigrants living in the United States since 2010 were India (up 609,000), China (up 510,000), the Philippines (up 205,000), the Dominican Republic (up 184,000), El Salvador (up 138,000), Cuba (up 106,000), Nigeria (up 104,000), Guatemala (up 97,000), Haiti (up 88,000), Pakistan (up 80,000), Honduras (up 76,000), Bangladesh (up 75,000), Venezuela (up 71,000), Colombia (up 63,000), Vietnam (up 60,000), and Iraq (up 55,000).
- Major sending-countries with the largest percentage increases in immigrants living in the United States since 2010 were Saudi Arabia (up 115 percent), Bangladesh (up 49 percent), Nigeria (up 48 percent), Egypt and Iraq (each up 35 percent), India (up 34 percent), Ethiopia (up 32 percent), Pakistan (up 27 percent), Ghana (up 25 percent), the Dominican Republic (up 21 percent), Honduras (up 15 percent), Guatemala and the Philippines (each up 12 percent), and Iran (up 11 percent).
- After the Great Recession began in 2007, 9.4 million new immigrants settled in the country from 2008 to 2015.7 This is a reminder that even though the U.S. economy experienced a prolonged recession and historically weak economic growth, the United States remains an attractive place for immigrants to settle.
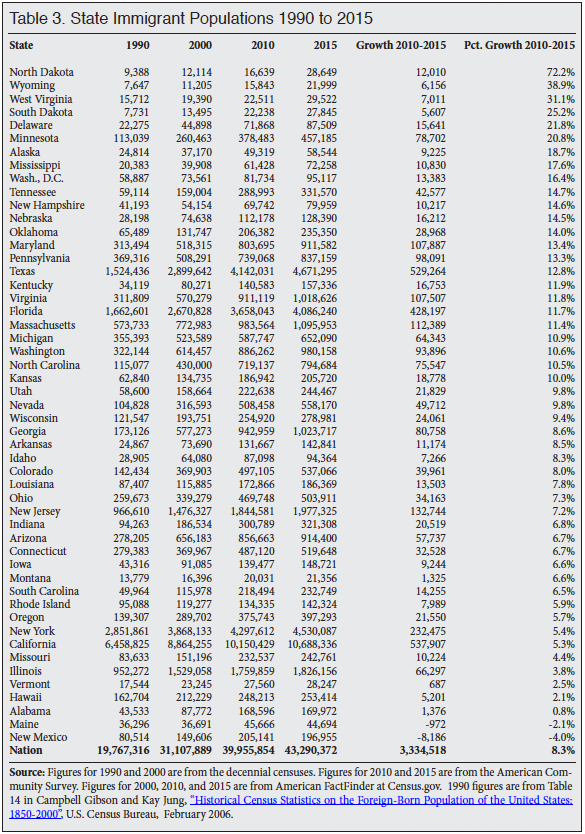
- States with the largest numerical increases in the number of immigrants from 2010 to 2015 were California (up 538,000), Texas (up 529,000), Florida (up 428,000), New York (up 232,000), New Jersey (up 133,000), Massachusetts (up 112,000), Maryland (up 108,000), Virginia (up 108,000), Pennsylvania (up 98,000), Washington (up 94,000), Georgia (up 81,000), Minnesota (up 79,000), and North Carolina (up 76,000).
- States with the largest percentage increases in the number of immigrants from 2010 to 2015 were North Dakota (up 72 percent), Wyoming (up 39 percent), West Virginia (up 31 percent), South Dakota (up 25 percent), Delaware (up 22 percent), Minnesota (up 21 percent), Alaska (up 19 percent), Mississippi (up 18 percent), Tennessee and New Hampshire (each up 15 percent), Nebraska and Oklahoma (each up 14 percent), and Maryland, Pennsylvania, and Texas (each up 13 percent).
Data Source. On October 20, 2016, the Census Bureau released the public-use data from the 2015 American Community Survey (ACS). The survey reflects the U.S. population as of July 1, 2015. The ACS is by far the largest survey taken by the federal government each year and includes over two million households.8 Several weeks ago, the Census Bureau posted some of the results from the ACS to its American FactFinder system.9
The immigrant population, referred to as the foreign-born by the Census Bureau, are those individuals who were not U.S. citizens at birth. It includes naturalized citizens, legal permanent immigrants (green card holders), temporary workers, and foreign students. It does not include those born to immigrants in the United States, including to illegal immigrant parents, nor does it include those born in outlying U.S. territories such as Puerto Rico. Prior research by the Department of Homeland Security and others indicates that some 90 percent of illegal immigrants respond to the ACS.10 Thus all the figures reported above are for both legal and illegal immigrants.
End Notes
1 Steven Camarota, "New Data: Immigration Surged in 2014 and 2015; More than three million legal and illegal immigrants settled in the United States in the last two years" , Center for Immigration Studies, June 2016.
2 The ACS for each year is weighted to reflect the population as of July 1. As such, it only reports arrival data for the first six months when it is released each year. When the next ACS is released the following year, it reports the number of arrivals for the entire prior year. So, for example, the 2014 ACS showed 849,000 new arrivals in the first six months of that year and the just-released 2015 ACS shows 1.494 million arrivals for all of 2014. In recent years the ratio of arrivals from the first six months of the year to the number shown for the entire year when the next year's ACS is released is 1.74. The 2015 ACS shows that 914,000 immigrant arrived in the first six months of 2015. Therefore, we project that when the 2016 ACS is released it will show 1.59 million new arrivals for all of 2015.
3 The new data indicates that growth in the immigrant population is accelerating. Between 2009 and 2013 growth averaged 509,000 a year, but between 2013 and 2015 it grew by 971,000 a year.
4 Based on analysis done by the Center for Immigration Studies and Decision Demographics, we estimate that the death rate among the foreign-born is 7.63 deaths per thousand. This translates into 323,000 deaths among the existing immigrant population between 2014 and 2015.
5 Historical numbers from the decennial censuses can be found at the Census Bureau's website. They show that, in 1890, the foreign-born or immigrant share reached 14.77 percent of the U.S. population and fell for a time, but again reached 14.70 percent in 1910. These two figures represent the highest share ever recorded. Table 2 of the Census Bureau projections published in 2014 show that the foreign-born will reach 14.79 percent of the U.S. population in 2023, making it the highest percentage ever recorded. The Census Bureau projected that the foreign-born population would be 13.5 percent of the U.S. population in 2015, matching the results from what the 2015 ACS shows. This is an indication that, at least so far, the United States is on track to set a new record in the share of the population that is comprised of immigrants in just seven years.
6 Countries that can be identified in the public-use 2015 ACS file are coded as the following regions: Mexico; Central America: Belize, Costa Rica, El Salvador, Guatemala, Honduras, Nicaragua, and Panama; South America: Argentina, Bolivia, Brazil, Chile, Colombia, Ecuador, Guyana, Paraguay, Peru, Uruguay, Venezuela, and South America not specified; Caribbean: Bermuda, Cuba, Dominican Republic, Haiti, Jamaica, Antigua-Barbuda, Bahamas, Barbados, Dominica, Grenada, St. Lucia, St. Vincent, Trinidad and Tobago, and Caribbean and West Indies and Americas not specified; South Asia: India, Bangladesh, Pakistan, Sri Lanka, Bhutan, and Nepal; East Asia: China, Hong Kong, Taiwan, Japan, Korea, Cambodia, Indonesia, Laos, Malaysia, Philippines, Singapore, Thailand, Vietnam, Burma, Asia not specified; Europe: Denmark, Finland, Iceland, Norway, Sweden, England, Scotland, United Kingdom, Ireland, Belgium, France, Netherlands, Switzerland, Albania, Greece, Macedonia, Italy, Portugal, Azores, Spain, Austria, Bulgaria, Czechoslovakia, Slovakia, Czech Republic, Germany, Hungary, Poland, Romania, Yugoslavia, Croatia, Bosnia, Serbia, Montenegro, Cyprus, Latvia, Lithuania, Byelorussia, Moldova, Ukraine, Armenia, Georgia, Russia, USSR not specified, and Europe not specified; Middle East: Afghanistan, Azerbaijan, Kazakhstan, Uzbekistan, Iran, Iraq, Israel/Palestine, Jordan, Kuwait, Lebanon, Saudi Arabia, United Arab Emirates, Syria, Turkey, Yemen, Algeria, Egypt, Morocco, Libya, Sudan, and North Africa not specified; Sub-Saharan Africa: Cape Verde, Ghana, Guinea, Liberia, Nigeria, Senegal, Sierra Leone, Ethiopia, Kenya, Somalia, Tanzania, Uganda, Zimbabwe, Eritrea, Cameroon, South Africa, Zaire, Congo, Zambia, Togo, Gambia, and Africa and Western and Eastern Africa not specified; Canada; Oceania/Elsewhere: Australia, New Zealand, Fiji, Tonga, Marshall Islands, Micronesia, elsewhere. Predominately Muslim Countries includes the countries of the Middle East (excluding Israel) as well as Bangladesh, Pakistan, Somalia, Indonesia, and Malaysia.
7 Figure 1 reports the number of new arrivals by year including the first six months of 2015. As already discussed, the total immigrant population did not grow by this amount since 2008 because new arrivals are offset by those immigrants who return home or have died since 2008.
8 Detailed information on the survey methodology, questions and other information on the American Community can be found here.
9 The total population figures used in this analysis are from American Factfinder. However, only the public-use micro data from the ACS, which was posted on October 20, can be used to measure individual year of arrival as shown in Figures 1 and 3.
10 The Department of Homeland Security uses the ACS as the basis for its estimates of illegal immigrants. See their most recent estimate of the unauthorized immigrant population: Bryan Baker and Nancy Rytina, "Estimates of the Unauthorized Immigrant Population Residing in the United States: January 2012", U.S. Department of Homeland Security, Office of Immigration Statistics, March 2013.