Download a PDF of this Backgrounder
Steven A. Camarota is the director of research at the Center for Immigration Studies.
An analysis of new government data by the Center for Immigration Studies shows more than three million new legal and illegal immigrants settled in the United States in 2014 and 2015 — a 39 percent increase over the prior two years. The number of legal and illegal immigrants settling in the country is now higher than before the 2007 recession and may match the level in 2000 and 2001. Immigration from other countries has offset a decline in immigration from Mexico.
Several factors have likely contributed to the rebound, including cutbacks in enforcement, an improved economy, and the expansive nature of our legal immigration system (especially for long-term temporary visas such as guestworkers and foreign students).
Among the findings:
- New data collected by the Census Bureau shows that 3.1 million new immigrants (legal and illegal) settled in the country in 2014 and 2015, or more than 1.5 million annually.
- In 2012 and 2013, 2.3 million immigrants arrived, about 1.1 million annually. In 2010 and 2011, 2.1 million new immigrants arrived, about one million annually.
- All of the above numbers are based on publicly available information in Census Bureau data; no adjustments have been made for those missed by the bureau. But even without adjusting for undercount, the scale of new immigration is enormous.
- The big increase in new arrivals in the last two years was driven by a rise in immigration from Latin America, particularly countries other than Mexico; South Asia (e.g. Pakistan and India); and East Asia (e.g. China and Vietnam).
- Our preliminary estimate is that, of the 3.1 million immigrants who arrived in that last two years, about one-third, 1.1 million (or 550,000 annually) were new illegal immigrants, a significant increase from the 700,000 illegal immigrants (350,000 annually) who entered in 2012 and 2013.
- The above estimate of illegal immigration represents the flow of new illegal aliens surreptitiously crossing the border, overstaying a temporary visa, or released into the country after a short detention, such as families from Central America. The numbers do not represent the net increase in the total illegal immigrant population.
- The available evidence also indicates that the number of new legal immigrants, both temporary and permanent, arriving from abroad has increased. Our best estimate is that the arrival of legal immigrants increased about 30 percent, from 1.6 million in 2012-2013 to two million in 2014-2015.
Introduction
The Census Bureau conducts several large surveys that are representative of the U.S. population. These surveys are designed to provide data on the labor force and American society generally. The surveys include questions on citizenship, country of birth, and year of arrival in the United States. The survey released on the timeliest basis is the monthly Current Population Survey (CPS). The CPS conducted in the first quarter of 2016 shows that more than three million new immigrants arrived in 2014 and 2015, or nearly 1.6 million annually. This represents a large increase over the number of annual new arrivals from 2006 to 2013. The term "immigrant" refers to all persons who are not U.S. citizens at birth. The Census Bureau typically uses "foreign-born" to describe these individuals, and it includes naturalized U.S. citizens, legal immigrants, illegal immigrants, and long-term temporary visitors such as guestworkers and foreign students. There is research indicating that some 5 percent of the total immigrant population is missed by Census Bureau surveys.1
The monthly CPS indicates that the number now coming exceeds pre-recession levels and may match the levels seen from 1998 to 2001, when immigration last peaked. Census Bureau data is designed to capture both legal and illegal immigrants; and our preliminary analysis of the CPS indicates that both legal and illegal immigration are surging. Although not as up-to-date as the monthly CPS, both the American Community Survey, which represents the population through the middle of 2014, and the Annual Social and Economic Supplement of the CPS, collected in March 2015, both indicate that the level of new immigration into the United States has rebounded.
A Surge in New Arrivals
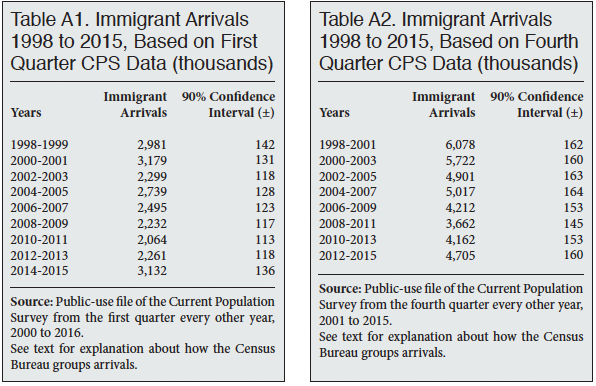
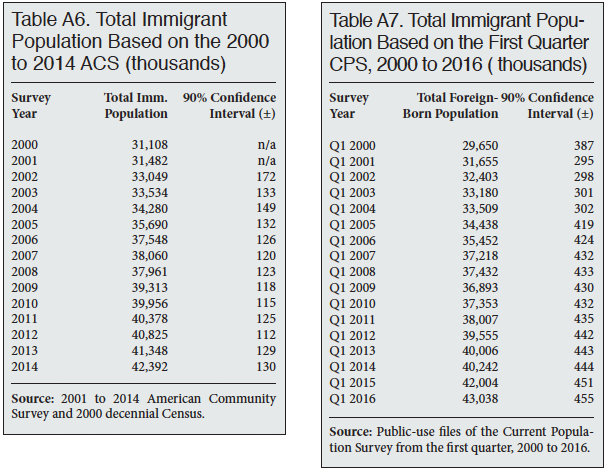
Monthly Current Population Survey. To preserve anonymity, the Census Bureau groups arrival data in the CPS data it releases to the public in three-year cohorts. (In odd-numbered years, the bureau groups arrival data in four-year cohorts.) The monthly CPS data for the first quarter of 2016 show 3.1 million immigrants living in the United States who indicated they came in 2014, 2015, or the very beginning of 2016.2 The CPS from the first quarter of 2014 shows 2.3 million new arrivals in 2012 and 2013, and the CPS from 2012 shows 2.1 million arrivals in 2010 and 2011. Figure 1 shows the number of new immigrants arriving in two-year increments based on the first quarter of even-numbered years from 2000 to 2016. The figure shows a substantial increase in 2014 and 2015 from prior years.
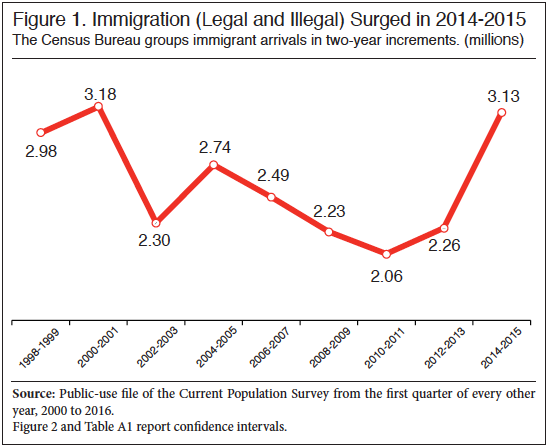
Figure 2 shows the margin of error on either side of the arrival numbers graphically. Table A1 in the appendix at the end of this report shows the margin of error around the arrival numbers from the monthly CPS. (A margin of error on either side of a number is referred to as confidence interval.) The confidence intervals make clear that the level of new immigration is higher than at any time since 2001, even taking into account statistical variation. That is, the difference between the number who came in the last two years and the number arriving from 2002 to 2013 is statistically significant. The difference between the number who arrived in the last two years and the number who came in 2012 and 2013 is 872,000 and represents a 39 percent increase. Compared to the 2010-2011 period, the last two years represent a 1.07 million increase, or 52 percent.
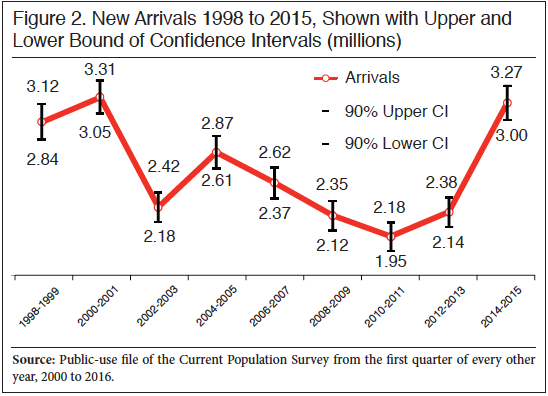
Table A2 in the appendix shows the number of new arrivals based on the fourth quarter of odd-numbered years. The odd-numbered years' arrival data is grouped into four-year arrival cohorts, so it is not directly comparable to the even-numbered years shown in Figures 1 and 2. Nonetheless, the fourth quarter analysis does show a statistically significant spike in new arrivals from 2012 to the last quarter of 2015. During this time, 4.71 million new immigrants arrived in the country, more than any four-year period since 2004 to 2007. While it does not measure the same time period or length of time as Figure 1, Table A2 still shows a significant surge in new immigration.
American Community Survey. In addition to the monthly CPS, there is the American Community Survey (ACS) collected by the Census Bureau. The ACS is by far the nation's largest survey and, like the CPS, it also identifies immigrants. The ACS is collected throughout the year. However, data for 2015 will not be compiled and released until September or October 2016. Further, the ACS is weighted to reflect the U.S. population at mid-year (July 1), so even the 2015 data will only show arrivals through the first six months of that year. One advantage of the ACS is that it reports data by individual year of arrival, unlike the multi-year arrival cohorts in the CPS.
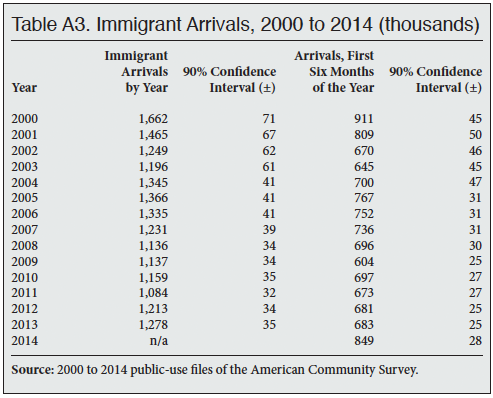
The 2014 ACS, the most recent available, shows that arrivals in the first six months of 2014 jumped considerably over prior years. Figure 3 shows that in the first six months of 2014, 849,000 (±28,000) new immigrants arrived in the United States, a 24 percent increase over the first six months of 2013. In fact, Figure 3 shows that the number of new arrivals in the first six months of 2014 as reported in the ACS is higher than any other six-month period since 2001. (Margins of error for the ACS arrival data are shown in appendix Table A3.) The results from the ACS through the middle of 2014 are consistent with the findings in Figures 1 that immigration surged starting in 2014.
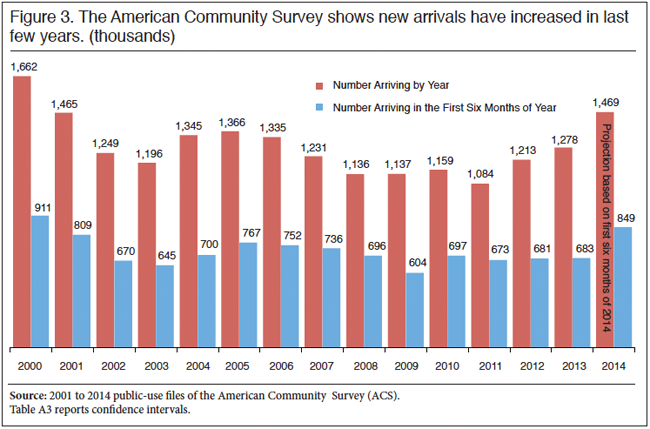
From 2010 to 2013, the ratio of arrivals in the first six months to the following years' ACS for the full year averaged 1.73. Using this average ratio indicates that the 2015 ACS will show 1.469 million new arrivals for the entirety of 2014. This is shown as a projection for 2014 in Figure 3. We will have to wait for the 2015 ACS to know for sure, but the evidence so far indicates that in 2014 the level of immigration returned to the highs reached at the turn of the century.
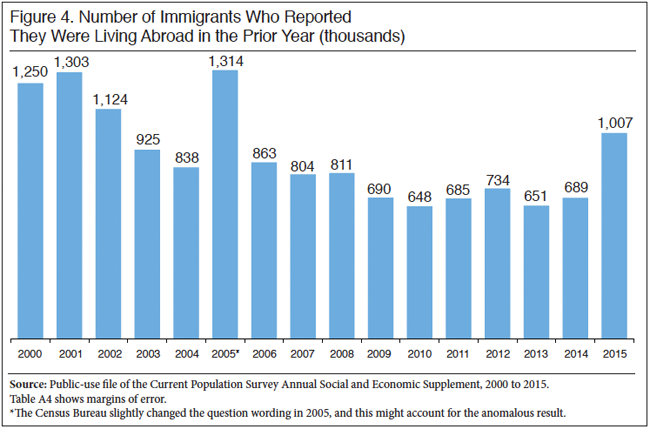
Annual Social and Economic Supplement. In March of each year the Census Bureau collects the Annual Social and Economic Supplement to the Current Population Survey, often referred to as the CPS ASEC or just ASEC. The survey over-samples minorities and is the nation's primary source for information about income, poverty, health insurance coverage, and other measures of socio-economic status. The ASEC includes a question not included in the monthly CPS that asks if respondents lived at their current residence one year ago. If they lived outside of the United States, the country is recorded. Focusing on immigrants' responses to this question in the ASEC can provide some insight into the number of new arrivals on an annual basis, though it should be noted that this question is not directly measuring new arrivals.3
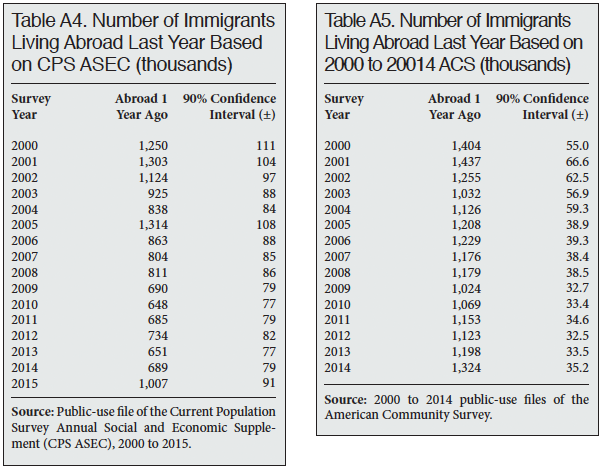
Figure 4 shows the number of immigrants who reported that they were living abroad one year prior to the ASEC. The survey shows a significant increase in the number of immigrants who in 2015 said they lived abroad in the prior year. From 2009 to 2014, the ASEC shows that the number of these immigrants in the survey fluctuated between 650,000 and 750,000. But in 2015 the number jumped to slightly above one million. (The 2005 number is an unexplained anomaly.) Excluding the 2005 data, 2002 was the last time the number of immigrants who had lived abroad in the prior was higher than the number shown in 2015. While the "lived abroad" question is not entirely comparable to the year of arrival question, it does strongly indicate a big increase in new arrivals in 2014. The information available from the ASEC reported in Figure 4 is certainly consistent with the results for the monthly CPS shown in Figures 1 and 2 — the level of new immigration has surged.
The ACS includes a very similar question about place of residence one year ago. Unfortunately, the newest ACS data available is for 2014 and it asked about the prior year place of residence, so it is not very helpful in determining if there was a surge in 2014 and 2015. Nonetheless, the ACS does show a slight increase from 2012 to 2013 and then a larger increase 2013 to 2014.4 Again, this supports the idea that immigration has increased in recent years.
Growth in the Immigrant Population. The growth in the immigrant population reflects new arrivals minus out-migration and deaths. (All of those born in the United States are considered native-born citizens, so the immigrant population does not grow from births.) For the total immigrant population to grow, arrivals must outpace both deaths and out-migration. Given its size and demographic characteristics, there are about 300,000 deaths annually among the immigrant population. While the number of deaths does not vary from year to year very much, the level of out-migration can vary significantly. This makes growth a more imperfect measure of new immigration levels.5 Figure 5 reports the size of the total immigrant population from the ACS, 2000 to 2014. The data from 2010 forward is weighted to reflect the 2010 Census, but the data prior to 2010 reflects the 2000 Census carried forward. So the figures before 2010 are not directly comparable to those after 2010. However, the Pew Research Center has reweighted the immigrant population for 2009 to reflect the 2010 figure and upped the total for that year by 1.6 percent, or about 616,000.6
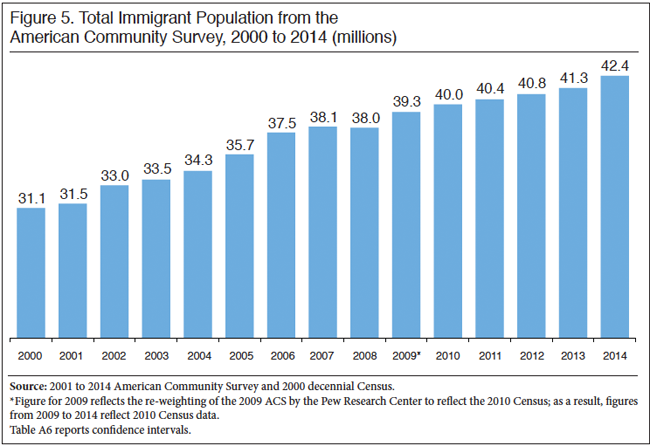
If we use Pew's revised 2009 numbers, then from 2009 to 2013 the immigrant population grew about 420,000 to 640,000 a year. But from 2013 to 2014 it grew by more than one million. This supports the finding that 2014 was a period of increased immigration. The growth shown in Figure 5 can also be used to roughly estimate "net immigration", which can be defined as the difference between the number of immigrants coming and going each year. Net immigration is equal to growth in the immigrant population plus deaths.7 Looking at the period from 2009 (using the revised weights) shows that net immigration was 918,000 from the middle of 2009 to the middle of 2010; 702,000 from 2010 to 2011; 729,000 from 2011 to 2012; 809,000 from 2012 to 2013; and 1.33 million from 2013 to 2014. Again, this is the pattern we would expect if 2014 was a period in which immigration levels increased.
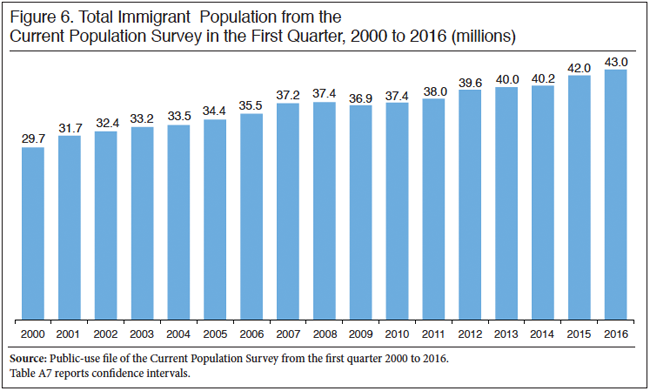
Figure 6 shows growth in the total immigrant population using the monthly CPS from the first quarter of each year in the monthly CPS. While the margin of error for the total foreign-born population is much larger in the CPS compared to the ACS (roughly ±400,000 for the CPS and roughly ±130,000 for the ACS), the growth from the first quarter of 2014 to the first quarter of 2016 was 2.8 million, one of the largest increases in a two-year period over the last decade and a half. Growth of this scale would require a significant increase in the number of immigrants entering the country.
Sending Regions
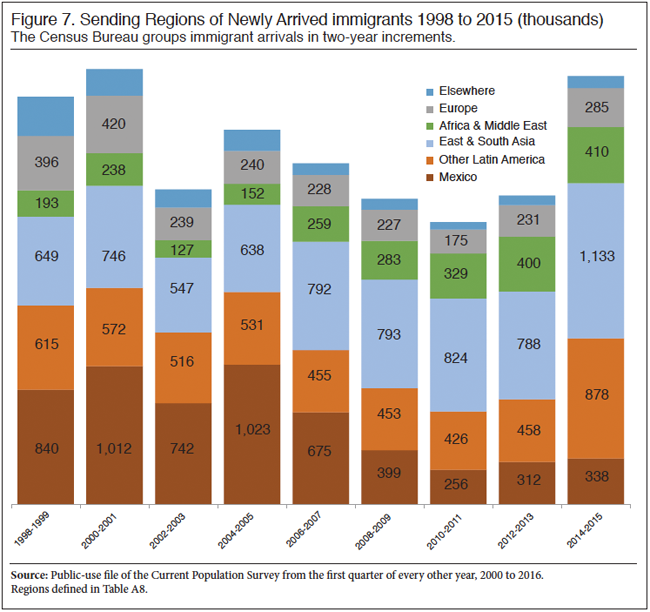
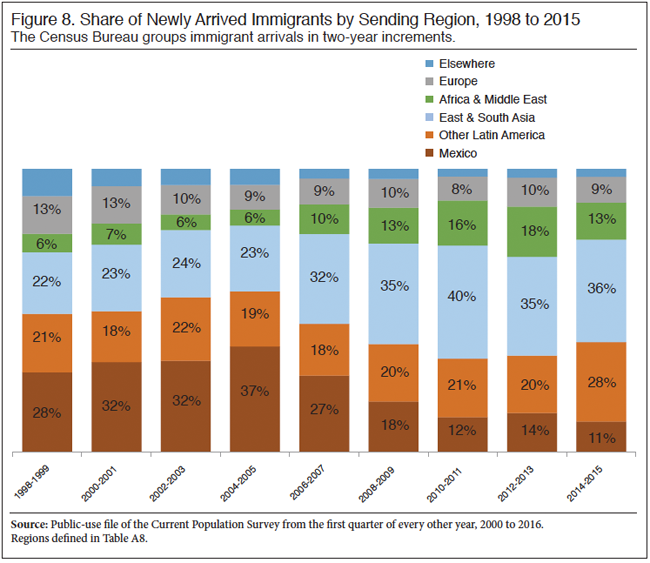
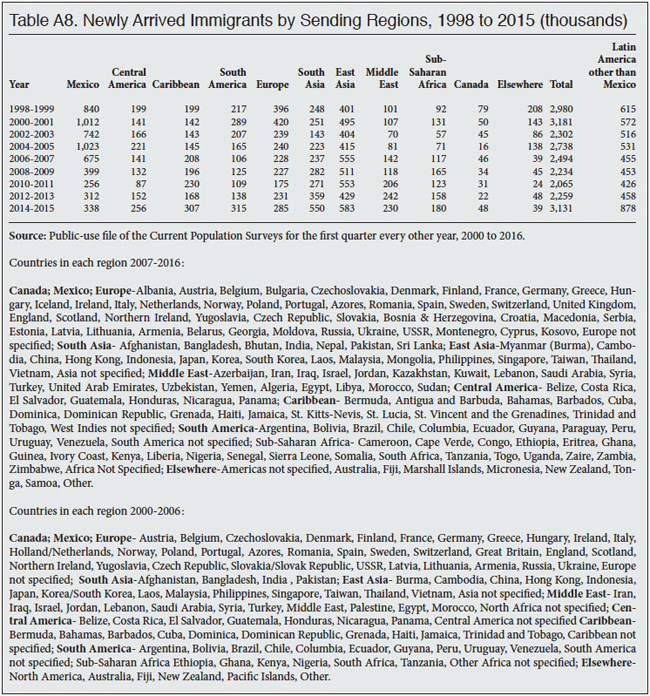
Asia and Latin America Surged. The CPS asks respondents in what country they were born. Figures 7 and 8 show the number and percentage for new arrivals 1998 to 2015 based on the region of the world from which they came. Starting in 2006-2007, the data identifies a larger number of specific countries, so some of the changes in the sending regions, particularly Africa, reflect his change.8 Prior to 2006, a number of African countries were simply not specified and are included in the "elsewhere" category in Figures 7 and 8. The information for 2006 to 2015 is more directly comparable, particularly for Africa and the Middle East. The big increases in sending regions are for Latin American countries other than Mexico, South Asia (e.g ., India and Pakistan), and East Asia (e.g., China and Vietnam). Mexican immigration has rebounded significantly from the lows of 2010 and 2011, but it is still nowhere near the level it was a decade earlier. Nonetheless, as we have seen, the long-term fall-off in Mexican immigration has not prevented the overall level of immigration from reaching levels not seen for more than a decade because an increase in immigration from other countries has offset the Mexican decline.
Legal Status
It is well established that illegal aliens do respond to government surveys such as the decennial census, ACS, and CPS. While Census Bureau surveys do not ask about the legal status of the foreign-born, the Center for Immigration Studies, the Department of Homeland Security (DHS), the Pew Hispanic Center, the Center for Migration Studies, and the Migration Policy Institute have all used the bureau's data to estimate the size and socio-demographic characteristics of the illegal immigrant population.9 While there is some debate about the number missed by Census Bureau, the Department of Homeland Security has estimated that 10 percent of illegal immigrants are not counted in Census Bureau surveys.10
Stock vs. Flow. When thinking about illegal immigration, it is very important to understand that the flow of people into the illegal population is offset each year by those who return to their home countries — either removed by the government or on their own — those who receive legal status, and about 50,000 deaths among the existing illegal population.11 The lead author of the Center for Migration Studies report on illegal immigrants, Robert Warren, has done some of the most detailed work estimating out-migration, deaths, and legalizations among this population. In 2009, for example, 558,000 illegal immigrants received legal status, returned to their home countries, or died.12 All of this means that hundreds of thousands of new immigrants can settle in the country each year, but the overall number of illegal immigrants may grow little or not at all. Put another way, no net growth in the illegal population does not mean that new illegal immigration has ceased, nor does it mean the United States has control over illegal immigration.
Illegal Arrivals. Figure 9 reports our preliminary estimate of 1.1 million new illegal immigrants settling in the country in 2014 and 2015. This means that roughly one-third of the 3.1 million new immigrants who entered the country in the last two years are illegal aliens. This would equal an annual flow of 550,000 new illegal immigrants. These estimates are based primarily on the illegal share of prior immigrant flows by country.13 Figure 9 also reports new arrivals if we adjust these figures upward by 10 percent to reflect those missed by the survey. Using a 10 percent adjustment means that 715,000 new illegal aliens entered in 2010 and 2011; 770,000 entered in 2012 and 2013; and 1.2 million settled in the country in 2014 and 2015. It must be emphasized that these figures are preliminary. Further, the numbers represent the flow of new illegal immigrants into the country and do not represent the net increase in the size of the illegal immigrant population.
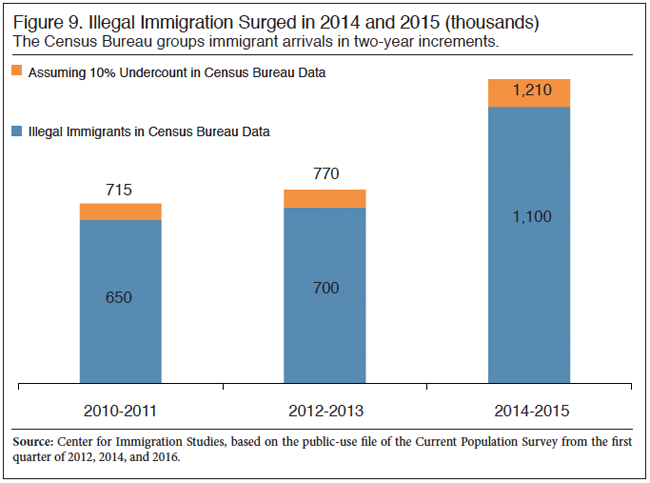
To our knowledge there are no estimates for illegal arrivals for the entirety of 2014 and 2015. However, our estimates of 650,000 illegal immigrants arriving in the 2010-2011 period and 700,000 arriving in the 2012-2013 period are in line with estimates from other organizations. The Pew Research Center has published an estimate indicating that about 350,000 illegal immigrants settled in the country each year on average in this period.14 Robert Warren's estimates for the Center for Migration Studies (CMS) show 324,000 new illegal immigrants arrived in 2012 and 361,000 arrived in 2013, based on Census Bureau data. Warren then adjusts these figures upward by 12 percent to reflect those missed by the Bureau.15 The similarity of our estimates with those of CMS and Pew gives us confidence that our preliminary numbers for 2014 and 2015 are correct.
Although this analysis is focused on the flow of new illegal immigrants, our preliminary estimate of the total illegal immigrant population based on the first quarter CPS data and adjusted for undercount is 11.5 million (±200,000) in 2015 and 11.7 million (±200,000) for 2016. (These figures are adjusted for undercount.) The above margins of error only reflect statistical variation; they do not reflect any error due to non-statistical error that is inherent in any estimate of the illegal immigrant population.
Legal Arrivals. Our estimate that 1.1 million illegal immigrants arrived in 2014-2015 shown in Figure 9 indicates that a significant portion of the surge in overall immigration in the last two years is due to an increase in illegal immigration. But it also means that the number of those admitted legally increased. In this context, foreign citizens admitted legally are those entering and remaining in the country with authorization, which includes new green card holders, but also long-term temporary visitors such as guestworkers, foreign students, and cultural exchange visitors. These long-term temporary visitors are referred to as "non-immigrants" by the U.S. government. Prior research shows that a significant share of non-immigrants are captured by the Census Bureau.16
We estimate that, in 2014 and 2015, 2.03 million new legal arrivals (permanent and non-immigrant) arrived and were captured by the Current Population Survey for the first quarter of 2016. This is a significant increase over the 1.41 million new legal arrivals we estimate for 2010 and 2011 and the 1.56 million legal immigrants who arrived in 2012 and 2013.
Although the number getting green cards, also referred to as Lawful Permanent Residence (LPR), do not show a significant increase in recent years (2014 is the latest data available), new arrivals do not simply reflect the number of new green cards issued. About half of new green cards are given out each year to people already in the country.17 Those who get their green cards and are already in the United States are said to have "adjusted status". Most of those adjusting status are on temporary visas or are illegally in the country when they are adjusted to lawful permanent residence.18 The number of foreign citizens who get green cards (about one million annually) is not a measure of new arrivals in the way that Census Bureau data captures new arrivals.
There is, however, administrative data that does indicate that the number of new legal immigrants arriving in the country increased in the last two years. The State Department reports that the number of permanent resident visas issued at overseas posts increased in the last two years compared to the prior two years. In 2012 and 2013, 955,415 permanent resident visas were issued at overseas post compared to 998,833 in 2014 and 2015 — a 43,418 increase.19 In almost all cases these individuals then proceeded to come to the United States and would show up as new arrivals in Census Bureau data.20
Much more important in terms of numbers, however, is the increase in long-term temporary non-immigrant visas in the last two years that allow for stays in the United States for a long enough period to show up as new arrivals in Census Bureau data.21 Excluding short-term visas such as tourists and business travelers, the number of long-term visas issued at overseas posts increased by 554,000 in the 2014-2015 period compared to 2012-2013.22 The 2012-2013 period was also an increase over the previous two years. It should be noted that visas of this kind allow for multiple entries. These multiple entries are what is reported in the Annual Yearbook of Immigration Statistics and other publication put out by DHS — not new visas or those entering for the first time. Because DHS reports multiple entries of the same person, it cannot be used to determine if the number of non-immigrants coming and staying in the United States is increasing or decreasing.
Of course, the number of new long-term, non-immigrant visas issued overseas is also not a direct measure of new immigration. Some of those getting long-term visas many not yet have used their visas to come to the United States — visas are typically good for many years and allow multiple entries. Others may have come to the United States, but stayed for only a short time and would be very unlikely to show up in Census Bureau data. Furthermore, some foreign citizens issued non-immigrant visas in prior years may have waited before coming to United States, only coming in the last two years and then showing up as new arrivals in the CPS or other Census Bureau surveys.
Long-term temporary visa holders are always coming and going in significant numbers and adjusting to LPR status. Nonetheless, the increased issuance of non-immigrant, long-term visas at foreign posts is what we would expect based on the surge in arrivals shown in Census Bureau data. Overall, the administrative data from the State Department helps explain why the number of new arrivals shows an increase based on the Census Bureau data.
Conclusion
Based on Census Bureau data released at the beginning of 2016, this analysis finds that both legal and illegal immigration surged in 2014 and 2015. Other data released in 2015 and 2014 also shows a surge in new immigration. More than three million new immigrants entered the country in 2014 and 2015, a dramatic increase over the 2.3 million who entered in the prior two years. The surge has been the result of significant increases in new arrivals from East and South Asia as well as Latin America, particularly countries other than Mexico.
Our preliminary estimate is that, of the 3.1 million immigrants who arrived in 2014 and 2015, about one-third (1.1 million or 550,000 annually) were new illegal immigrants, a significant increase from the 700,000 (350,000 annually) who entered in 2012 and 2013. It is certainly reasonable to argue that with more than half a million new illegal immigrants settling in the country each year, the United States does not have control over the problem. While Mexican immigration has rebounded some from the lows of 2010 and 2011, the number of new arrivals from that country remains well below the highs reached more than a decade ago. But this in no way means that illegal immigration has abated.
At the same time as illegal immigration has increased, the number of new permanent legal visas issued overseas and long-term temporary immigration (e.g. guest workers and foreign students) have also increased somewhat. We estimate that 2.03 million new legal immigrants entered in 2013 and 2014, compared to 1.6 million in 2012 and 2013.
The latest Census Bureau data shows that the scale of new immigration is clearly enormous. The numbers raise profound questions about assimilation and the impact of immigration on the nation's education system, infrastructure, and labor market, as well as the size and density of the U.S. population. It is difficult to find a public policy that has a more profound impact across American society than the level of immigration. It is certainly appropriate that immigration should be at the center of the current presidential election.
Appendix
End Notes
1 For the post-1980 immigrant population, the Department of Homeland Security estimates a 5 percent undercount in the CPS. See Michael Hoefer, Nancy Rytina, and Bryan Baker, "Estimates of the Unauthorized Immigrant Population Residing in the United States: January 2011", Department of Homeland Security, March 2012. The Pew Hispanic Center comes to a similar conclusion in their analysis of the Current Population Survey. See Jeffrey S. Passel and D'Vera Cohn, "Trends in Unauthorized Immigration: Undocumented Inflow Now Trails Legal Inflow", Pew Hispanic Center, October 2, 2008.
2 The arrival data in even numbered years includes the current year and the prior two years. So, for example, in the first quarter of 2016 those who arrived in 2014, 2015, and 2016 can be identified. Thus it is the case that a small number of the 3.1 million new arrivals shown in Figure 1 did arrive in the first quarter of 2016, but the share is extremely small. In general, these very recent arrivals are the least likely immigrants to be captured by the CPS. Moreover, the January 2016 CPS data examined alone shows three million arrivals for 2014 and 2015. This means that just 5 percent of the 3.1 million arrivals reported as having arrived in 2014 and 2015 may have actually arrived in the very beginning of 2016. All of the data in Figure 1 is from the first quarter of even-numbered years, so the big jump in 2014 and 2015 is directly comparable to earlier years as the same length of time is examined.
3 For example, an immigrant who entered years ago might have gone home for an extended stay and then returned so he responds that he lived abroad last year, but on the year of arrival question he responds that he came to the United States to live several years earlier. Also, an immigrant who came to the United States in the beginning of the year when asked his year of arrival would respond that he came to the United States last year, but when asked where he lived one year ago would also say the United States.
4 Table A5 in the appendix shows the number of immigrants in the ACS who report living abroad one year ago. The ACS is a larger sample with a slightly different population universe from the ASEC. The ACS produces higher figures for the "residence one year ago" question. The Census Bureau has studied this question and does not have a clear answer on why this is the case. See David Ihrke, William Koerber, and Alison Fields, "Comparison of Migration Data: 2013 American Community Survey and 2013 Annual Social and Economic Supplement of the Current Population Survey", Working Paper Number SEHSD-WP2015-21, U.S. Census Bureau, 2015.
5 Using growth in the immigrant population to measure the number of new arrivals is complicated by what is sometimes referred to as "re-immigration". This is when a foreign-born person who lived in the country for a time leaves and then returns. In this case, they would add to population growth when they return, but might not show up as a new arrival in Census Bureau data. Of course, it will depend on how they answer the year-of-arrival question.
6 Jeffrey S. Passel and D'Vera Cohn, "U.S. Foreign-Born Population: How Much Change from 2009 to 2010?", Pew Research Center, 2012.
7 Based on the demographic composition of the foreign-born over this period, we estimate a death rate of seven per thousand, which is somewhat below that for the nation as a whole.
8 As noted earlier, the arrival data for 2006 and 2007 is from the CPS for the first quarter of 2008. The change in the list of countries that can be individually identified in the survey was in 2007. So the first time it impacts the data is for the arrival numbers in 2006 and 2007 based on the 2008 CPS.
9 The Pew Research Center has issued a series of reports using the Current Population and American Community Survey to estimate the size of the illegal immigrant population. The Center for Migration Studies (CMS) has (jmhs.cmsny.org/index.php/jmhs/article/view/38) several papers authored by Robert Warren estimating illegal immigration using the American Community Survey. Like CMS, the Office of Immigration Statistics within the Department of Homeland Security has used the ACS to estimate illegal immigration in a series of annual reports. The Migration Policy Institute has used the ACS and another Census Bureau survey called the Survey of Income and Program Participation for its estimates of the size and characteristics of the illegal population.
10 "Estimates of the Unauthorized Immigrant Population Residing in the United States: January 2012", Department of Homeland Security, March 2013. Table 2 shows the estimated number of permanent immigrants, non-immigrants, and illegal immigrants and the undercount of these populations in the ACS.
11 One way that legalization occurs is when an immigration court grants asylum or something called "Cancelation of Removal" to an illegal immigrant. Both are done on humanitarian grounds and give legal status and green card. The Department of Homeland Security reports that 143,326 people received a green card as a result of asylum or Cancellation of Removal from 2011 to 2013. See Adwa Mossaad, "U.S. Lawful Permanent Residents: 2014", Annual Flow Report", Department of Homeland Security, 2016. All of those who benefit from Cancellation of Removal and the majority of those who are granted asylum are in the country illegally. Another way this can happen is if an illegal immigrant marries an American citizen or finds an employer to sponsor them. Those who have lived in the country illegally for more than six months are supposed to be barred from entering the country for up to 10 years if they want to enter under these categories. But the Obama administration has decided to grant "extreme hardship" waivers to about 80 percent of these individuals, making it much easier for illegal immigrants in the United States to get legal status. See Jessica Vaughan, "New Waiver Shields Sponsored Illegal Aliens From Penalties", Center for Immigration Studies, 2013.
12 Robert Warren, who is the lead author of the CMS estimates, has done the most extensive work on the components of change in the illegal population. He and his coauthor estimated that between 530,000 and 560,000 illegal immigrants a year went or were sent home, legalized, or died from 2007 to 2009. See Table 3 in Robert Warren and John Robert Warren, "Unauthorized Immigration to the United States: Annual Estimates and Components of Change, by State, 1990 to 2010", International Migration Review, February 2013.
13 Researcher Robert Warren has kindly provided us with the number of immigrants entering each year who were illegal immigrants from 2012 to the middle of 2014. We then apply those percentages by country to those who entered in 2014 and 2015. So, for example, if 17 percent of immigrants from China who settled in the country in 2012 to 2014 were illegal immigrants, we assume the same percentage were illegal immigrants in 2014 and 2015 in the CPS. This provides a base estimate of roughly 932,000 illegal immigrants in 2014 and 2015. We further adjust these figures to account for other events, such as the economic crisis in Venezuela and Brazil, or the surge in families from Central America coming across the southern border in 2014 and 2015. Finally, we combined these figures with information from the State Department on the number of immigrant and non-immigrant visas issued at Foreign Service posts overseas to produce our estimates. As is discussed later in this report, the number of new visa issued overseas has increased and our estimate takes this into account.
14 In their estimate for March 1, 2013, Pew reports that 16 percent (1.8 million) of illegal immigrants in the country arrived from January 2008 to March 1, 2013. (Figure 3 in "As Growth Stalls, Unauthorized Immigrant Population Becomes More Settled", Pew Research Center, September 2014) shows the 1.8 million arrivals. The report's lead author Jeffery Passel confirmed these dates in an email on June 26, 2015. Dividing the 1.8 million by the 5.17 years this represent would mean that over this period about 350,000 new illegal immigrants settled in the country.
15 Email and spreadsheet proved by Robert Warren, April 28, 2016
16 Bryan Baker and Nancy Rytin, "Estimates of the Unauthorized Immigrant Population Residing in the United States: January 2012", Department of Homeland Security, March 2013. Table 2 shows the estimated number of permanent immigrants, non-immigrants, and illegal immigrants and the undercount of these populations in the ACS. The table shows that in 2012 there were 1.87 million non-immigrants in the country at that time and that 190,000 were missed by the Census Bureau.
17 Adwa Mossaad, "U.S. Lawful Permanent Residents: 2014", Annual Flow Report", Department of Homeland Security, 2016. See Table 1.
18 Some who get green cards each year are technically illegal immigrants, but the government is aware of their presence and may have even conferred benefits such as work authorization. This includes asylum applicants whose claim is being
adjudicated.
19 Table 1 in "Report of the Visa Office, 2015" shows the number of permanent visas issued in recent years.
20 Not all of these individuals would show up as new arrivals in Census data if some were already living here, but went through the visa process in their home countries.
21 The CPS uses a "usual residence" rule, which means that everyone in a household is counted as part of that household, including college students away at school at the time of the survey. As a result, the CPS tends to count college students living in dorms at the time of survey as part of their parents' residence and so some of those on foreign student visas living on campus may be missed by the survey. Those foreign students living outside of dorms will be captured by the survey at their residence like any other person living in the country.
22 Table XVIB in the "Report of the Visa Office, 2015" shows the number of permanent visa issued in recent years. Focusing only on visas that allow long-term temporary settlement indicates that in 2014 and 2015 4,018,085 such visas were issued overseas compared to 3,463,647 in 2012 and 2013. The following visas all allow for long-term stays, making it possible those using them would be captured in the CPS: A, E, F, G, H, I, J, K, L, M, N, O, P, Q, R, T, TN, TD and U.