Download a PDF of this Backgrounder
Steven A. Camarota is the Director of Research and Karen Zeigler is a demographer at the Center for Immigration Studies.

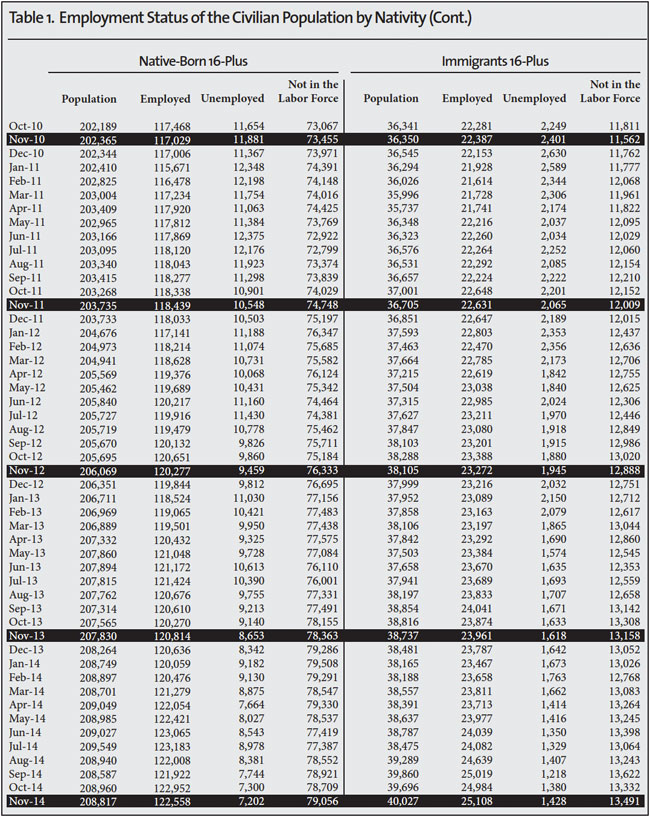
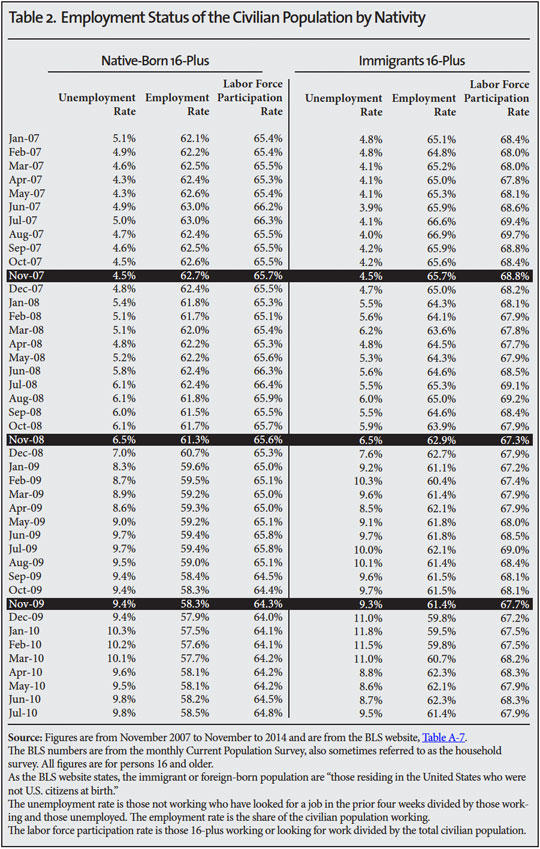
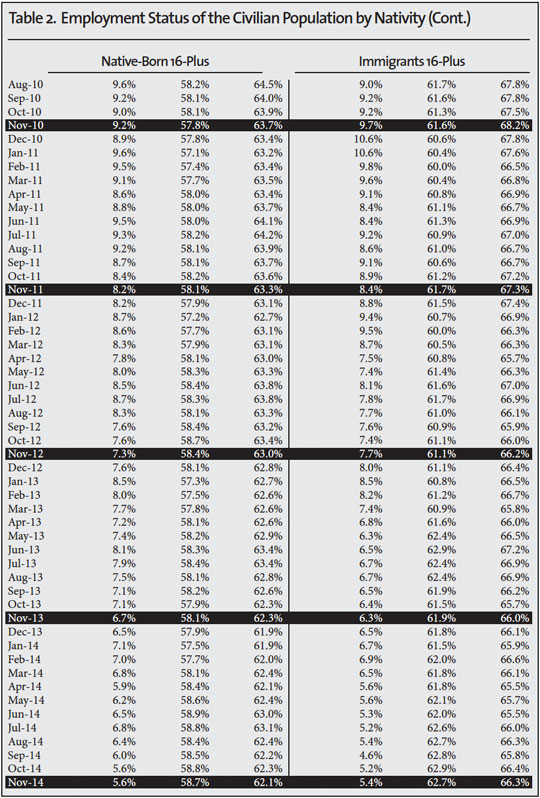
President Obama recently announced plans to give legal status and work permits to millions of illegal immigrants. Many members of Congress and the president continue to support efforts to increase the level of immigration, such as Senate bill S.744 that passed that chamber last year. Yet data published by the Bureau of Labor Statistics (BLS) on its website (see Table A-7) show that all of the net gain in employment since 2007 has gone to immigrants (legal and illegal), also referred to as the foreign-born.1 Native employment has still not returned to pre-recession levels, while immigrant employment already exceeds pre-recession levels. Furthermore, even with recent job growth, the number of natives not in the labor force (neither working nor looking for work) continues to increase.
Additional findings:
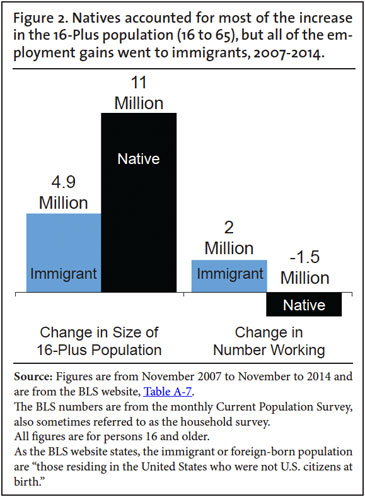
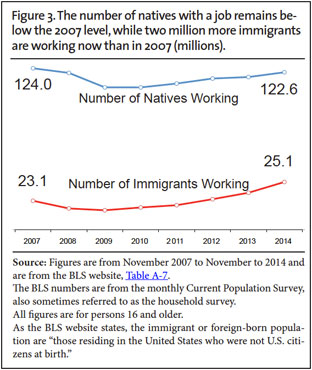
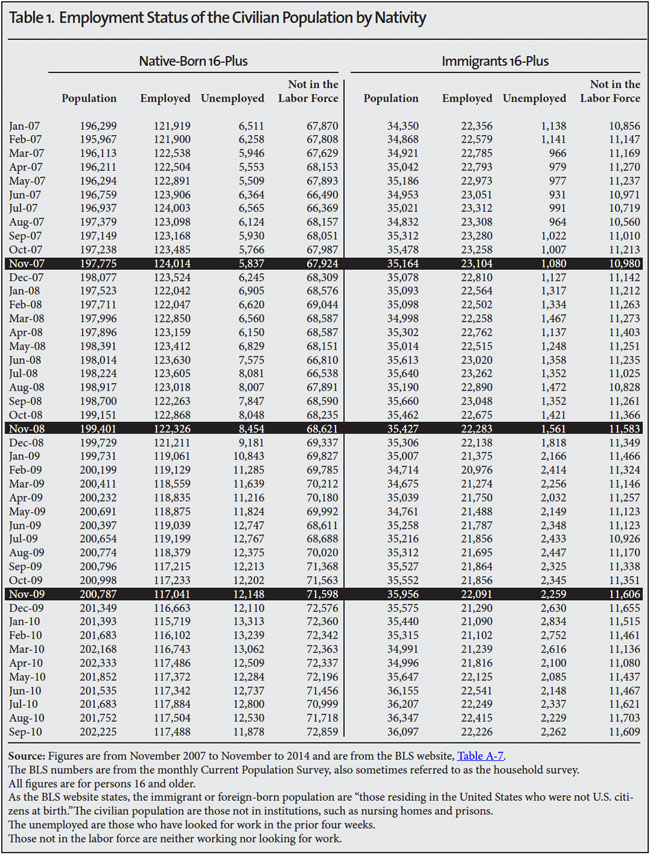
- The BLS reports that 23.1 million adult (16-plus) immigrants (legal and illegal) were working in November 2007 and 25.1 million were working in November of this year — a two million increase. For natives, 124.01 million were working in November 2007 compared to 122.56 million in November 2014 — a 1.46 million decrease.
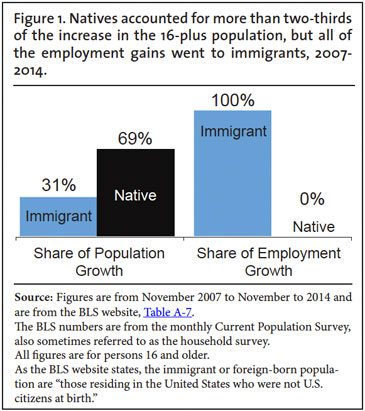
- Although all of the employment growth has gone to immigrants, natives accounted for 69 percent of the growth in the 16 and older population from 2007 to 2014.
- The number of immigrants working returned to pre-recession levels by the middle of 2012, and has continued to climb. But the number of natives working remains almost 1.5 million below the November 2007 level.
- More recently, natives have done somewhat better. However, even with job growth in the last two years (November 2012 to November 2014), 45 percent of employment growth has gone to immigrants, though they comprise only 17 percent of the labor force.
- The number of officially unemployed (looking for work in the prior four weeks) adult natives has declined in recent years. But the number of natives not in the labor force (neither working nor looking for work) continues to grow.
- The number of adult natives 16-plus not in the labor force actually increased by 693,000 over the last year, November 2013 to November of 2014.
- Compared to November 2007, the number of adult natives not in the labor force is 11.1 million larger in November of this year.
- In total, there were 79.1 million adult natives and 13.5 million adult immigrants not in the labor force in November 2014. There were an additional 8.6 million immigrant and native adults officially unemployed.
- The percentage of adult natives in the labor force (the participation rate) did not improve at all in the last year.
- All of the information in BLS Table A-7 indicates there is no labor shortage in the United States, even as many members of Congress and the president continue to support efforts to increase the level of immigration, such as S.744 , which passed in the Senate last year. That bill would have roughly doubled the number of immigrants allowed into the country from one million annually to two million.2
- It will take many years of sustained job growth just to absorb the enormous number of people, primarily native-born, who are currently not working and return the country to the labor force participation rate of 2007. If we continue to allow in new immigration at the current pace or choose to increase the immigration level, it will be even more difficult for the native-born to make back the ground they have lost in the labor market.
Methodology. Jobs are always being lost and gained, and people continually change jobs. The net result of this process is what gets reported each month by the BLS. In a series of reports in recent years, the Center for Immigration Studies has examined the disproportionate share of net employment growth going to immigrants.3 We have done so by downloading public-use BLS data and analyzing it ourselves. However, the information for this analysis comes directly from the Bureau of Labor Statistics website (Table A-7).4 Although less detailed than our analysis, the BLS website shows the same phenomenon as our prior research: Relative to their percentage of the population or their share of population growth, a disproportionate share of employment growth has gone to immigrants in both the long- and short-term. Further, the number of natives working or the share working or in the labor force has not come close to returning to pre-recession levels.
The data are from the Current Population Survey (CPS), also referred to as the household survey. The CPS surveys the civilian population and does not include those who are institutionalized, such as those in prisons and nursing homes. Table A-7 reports figures for the native-born and immigrants, referred to as the foreign-born by the BLS. As the table states: "The foreign born are those residing in the United States who were not U.S. citizens at birth. That is, they were born outside the United States or one of its outlying areas such as Puerto Rico or Guam, to parents neither of whom was a U.S. citizen." Those born in the United States, one of its outlying areas, or to an American citizen parent are considered native-born.
To retrieve the total number of civilians 16 and older, the number unemployed, or the number working, check the desired box(s) in Table A-7 and click the retrieve data button at the bottom of the table. BLS defines the unemployed as those who are not working, but report they have looked for a job in the prior four weeks. Those not in the labor force are neither working nor looking for work. The labor force is all those working or looking for work. The labor force participation rate is all those working or looking for work divided by the total civilian population. Prior research by the Center for Immigration Studies has covered the period 2000 to 2014; however BLS Table A-7 only goes back to 2007.5
End Notes
1 The data come from this BLS table. To see the total number of civilians 16 and older, the number unemployed, or the number working, check the desired box(s) in Table A-7 by nativity and then click the retrieve data button at the bottom of the table. We concentrate in this report on comparing November of each year because the most recent data available are for November 2014. However, every month-over-month comparison for 2007 to 2014 shows significant growth in immigrant employment, while also showing a significant decline in native employment.
2 Congressional Budget Office projections indicate that if the Schumer-Rubio bill (S.744) becomes law, the number of new legal immigrants allowed into the country will roughly double to 20 million over the next decade, adding to the 40 million immigrants (legal and illegal) already here. A Congressional Budget Office cost estimate, Table 2, p. 14, reports that by 2023 there will be 10.4 million additional U.S. residents if the bill passes, 1.2 million of whom will be the U.S.-born children of new immigrants who will enter the country if the bill passes. This increase is in addition to the legalization of illegal immigrants already in the country. The primary argument for this dramatic increase is, as Republican Rep. Paul Ryan (R-Wisc.) has argued, that without it the country faces "labor shortages". The National Restaurant Association, National Association of Home Builders, National Association of Manufacturers, Business Roundtable, U.S. Chamber of Commerce, and numerous other companies and business associations have all argued that immigration should be increased because there are not enough workers in the country — both skilled and unskilled.
3 Steven A. Camarota and Karen Zeigler, "All Employment Growth Since 2000 Went to Immigrants", Center for Immigration Studies Backgrounder, June 2014.
4 Bureau of Labor Statistics' website (Table A-7).
5 The CPS began to distinguish immigrants and natives in the survey staring in 1994.