See our latest employment research here.
Download a PDF of this Backgrounder
Steven A. Camarota is the Director of Research and Karen Zeigler is a demographer at the Center for Immigration Studies.

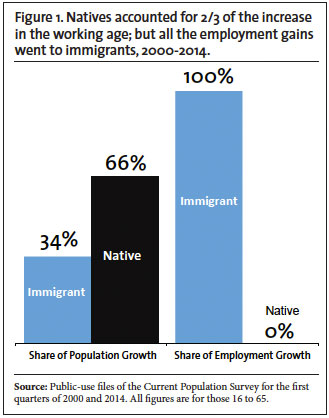
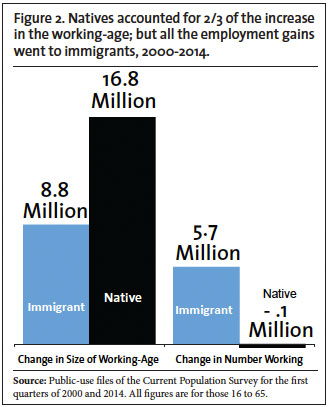
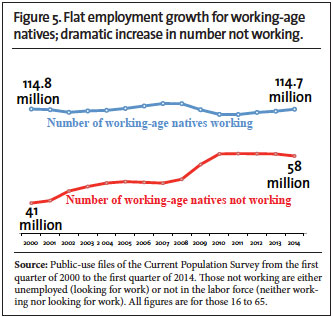
Government data show that since 2000 all of the net gain in the number of working-age (16 to 65) people holding a job has gone to immigrants (legal and illegal). This is remarkable given that native-born Americans accounted for two-thirds of the growth in the total working-age population. Though there has been some recovery from the Great Recession, there were still fewer working-age natives holding a job in the first quarter of 2014 than in 2000, while the number of immigrants with a job was 5.7 million above the 2000 level.
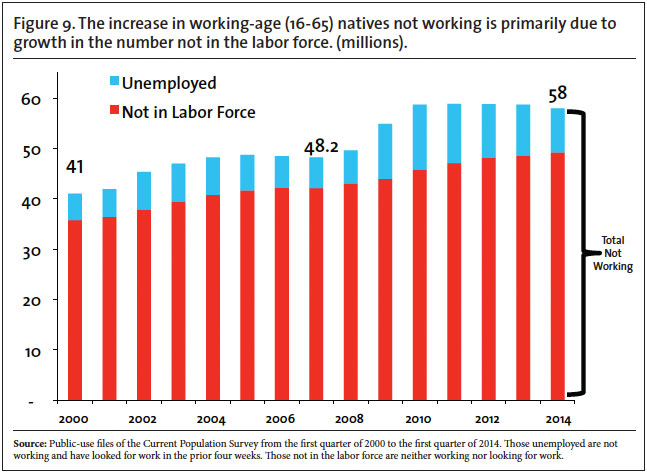
All of the net increase in employment went to immigrants in the last 14 years partly because, even before the Great Recession, immigrants were gaining a disproportionate share of jobs relative to their share of population growth. In addition, natives' losses were somewhat greater during the recession and immigrants have recovered more quickly from it. With 58 million working-age natives not working, the Schumer-Rubio bill (S.744) and similar House measures that would substantially increase the number of foreign workers allowed in the country seem out of touch with the realities of the U.S. labor market.
Three conclusions can be drawn from this analysis:
- First, the long-term decline in the employment for natives across age and education levels is a clear indication that there is no general labor shortage, which is a primary justification for the large increases in immigration (skilled and unskilled) in the Schumer-Rubio bill and similar House proposals.
- Second, the decline in work among the native-born over the last 14 years of high immigration is consistent with research showing that immigration reduces employment for natives.
- Third, the trends since 2000 challenge the argument that immigration on balance increases job opportunities for natives. Over 17 million immigrants arrived in the country in the last 14 years, yet native employment has deteriorated significantly.
Among the findings:
- The total number of working-age (16 to 65) immigrants (legal and illegal) holding a job increased 5.7 million from the first quarter of 2000 to the first quarter of 2014, while declining 127,000 for natives.
- In the first quarter of 2000, there were 114.8 million working-age natives holding a job; in the first quarter of 2014 it was 114.7 million.
- Because the native-born population grew significantly, but the number working actually fell, there were 17 million more working-age natives not working in the first quarter of 2014 than in 2000.
- Immigrants have made gains across the labor market, including lower-skilled jobs such as maintenance, construction, and food service; middle-skilled jobs like office support and health care support; and higher-skilled jobs, including management, computers, and health care practitioners.
- The long-term decline in the share of working-age natives holding a job began before the 2007 recession, falling from 74 percent in 2000 to 71 percent in 2007. It is now an abysmal 66 percent, improving only slightly since the bottom of the recession.
- The share of natives working or looking for work, referred to as labor force participation, shows the same decline as the employment rate. In fact, labor force participation has continued to decline for working-age natives even after the jobs recovery began in 2010.
- Immigration has fallen in recent years. But despite the economy, between 2008 and the start of 2014 6.5 million new immigrants (legal and illegal) settled in the country and three million got jobs. Over the same time, the number of working-age natives holding a job declined 3.4 million.
- In contrast to natives, the employment rate of working-age immigrants increased from 2000 to 2007 and has recovered more quickly from the Great Recession than natives, though it has not fully recovered.
- Since the jobs recovery began in 2010, 43 percent of employment growth has gone to immigrants.
- If the employment rate of working-age natives in the first quarter of this year were what it was in 2007, 7.9 million more natives would have a job. If the share working were what it was in the first quarter of 2000, 12.5 million more natives would have a job today.
- There were a total of 69 million working-age immigrants and natives not working in the first quarter of 2014. There were an additional 7.3 million forced to work part-time despite wanting full-time work.
- The supply of potential workers is enormous: 8.7 million native college graduates are not working, as are 17 million with some college, and 25.3 million with no more than a high school education.
Introduction
Congressional Budget Office projections indicate that if the Schumer-Rubio bill (S.744) becomes law, the number of new legal immigrants allowed into the country will roughly double to 20 million over the next decade, adding to the 40 million immigrants (legal and illegal) already here.1 This increase is in addition to the legalization of illegal immigrants already in the country. The primary argument for this dramatic increase is, as Republican congressman Paul Ryan (R-Wisc.) has argued, that without it the country faces "labor shortages". The National Restaurant Association, National Association of Home Builders, National Association of Manufacturers, Business Roundtable, U.S. Chamber Commence, and numerous other companies and business associations have all argued that immigration should be increased because there are not enough workers in the country — both skilled and unskilled.2 This report examines employment trends for immigrants and natives to see if potential workers are, in fact, in short supply.
The findings show that employment growth has been weak over the last 14 years and has not kept pace with population growth and new immigration. Among the working-age (16 to 65), what employment growth there has been has entirely gone to immigrants (legal and illegal). This is truly remarkable because natives accounted for two-thirds of overall population growth among the working-age population.3 In short, natives accounted for two-thirds of the growth in the number of potential workers, but none of the growth in the number of actual workers.4 Employment, of course, fluctuates with the economy, but all of the net increase in employment has gone to immigrants from 2000 to 2014, partly because natives never fully recovered from the 2001 recession and a disproportionate share of employment growth went to immigrants. Further, natives were somewhat harder hit by the 2007 recession and immigrants have recovered from it faster than have natives.
Immigrants made gains through the labor market over the last 14 years; about half of that growth in immigrant employment was for those with a bachelor's degree or more. At the same time, there has been a long-term deterioration in the employment rate for natives of every education level, race, and age.
There has been some improvement for natives since the job market bottomed out in 2010, but still 43 percent of employment growth has gone to immigrants. Despite some improvement, the share and number of working-age natives holding a job has not come close to returning to the levels in 2007 or 2000.
This analysis is based on the "household survey" collected by the Census Bureau for the Bureau of Labor Statistics. The survey, officially known as the Current Population Survey (CPS), is the nation's primary source of information on the U.S. labor market.5 The CPS survey does not include those in institutions such as prisons. We concentrate in this analysis on the first quarter of each year 2000 to 2014 because comparing the same quarter over time controls for seasonality and the first quarter of 2014 is the most recent quarterly data available. (Table 1 reports figures for every quarter and year.) We also emphasize the economic peaks in 2000 and 2007 as important points of comparison.
We primarily focus on the share of working-age people holding a job, referred to by economists as the employment rate. The employment rate is a straightforward measure of who has a job and who does not. To a lesser extent we examine labor force participation, which is the share of people working or looking for work. Labor force participation and the employment rate are measures of labor force attachment that are less sensitive to the business cycle than the often-cited unemployment rate, which we also report.
Overall Trends Among the Working-Age Population
The 16- to 65-Year-Old Population. Comparing the number of immigrants working (ages 16 to 65) in the first quarter of 2000 to the number working in the first quarter of 2014 shows an increase of 5.7 million. In contrast, the number of working-age (16 to 65) natives holding a job was 127,000 fewer in the first quarter of 2000 than in the same quarter of 2014, even though the number of working-age natives overall increased by more than 16.8 million. This 16.8 million represented 66 percent of the overall growth in the working-age population. (See Figures 1 and 2 and Table 1). Since the number of working-age natives grew, but the number working did not, the share of working-age natives holding a job declined significantly. The decline in the employment rate of natives began before the 2007 recession, falling from 73.7 percent in 2000 to 71 percent at the peak of last expansion in the first quarter of 2007. Or, put a different way, the employment rate for natives never returned to the 2000 level after the country went into recession in 2001. In the first quarter of this year the rate was an abysmal 66.4 percent (See Figure 6 and Table 1).
Of course, not all of the 58 million non-institutionalized working-age natives without a job want to work or even can work. But this has always been the case. It is for this reason that it is necessary to look for a trend over time. There is simply no question that the general decline in the employment rate of natives is both long-term and large. If the employment rate of natives (16 to 65) in the first quarter of this year were what it had been in 2000 (73.7 percent), 12.5 million more natives would have been working. If the share working were what it had been in the first quarter of 2007 (71 percent), 7.9 million more natives would have a job today. Among immigrants, if their employment in the first quarter of this year were what it was in the first quarter of 2000, then 471,000 more immigrants would be working. Both the situation in 2007 before the recession and the situation today represent a significant deterioration from what had been the employment rate of natives as recently as 2000.
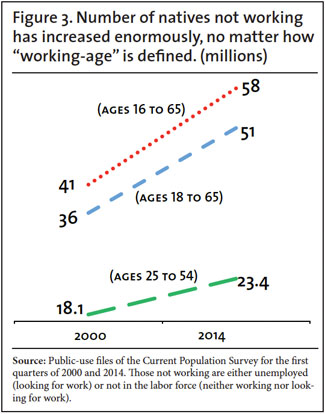
Other Ways of Defining the Working-Age Population. We see a similar decline in work no matter how we define the working-age population. If we look at those natives 18 to 65, excluding younger teens 16 and 17, we find that the number not holding a job was 15 million larger in the first quarter of 2014 than in the first quarter of 2000 (Figure 3). The share holding a job declined from 75.7 percent in 2000 to 73.6 percent in 2007 and was just 69 percent in the first quarter of 2014, improving only slightly since the jobs recovery began in 2010 (Table 3). If we examine the 25- to 54-year-old native-born population, which is often seen by economists and demographers as the core of the work force, it shows the same pattern of decline. Their employment rate declined from 82.4 percent in 2000 to 80.5 percent in 2007 and was 76.7 percent in the first quarter of 2014. In contrast to natives, the share of immigrants in this age group working increased from 2000 to 2007, and did not decline as much as it did for natives during the great recession (Table 3). No matter how the working-age is defined, there has been a very significant decline in work among the native-born in absolute terms and relative to immigrants.
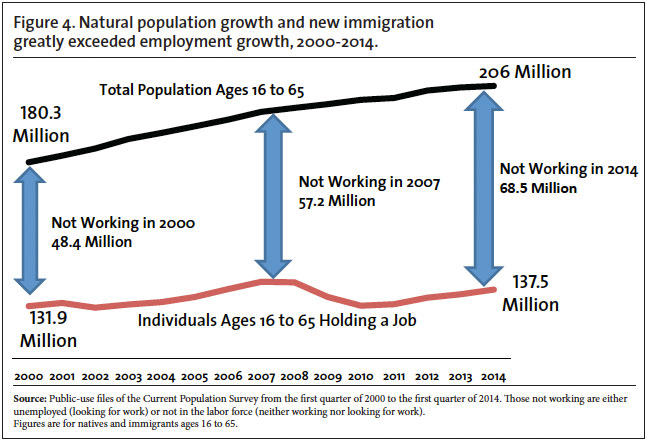
Population Growth Outpaced Job Growth. One way to think about the last 14 years is that employment growth did not come close to matching natural population growth and the number of immigrants allowed to settle in the country — legally and illegally. As a result of immigration policy and natural increase, the total working-age population (immigrant and native) grew 9.4 percent from the economic peak in 2000 to the economic peak in 2007, while the number of working-age people actually employed increased only 6.2 percent. Over the entire 14-year period from 2000 to 2014, the working-age population grew by 25.7 million (about 14 percent), while employment grew only about 4 percent (Table 1, Figure 4). At a basic level, it is this gap between natural population growth and immigration-induced population growth, on the one hand, and employment growth on the other hand that created such a large increase in the number of working-age people, primarily natives, not working. Of course, the gap is only a description of what happened. By itself it does not explain why it happened or provide an answer as to why such a disproportionate share of this gap was absorbed by natives.
New Arrivals
In addition to identifying the native- and foreign-born, the CPS also asks when individuals arrived in the United States. The CPS from the first quarter of 2014 shows that there were 16.8 million immigrants (legal and illegal) who indicated that they had arrived in country in 2000 or later.6 This is a reminder of how large the scale of immigration has been over the last 14 years. It is worth pointing out that the Current Population Survey, like all Census Bureau data of this kind, tends to undercount immigrants generally and new arrivals in particular; therefore, the actual number of new immigrants is higher than the estimates from the CPS.7 It is also worth mentioning that the number of new arrivals is larger because the 16.8 million figure does not include those who arrived after 2000, but left before 2014. If adjusted for undercount, the actual number of new arrivals in the last 14 years is almost certainly more than 17 million.
The Center for Immigration Studies, as well as other researchers, has found that the level of new immigration post-2007 is below the record levels it was a decade ago.8 Even with this decline, in the first quarter of 2014 there were 6.5 million new immigrants in the CPS who indicated they had come in 2008 or later — despite the economy. Of the 6.5 million post-2007 arrivals, about three million were of working age and had a job in 2014. Over the same time period, the number of working-age natives holding a job declined 3.4 million. Although immigration is below its prior peak, the large number of immigrants who arrived 2008 to 2014 is an indication that immigration can remain quite high even in the face of a weak job market. This is because the United States remains a very attractive place for immigrants to settle even during a severe economic downturn. Also, there has been no significant change in U.S. immigration policy, which is among the most generous in the world. Therefore, millions of new immigrants have been allowed to settle in the country since the recession began.
Immigrant Gains by Occupation. Unfortunately, the occupational categories used by the Census Bureau in the CPS were changed significantly between 2000 and 2014, so direct comparisons by occupation are difficult. However, the occupations from 2003 forward are defined in a way that allows some direct comparison with the 2014 data. Table 2 shows the number of working-age immigrants and natives holding a job by broad occupational categories in 2003 and 2014. The table also reports the number of immigrants in 2014 who indicated that they had arrived in 2000 or later by occupation. There were a total of 9.1 million immigrants who arrived in 2000 or later and who were of working age and employed in 2014. The number of working-age immigrants holding a job increased by four million from 2003 to 2014.9 The reason the two numbers are so different is partly because they are for different periods. One shows only 11 years of growth, the other is for 14 years of arrivals. More important, they measure very different things. The four million growth figure represents a net increase; the arrival number is a flow of new immigrants. New arrivals are offset by deaths, return migration, and those who age out of the 16 to 65 cohort. Thus the net increase is substantially less than number of new arrivals.
In terms of the top-five occupations for immigrant employment growth 2003-2014, two might be considered traditionally immigrant and lower-skilled: building cleaning and maintenance and construction and extraction. Three were higher-skilled: management, computers, and healthcare practitioner. But immigrants also made significant gains in more middle-skilled jobs, such as health care support, office and administrative support, and sales. In terms of new arrivals, one out of six found work in just these three middle-skilled occupations. Clearly immigrants took jobs in occupations throughout the economy. All of the occupational categories where immigrants made their biggest gains employ millions of native-born Americans. As we will see, even when we examine occupations at the highest level of detail, it is clear that millions of natives work in the occupations where immigrants are concentrated.
Young Natives Lost Out. Natives have lost jobs in some high-immigration occupations such as production, office and administrative support, construction, architecture and engineering, and transportation and moving. However, one of the key things that happened to natives is that young people, particularly the less educated, have not found jobs over the last 14 years. The population of natives 16 to 29 grew 16.2 percent from 2000 to 2014, but the number working actually declined by 2.6 percent. These new entrants to the labor market are not finding jobs and so the number and share not working has exploded. It is less the case that established older workers have lost jobs, though that has certainly happened as well. But proportionately it is younger native workers who have fared much worse over the last 14 years. What seems to be the case is that as new immigrants arrived, they filled what jobs became available and the employment rate of younger natives fell dramatically.
Ratio of Workers to Non-Workers. Because immigrants mostly arrive young and want to work, the argument is often made that immigration increases the ratio of workers to non-workers, helping to pay for government and improving economic growth. Of course, for this to be true immigrants have to actually work; simply being in the country or of working-age does not improve the share of the population that are workers. In the first quarter of 2014, 46.2 percent (144.3 million) of the nation's total non-institutionalized population of 312.3 million worked. If we remove all of the 16.8 million post-2000 immigrants and their 3.8 million U.S.-born children, 46.3 percent of the population is working.10 This means that immigration in the last 14 years has actually slightly reduced the share of the population that is comprised of workers. One reason immigration over the last 14 years did not improve the share of the population that are workers is that only 55 percent of post-2000 immigrants actually had a job in 2014. This fact, coupled with the children they had after they arrived, who are all too young to work, means that immigration increases the number of workers and the number of non-workers in roughly equal proportions.
By comparison, every one million persons already in the country shifted from not working to working, increased the share of the population that is comprised of workers by 0.3 percentage points. Moving even one million people already here into jobs has a much larger impact than the last 14 years of immigration because it moves people out of one category (non-worker) to another category (worker) — thereby increasing the numerator but not the denominator. Immigrants, on the other hand, arrive at all ages, and, as with any human population, some work and some do not. If we are concerned about not having enough workers to grow the economy or to pay for government, then moving some of the tens of millions of working-age people already here who are not working into jobs is a much more effective way of improving the ratio of workers to non-workers than is immigration.
Why Has All Employment Growth Gone to Immigrants?
A Deterioration for Natives Before 2007. As we have seen, the period 2000 to 2007 was not particularly good for the native-born. The number of natives holding a job increased just 2.9 percent from the first quarter of 2000 to the first quarter of 2007; in contrast the number of immigrants with jobs increased 28.7 percent. The share of working-age natives holding a job was lower at the economic peak in the first quarter of 2007 than the prior peak in the first quarter of 2000. Figure 6 shows that natives 16 to 65 once had a higher employment rate than immigrants, but by 2007 the rate for natives had fallen while it had increased for immigrants. As we will see, other measures of labor force attachment for natives, including the labor force participation rate, the U-6 unemployment rate, and to a lesser extent the U-3 unemployment rate, were all worse in 2007 than 2000 relative to immigrants. Thus when we compare the economic peak in 2000 to the peak in 2007, things were deteriorating for natives, while improving for immigrants.
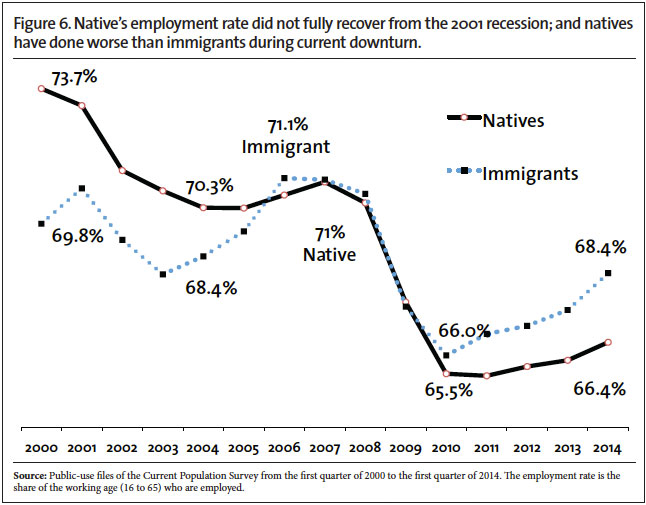
A Faster Recovery for Immigrants. Figure 6 shows that the employment rate for working-age natives declined somewhat more than for immigrants after 2007, hitting a low of 65.5 percent in the first quarter of 2010. The number of working-age natives not working increased by 10.5 million (21.8 percent) from the first quarter of 2007 to the first quarter of 2010, when employment bottomed out. Among immigrants, it increased 17.5 percent over the same time period. Thus, in terms of relative job losses natives were hit somewhat harder by the Great Recession than immigrants (Figure 6 and Table 1).
More important, immigrants have recovered more quickly from the recession than natives. The employment rate for working-age natives has increased only 0.9 percentage points from the bottom of the recession in the first quarter of 2010 to the first quarter 2014, but it has improved 2.4 percentage points for immigrants over the same time period. Since 2010, the number of working-age natives actually working increased just 2.8 percent, while the number of working-age immigrants working increased 11.4 percent. Even in the last year, the employment rate for immigrants increased by a full percentage point, while only increasing half a percentage point for natives. The different ways that the recovery has played out for immigrants and natives partly explains why a disproportionate share of jobs went to immigrants in the long term (Figure 6 and Table 1).
An Aging Immigrant Population. The age profile of immigrants has changed over the last 14 years, but this does not seem to explain why they have done better than natives. The decline in the number of new arrivals in recent years means that fewer young immigrants have been added to the foreign-born population — on average immigrants arrive in their mid to late 20s. As a result, 30 percent of working-age immigrants were 29 or younger in 2000; but only 21 percent were in 2014. Among natives (16 to 65) the share under age 30 has increased slightly since 2000. Young people (immigrant or native) have the lowest employment rates (Tables 3 and 4). Therefore, as the share of working-age immigrants who are young falls, the overall share of working age immigrants with a job should rise.
However, excluding the young still shows that a disproportionate share of employment growth went to immigrants. Natives accounted for 51 percent of the growth in the total population 30 to 65, but only 9 percent of the net increase of employment. The employment rate for natives ages 30 to 65 fell from 2000 to 2007, while it rose slightly for immigrants in this age group. Over the period 2000 to 2014, the employment rate for natives ages 30 to 65 fell 5.5 percentage points, while it declined only 1.4 percentage points for immigrants. Furthermore, the employment rate of immigrants and natives by detailed age cohort in Table 3 shows that immigrants fared better than natives from 2000 to 2007 and from 2007 to 2014 for those in their 30s, 40s, and 50s. (Among those 60 to 65 natives did better.) Thus the decline in the share of immigrants who are young does not explain the pattern of immigrants doing better than natives in terms of employment rates. It also does not explain why a disproportionate share of employment growth has gone to the foreign-born.
Why Immigrants Have Fared Better. There are many possible reasons why immigrants did better than natives in the labor market from 2000 to 2007 and in the recovery from the Great Recession. Perhaps some employers are prejudiced against native-born workers, particularly U.S.-born minorities. Certainly the employment of native-born minorities has declined more profoundly than for native-born whites or for immigrants (Figure 8 and Tables 3, 5, and 8). Moreover, there are ways in which the immigration system makes immigrant workers more attractive than natives. For example, the Summer Work Travel Program (part of the J-1 visa program) allows employers to hire temporary workers without having to make the Social Security and Medicare payments that employers would be required to make on behalf of native-born workers. Another example of the way the immigration system makes foreign workers more attractive to employers is that those who enter under the H1-B visa program cannot change companies easily, making them more captive to their employers. Immigrants may also be more willing to work off the books, for lower pay, or endure worse working conditions than natives, causing employers to prefer them as workers.
Immigrant social networks may tend to shut natives out of jobs because employers come to rely on these networks to fill vacant positions to the exclusion of natives. For example, once an employer has a few immigrant workers, he may become less likely to advertise jobs widely, preferring instead to use the informal network of his immigrant workers' friends and families to fill positions. Immigrants may also be more mobile. By coming to this country, immigrants almost always see substantial improvement in their standard of living, no matter where in the United States they settle. This may make them more willing to move wherever there is job growth in the United States. Natives, on the other hand, may need significant wage incentives to move, which, because of the availability of immigrant labor, businesses are unwilling to offer. All of these factors, and perhaps others, likely explain why so much of the limited employment growth in the last 14 years has gone to foreign-born workers.
Labor Force Participation
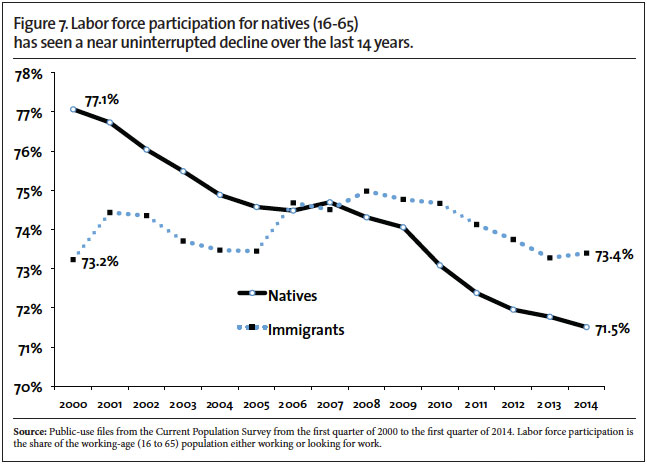
Rate for the Working-Age. The labor force participation rate is similar to the employment rate except that it is calculated by including unemployment in the numerator. To be considered as participating in the labor market, one has to either be working or have looked for a job in the four weeks before the survey was taken. The number of working-age (16 to 65) natives not in the labor market has increased from 35.7 million in 2000 to 42.1 million in 2007 to 49.2 million in 2014. Thus, 13.5 million (79 percent) of the 17 million increase in the number of working-age natives not working from 2000 to 2014 is due to an increase in the number not in the labor force rather than an increase in unemployment (Figure 9). The share of working-age natives in the labor force shows a steady deterioration, from 77.1 percent in 2000 to 74.7 percent in 2007 to 71.5 percent in 2014 (Figure 7, Table 9). Perhaps most shocking, the rate has actually gotten worse for working-age natives since the jobs recovery began in 2010. This means that the decline in the unemployment rate in recent years is being driven to a significant extent by an increase in the number of working-age natives leaving the labor market and not by an increase in the number getting a job. We can see this clearly in Table 1 because the number of working-age natives not in the labor force is 3.4 million larger in the first quarter of 2014 than in first quarter of 2010.
Among working-age natives, labor force participation is the lowest it has been since the CPS began identifying immigrants and natives in 1994. The long-term decline in the labor force participation of working-age natives shown in Figure 7 is profound and troubling. It would seem to be powerful evidence that there is no labor shortage.
Immigrants follow a somewhat different pattern than natives. From 2000 to 2007 their labor force participation rate generally improved. Like the employment rate discussed at length in this report, the labor force participation rate of working-age immigrants went from being substantially lower than natives in 2000 to be being somewhat higher by 2007. After 2007, the labor force participation rate of working-age immigrants did not decline as profoundly as it did for natives. But it is still lower now than it was in 2010 when employment bottomed out. Unlike natives, it did slightly improve over the last year (Figure 7, Table 9). Despite this tiny improvement among immigrants in the last year, the labor force participation rate of immigrants is still at or near a 14-year low.
When Will the Employment Rate Recover?
Between 2011 and 2014 the employment rate of working-age natives improved one percentage point — about one-third of a percentage point a year on average. In the last year it improved 0.5 percentage points (Figure 6, Table 3). If we optimistically assume a 0.5 percentage-point improvement each year moving forward it would take nine years (until 2023) for the employment rate for natives to return to the 2007 level. For the native employment rate to return to the 2000 level, it would take five more years, to 2028. If there is another recession before either date, which given the average length between recessions in the post-war WWII period seems almost certain, then the rate will fall again, never having returned to the prior peak. As for the labor force participation rate for working-age natives, since there has been no improvement in recent years there is no positive trend to extrapolate. Furthermore, given that the labor force participation for natives shows an almost uninterrupted 14-year decline (Figure 7, Table 9), it seems unlikely that labor force participation will ever return to the 2007 or 2000 level, particularly if immigration stays at its current level.
Despite the enormous number of working-age people not working and the seeming impossibility of the employment rate or labor force participation rate returning to their prior levels, many still argue there is or soon will be a labor shortage. Former vice presidential candidate and prominent Republican congressman Paul Ryan (R-Wisc.) has defended the Schumer-Rubio bill (S.744) and its large increases in future legal immigration on the grounds that the country is going to have "labor shortages" in the future.11 As already discussed, numerous businesses and business associations have argued for increases in both skilled and "lesser-skilled" workers allowed into the country on the grounds that there are not enough Americans available to fill such jobs. Testifying for the Essential Worker Immigration Coalition before the House Subcommittee on Workforce Protections in June 2013, Laura Reiff argued that, "employers are experiencing persistent and recurring job openings." She called for the creation of new visa programs to increase the number of guestworkers allowed into the country. She did so even though she stated that Americans are, "participating at lower rates in the workforce." But for her this was justification for increasing immigration further.12 While the view that workers of every type are in short supply may be common in Washington, the data collected by the government do not support this conclusion.
Age, Race, and Education
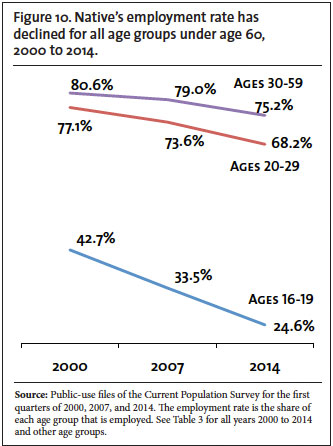
Broad Decline by Age. If we divide the population by different age groups, we still find the same decline in the share holding a job. Among young natives 16 to 24 years old the share holding a job was 12.4 percentage points lower in 2014 than it was in 2000. In 2000, nearly 58 percent of this age group worked; today it is just slightly above 45 percent. Looking at the employment rate for those 20 to 29 shows an 8.9 percentage-point decline from 2000 to 2014. If we examine young workers (20 to 29) by education we also find an across-the-board decline in work, with the least educated the most affected (Table 7). The decline in the employment rate for younger natives under age 30 was larger than the 7.3 percentage-point decline for all working-age natives (Figure 10, Tables 3 and 4). Thus there is no question that young natives have been harder hit by the relatively weak economy 2000 to 2007 and the Great Recession.
Immigrants are new entrants into the labor market and most natives begin their working-life in their teens and 20s. It is likely that if immigration is reducing the job prospects for natives, younger natives would be more adversely affected. Older workers who are more established in the labor market are less likely to be impacted by new arrivals. The fact that those under 30 have seen a larger decline in their employment rates is certainly consistent with the possibility that immigration explains a significant share of the decline in work among this population. As already discussed, as new immigrants arrived they filled what jobs became available and the employment picture for young natives deteriorated significantly.
Although younger workers experienced the biggest decline in work, older workers have also had a difficult time in the labor market. The employment rate for natives in their 30s, 40s, and 50s all declined as well. In terms of the 17 million increase in the number of working-age natives not employed, slightly less than half were among those under age 30. This means a disproportionate share of job losses were absorbed by the young because they account for less than half of all working-age people. Nonetheless, more than half of the decline was among workers 30 and older (Figure 10, Tables 3 and 4). In short, native employment declined across virtually every age group.13
Young Natives Still Have Higher Rates of Work. We often worry in the United States about the work ethic of our young people. In private, many advocates for immigration will argue that immigrants have a better work ethic than natives, especially younger natives. However, as Table 3 shows, teenage immigrants (16 to 19) are actually less likely to hold a job than natives of the same age. This was the case in 2014 and in 2000. The same is true for those 16 to 24, though the difference is smaller. Of those in their 20s, natives again have a higher employment rate. No matter how we define "young", natives have a higher employment rate than immigrants. It is true that the share of young people holding a job is low relative to older age groups. Moreover, the employment rate has declined somewhat more for young natives than young immigrants. But Table 3 makes clear that young natives are still more likely to work than young immigrants. Therefore, if there is a work ethic problem among young natives in 2014, then the problem is even more pronounced among young immigrants, at least when measured by rates of work.
Long-Term Effect of Young People Not Working. In some ways the decline in work among the young is the most troubling because there is good evidence that not working when one is young has significant negative impacts on individuals' long-term employment patterns. Research indicates that those who do not work in their youth often do not develop the skills and habits necessary to function well in the labor market, such as respecting authority, showing up on time, and following instructions. The very large decline in work among those under age 30 may have significant long-term negative consequences for those individuals as they age.14 The failure of young people to gain work experience earlier in their adult lives may also have negative implications for the larger American society.
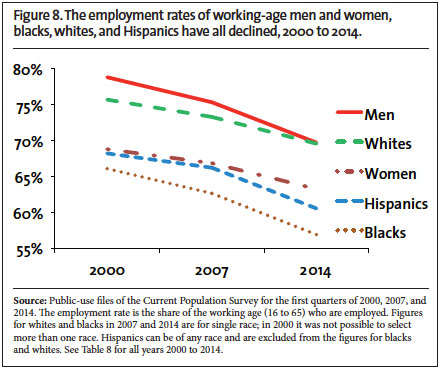
Broad Decline by Race. Black Americans have long had lower employment rates than other groups. But the last 14 years show that the employment rate for working-age, native-born blacks declined 9.2 percentage points, compared to 6.1 percentage points for whites and 7.7 percentage points for native-born Hispanics. Because they had lower rates of work than native-born whites in 2000 and because their rates declined more steeply, the gap in employment rates between native-born blacks and Hispanics on the one hand and whites on the other hand is now wider than it was in 2000 (Figure 8 and Table 8).
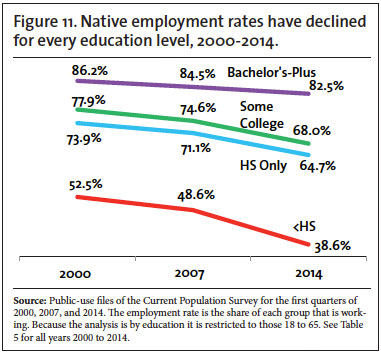
Broad Decline by Education. The employment rate of native-born high school dropouts, high school graduates, those with some college, and those with at least a bachelor's degree all declined from 2000 to 2007 and from 2007 to 2014. (Education figures are only for those 18 to 65.) While the decline in the share working has been more pronounced for those with a high school education or less, even the working share of natives with at least a bachelor's degree was lower in 2007 than in 2000. Thus, the broad decline in work began before the Great Recession. The share of those with at least a bachelor's degree working declined from 86.2 percent in the first quarter of 2000 to 84.5 percent in the first quarter of 2007, even though those were the peak years of the last expansions. In the first quarter of 2014 it was only 82.5 percent (Figure 11 and Table 5).
As the share not working has increased, the number not working has also increased for all educational groups. The number of adult natives (18 to 65) with no more than high a school education not working was 4.2 million larger in first quarter of 2014 than at the start of 2000; the number with some college not working was up 7.1 million; and the number with at least a bachelor's degree not working was up 3.6 million. In the first quarter of 2014 there were a total of 42 million adult natives 18 to 65 without a bachelor's degree not working and nearly nine million with at least a bachelor's degree not working (Table 6). The potential supply of workers for employers to draw upon at every education level is seemingly very large.
It should be noted that the total size of the working-age native population with less than a high school education (working and not working) declined 3.6 million. But the share working declined so much there was still an increase in the number not working from 2000 to 2014. Among immigrants, the total number of adults with less than a high school education not working peaked in 2007 and has declined since; though the total number is still higher than in 2000. Most of the employment growth among immigrants was among those with at least a high school education.
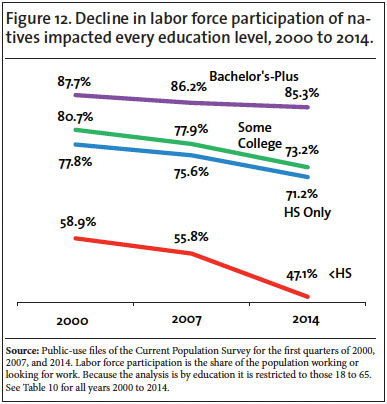
Labor Force Participation. In addition to the decline in the employment rate among the working-age by education, we see a similar broad decline in labor force participation across education levels. Like the employment rate, the decline is most pronounced for the less-educated, who already had the lowest rates of labor force participation. For example, the labor force participation rate for natives with less than a high school education declined from 58.9 percent in the first quarter of 2000, to 55.8 percent in the first quarter of 2007, and to 47.1 percent in first quarter of 2014. For natives with only a high school education, the rate declined from 77.8 percent in 2000, to 75.6 percent in 2007, and to 71.2 percent in 2014. For those with at least a bachelor's degree it declined from 87.7 percent in 2000, to 86.2 percent in 2007, and to 85.3 percent in 2014. Like the decline in employment rates, the decline in labor force participation is long-term and preceded the Great Recession. Furthermore, there is no clear evidence of even a small improvement in the labor force participation rate of working-age natives after the Great Recession as there is with employment rate (Figure 12, Tables 9 and 10).
Trends in Unemployment
One of the most common measures of labor force attachment is the unemployment rate. To be identified in the CPS as unemployed, a person must indicate that he or she is not working, but has looked for a job in the last four weeks. Unlike the unemployment rate, the employment rate discussed above or the labor force participation rate will not show an improvement simply because people stop looking for work and leave the labor force entirely. In our view, this makes them better measures of long-term trends in the labor market. However, the unemployment rate is also important to consider.
Unemployment (U-3). There are several ways to measure unemployment. The most common is referred to by the Bureau of Labor Statistics (BLS) as the U-3 measure and is the standard unemployment rate reported each month (and widely discussed in the media). The U-3 unemployment rate is calculated by simply dividing the number of people who report that they looked for work in the prior four weeks by the number working plus the number who have looked for work. The U-3 measure excludes those who are not working and would like to do so, but have not looked for a job in the last four weeks. Unemployment measured in this way is highly cyclical, rising and falling with the expansion and contraction of the economy.
Among working-age natives, unemployment rose after the 2001 recession and then fell with the recovery, but by the last economic peak in 2007 it had not quite returned to the 2000 level. After 2007 it rose significantly and has now fallen, though it remains well above the level in 2007 or 2000. Working-age immigrants follow a similar pattern; however their rate was slightly lower in 2007 than in 2000. Moreover, their rate increased somewhat more during the Great Recession and recovered somewhat faster afterwards (Table 9).
Unemployment (U-6). The broadest measure of unemployment used by the BLS is referred to as U-6. It includes those counted in U-3 unemployment plus those who indicate that they are available for jobs and have looked for work in the past 12 months, and those who want full-time work, but have to settle for part-time work.15 The U-6 rate for working-age natives was somewhat higher in 2007 than in 2000, and went up dramatically after 2007. The rate has been fallen steadily since 2010, though the number of natives who are U-6 unemployed was still 5.6 million above the 2007 level in the first quarter of 2014 and 7.3 million higher than it was in the same quarter of 2000 (Table 9).
Two points should be made about U-6 employment. First, like U-3 unemployment, to be considered unemployed one has to express interest in working. Second, despite the recent improvement in U-6 unemployment, at the current rate of decline U-6 unemployment will not return to the 2007 level until 2018 and it would take until 2020 to get back to the 2000 level for working-age natives. Of course this assumes that there is not another recession sometime in the next six years, which given the average period between recessions in post-war America seems likely.
Part-Timers Who Want Full-Time Work. As mentioned above, the U-6 measure includes those who are working part-time but want and cannot find full-time work. In the first quarter of 2014, there were 5.7 million part-time working-age natives without full-time work looking for it. While the number has declined some in recent years, it is still more than twice the number in the first quarter of 2000 and 40 percent above the 2007 number. These workers have varying degrees of education. Half a million of them are high school dropouts, more than two million have only a high school education, nearly two million have some college, and over a million have at least a bachelor's degree.
These 5.7 million part-time working-age natives looking for full-time work must be added to the 58 million working-age natives not working when discussing the enormous supply of unused or under-utilized labor in the United States. To this number can be added the 10.5 million working-age immigrants not working and 1.6 million immigrants working part-time who want full-time work. In total, there are nearly 76 million working-age people (immigrant and native) either not working or working part-time, but looking for full-time work. These figures are truly enormous and represent an increase of more than 24 million since 2000. All of these numbers fundamentally challenge the argument that there is a labor shortage in the United States that must be satisfied by bringing in additional immigrant workers as contemplated by S.744 and similar proposals.
Competition for Jobs
Prior Research. There is good research indicating that immigration negatively impacts native employment. In a 2010 article, Borjas, Grogger, and Hanson found that immigration reduces the employment of less-educated black men and increases their rate of incarceration.16 Their conclusions are similar to those of a 2010 academic study by Shihadeh and Barranco, which found that "Latino immigration raises black violence by first increasing black unemployment."17 These findings are supported by earlier work done by Kposowa (1995), which also showed that immigration reduced black employment.18
Other academic studies have also found that immigration reduces job opportunities for natives. In its 1997 study of California, the Rand Corporation concluded that in that state alone competition with immigrants for jobs caused between 128,200 and 194,000 native-born workers in the state to withdraw from the workforce.19 A more recent analysis by Federal Reserve economist Christopher Smith (2012) found that immigration reduces the employment of U.S.-born teenagers.20 This is consistent with work by Sum, Harrington, and Khatiwada (2005) showing that immigration has a significant negative impact on the employment of younger workers.21 The Congressional Budget Office cost estimate for the Gang of Eight immigration bill (S.744) indicates that just the increases in legal immigration in the bill will increase unemployment by about 150,000 through the year 2020.22 Although there is evidence that immigration reduces employment opportunities for natives, there remains a debate among economists about the extent of the job displacement. Putting aside the research, we can say without dispute that the very high level of immigration from 2000 to 2014 coincided with a long-term decline in the employment rate and labor force participation rate of the native-born.
Job Americans Don't Do? As we have seen in Table 2, immigrants made gains across the labor market. Looking at broad occupations as shown in that table makes clear that there are tens of millions of natives employed in the occupational categories where immigrants have found jobs in the last 14 years. Thus, part of the reason immigration is likely to adversely impact the employment of some natives is that, contrary to the assertion of some, immigrants often do the same jobs. In an earlier report we examined all 472 civilian detailed occupations as defined by the Department of Commerce. We found only six were majority immigrant (legal and illegal). These six occupations account for 1 percent of the total U.S. workforce. Many jobs often thought to be overwhelmingly immigrant are in fact majority native-born. For example, 51 percent of maids and housekeepers are U.S.-born, as are 63 percent of butchers and meat processors. It is also the case that 64 percent of grounds maintenance workers are U.S.-born, as are 66 percent of construction laborers and 73 percent of janitors.23 It is simply not the case that there are jobs that Americans do not do.
Conclusion
Over the last 14 years employment growth has not come close to matching natural population growth and the number of immigrants allowed to settle in the country — legally and illegally. What employment growth there has been has all gone to immigrants. This is the case even though natives accounted for two-thirds of the growth in the working-age population (16 to 65). Though there has been some modest recovery from the Great Recession, there were still fewer working-age natives holding a job in 2014 than in 2000; and the number not working was 17 million larger in the first quarter of 2014 than in the first quarter of 2000.
With a near-record 58 million natives of working-age (16 to 65) not working and 10.5 million working-age immigrants not working, there would seem to be an enormous supply of potential workers already in the country. Although there has been a slight recovery in recent years among natives, the employment rate (share actually working) shows a long-term decline over the last 14 years. The share of natives holding a job is well below the level in 2007 or 2000 for virtually every education level, race, gender, and age. Equally important, the labor force participation of natives (share working or looking for work) shows no improvement at all since the jobs recovery began. If employers are looking for college graduates; young workers; less-educated workers; older, more experienced workers; or practically any other type of worker, the potential supply would seem to be enormous.
Some may think that immigrants and natives never compete for jobs. But a majority of workers in virtually every occupation are native-born. Immigrants have made gains across the labor market in lower-, middle-, and higher-skilled jobs. Thus the idea that there are jobs Americans don't do is simply not supported by the data.
While the extent to which immigrants displace natives from the labor market is debated in the academic literature, there are several things we can say based on the last 14 years. More than one million new immigrants arrived in the country every year since 2000. The long-term decline in employment among natives is certainly supportive of the research showing that immigration reduces employment among the native-born. In contrast, the last 14 years challenge the argument that immigration on balance significantly increases job opportunities for natives. There is no question that immigration has not stimulated the economy enough to create job growth among working-age natives and prevent a dramatic decline in employment rates and labor force participation. There is certainly no question that high levels of immigration go hand in hand with a profound deterioration in native-born employment.
Even if one ignores the last 14 years and believes that immigration stimulates the economy to create a net increase in jobs for natives, then the same should be true when natives are added to the workforce by moving from not working to working. Some may respond that natives do not want to work. But the U-6 employment rate indicates that millions not working do, in fact, want to work. There is also anecdotal evidence that many natives simply have given up looking for work because the job market is so bad. When this happens, they cease to show up in the U-3 or even the U-6 unemployment rate. Moreover, many natives currently not working were doing so as recently as 2007. Given the abysmal employment and labor force participation rates, particularly of the native-born, it is difficult to take at face value assertions by employer groups that workers are in short supply or to justify the dramatic increase in immigration levels in the Schumer-Rubio bill (S.744).
Data and Methods
The two primary employment surveys collected by the United States government are referred to as the "household survey" (also called the Current Population Survey or CPS) and the "establishment survey". The establishment survey asks employers about the number of workers they have. In contrast, the CPS asks people at their place of residence if they are working. While the two surveys show the same general trends, the figures from the two surveys do differ to some extent.
Because it asks workers about their employment situation, only the CPS provides information about who is working, who is looking for work, and who is not working or looking for work. Moreover, only the CPS asks respondents about their socio-demographic characteristics such as their race, education level, age, citizenship, and year of arrival in the United States. Thus the CPS can be used not only to compare employment growth among immigrants and the native-born, it can also be used to examine the share of different groups who are employed or unemployed or to make comparisons about any other measure of labor force attachment. For these reasons, this analysis uses the public-use files of the CPS to examine employment in the United States by quarter.24
Weighting the Data. Like all Census Bureau surveys the CPS is weighted to reflect the size and composition of the nation's population. While the CPS is the primary source of data on the U.S. labor market, there are breaks in the continuity of the survey and this could slightly impact comparisons over time. This is due to periodic re-weighting done by the Census Bureau to better reflect what it believes is the actual size of the U.S. population, such as after the decennial census. Any long-term study of poverty, wages, health insurance, and other socio-demographic characteristics that examine trends over several years can be slightly affected by reweighting. This issue exists with all government surveys, including the CPS. However, the reweighting effects both the native and immigrant populations and is done to make the data more accurate as new information becomes available. We only use the weights provided by the government; we do not adjust the weights on our own in any way.
Revised Weights 2000 to 2002. For 2000 to 2002 we use the revised weights that were issued by the Census Bureau after the 2000 Census revealed that the original weights assigned to the CPS were too low — mainly because the Bureau had underestimated immigration.25 If we use the original weights it does not meaningfully change the results. The original weights show an immigrant working-age population that is about 6 percent smaller in 2000 than using the revised weights. The impact on the totals for natives is small. The original weights show 16 million working-age immigrants holding a job in 2000 and an employment rate of 69.5 percent. The Bureau's revised weights (Table 1 and Figure 3) show 17.1 million working and an employment rate of 69.8 percent in 2000. If we used the smaller original weights, then the number of immigrants working over the last 14 years is 6.9 million, rather than the 5.7 million gain reported throughout this report. (For working-age natives, no matter what weights are used the number working still declined about the same amount from 2000 to 2014.) Using the Bureau's revised weights slightly lowers the immigrant employment gain.
In our view, and the view of most immigration researchers, using the revised weights makes the data slightly more accurate and improves the continuity of the data. But using them or not has no impact on the conclusions of this report.
Tables
Table 1. Labor Force Status of Natives and Immigrants, 2000 to 2014 (thousands)
Table 2. Native and Immigrant Employment by Occupational Category
Table 3. Share of Natives and Immigrants Working by Age 2000 to 2014
Table 4. Number of Natives and Immigrants Working and Not Working, by Age, 2000-2014
Table 5. Employment Rates for Natives and Immigrants by Race and Education, 2000-2014
Table 6. Number of Natives and Immigrants Working and Not Working by Education, 2000-2014
Table 7. Native Employment Rate, 20 to 29, by Education Level, 2000-2014
Table 8. Native Employment Rate (16-65) by Gender and Race, 2000-2014
Table 11. Number of Natives 16 to 65 Working and Not Working by Race, 2000 to 2014
Table 12. Labor Force Participation Rate by Age
End Notes
1 "S. 744 Border Security, Economic Opportunity and Immigration Modernization Act", Congressional Budget Office cost estimate. Table 2, p. 14 reports that by 2023 there will be 10.4 million additional U.S. residents if the bill passes, 1.2 million of whom will be the U.S.-born children of these new immigrants who will enter the country if the bill passes.
2 The National Restaurant Association's position on the need for more foreign workers can be found here. The National House Builders Association letter on S.744 can be found here. Its general view on the need for more immigration can be found here and here. The National Association of Manufacturers' letter on S.744 can be found here. Its general views on the need for more immigrant workers can be found here. This report provides an overview of the Business Roundtable's call for increasing immigration. The Chamber of Commerce's press releases, testimonies, and reports on immigration can be found here. Statements by the Chamber's president on the need to increase immigration can be found here and here. The Agriculture Workforce Coalition includes most of the major associations representing farmers, landscapers, nurseries, and horticulture. Here is a report put out by the Coalition on need for more workers. Here is the Coalition's statement on S.744. Compete America is a prominent coalition primarily of technology companies and related associations that have lobbied for S.744 and other increases in higher skilled immigrants.
3 Table 1 reports employment for working-age (16 to 65) immigrants and natives for every quarter since 2000. It also reports the number of people working age 16 and older. Comparing the first quarter of 2000 to the same quarter in 2014 for the working-age shows that all of the employment growth has gone to immigrants. However, looking at all workers 16-plus shows that natives over age 65 did make employment gains. As a result, there are 2.6 million more natives of all ages working in 2014 than in 2000. The employment gains for immigrants 16-plus are basically about 500,000 above the level when we look at 16- to 65-year-olds. Thus natives did make some employment gains, but it was entirely among those over age 65.
4 To clarify, not all individuals ages 16 to 65 wish to work, but the overwhelming majority of American workers (immigrant or native) are drawn from this age group.
5 We do not use the "establishment survey", which measures employment by asking businesses, because that survey is not available to the public for analysis. Equally important, it does not ask if an employee is an immigrant.
6 This is figure is from the public-use files of the Current Population Survey for January, February, and March 2014. The survey asks immigrants when they came to the United States. The figure includes both legal and illegal immigrants.
7 The Department of Homeland Security estimates an undercount of post-1980 immigrants (foreign-born) in the American Community Survey, which is similar to the CPS, of 5.8 percent. See Table 2 in "Estimates of the Unauthorized Immigrant Population Residing in the United States: January 2012".
8 See Steven A. Camarota and Karen Zeigler, "A Shifting Tide: Recent Trends in the Illegal Immigrant Population", Center for Immigration Studies, July 2009; Steven A. Camarota and Karen Zeigler, "Homeward Bound: Recent Immigration Enforcement and the Decline in the Illegal Alien Population", Center for Immigration Studies, July 2008; Jeffrey Passel, D'Vera Cohn and Ana Gonzalez-Barrera, "Net Migration from Mexico Falls to Zero—and Perhaps Less", Pew Hispanic Center, April 23, 2012. See Table 3 in Michael Hoefer, Nancy Rytina and Bryan Baker, "Estimates of the Unauthorized Immigrant Population Residing in the United States: January 2011", DHS Office of Immigration Statistics, March 2012.
9 As already discussed, if we use 2000 as a starting point, the number of immigrants working increased by 5.7 million.
10 These figures come directly from the Current Population Survey for the first quarter of 2014. The total non-institutionalized population figures from the CPS do not include the roughly four million people in institutions such as nursing homes and prisons. We estimate the number of children born to post-2000 immigrants by looking at immigrant families that arrived in 2000 or later and counting the number of U.S.-born children in those families age 14 or younger.
11 A recording of Rep. Ryan's June 19, 2013 interview on the Laura Ingraham Show can be found here.
12 "Statement Before The House Education and the Workforce Committee", March 14, 2013.
13 It should be pointed out that the only age group of natives under age 66 that has seen an improvement in their employment rate is those ages 60 to 65 (see Tables 3 and 4). Also natives over age 65 increased their employment by 2.6 million between 2000 and 2014.
14 For a review of this literature see pp. 4-5 in "Immigration and the Long-Term Decline in Employment Among U.S.-Born Teenagers", Center for Immigration Studies, May 2010.
15 The Bureau of Labor Statistics' detailed explanation of the U-6 measure can be found here.
16 George J. Borjas, Jeffrey Grogger, and Gordon H. Hanson, "Immigration and the economic status of black men", Economica 77, pp. 255-282, 2010.
17 Edward S. Shihadeh and Raymond E. Barranco, "Latino Employment and Black Violence: The Unintended Consequence of U.S. Immigration Policy Social Forces", Social Forces, Vol. 88, No. 3, March 2010, pp. 1393-1420.
18 Augustine J. Kposowa, "The Impact of Immigration on Unemployment and Earnings Among Racial Minorities in the United States." Racial and Ethnic Studies, Vol. 18, 1995.
19 Kevin F. McCarthy and Georges Vernez, "Immigration in a Changing Economy: California's Experience", Rand Corporation, 1997.
20 Christopher L. Smith, "The Impact of Low-Skilled Immigration on the Youth Labor Market", Journal of Labor Economics, Vol. 30, No. 1, January 2012, pp. 55-89.
21 Andrew Sum, Paul Harrington, and Ishwar Khatiwada, "The Impact of New Immigrants on Young Native-Born Workers, 2000-2005", Center for Immigration Studies, September 2006.
22 The CBO states that the increase in legal immigration forecast as a result of S.744 would increase unemployment by .1 percent (150,000) in a labor force of 150 million. See pp. 9-10 of the CBO report, "The Economic Impact of S. 744, the Border Security, Economic Opportunity, and Immigration Modernization Act".
23 See Steven Camarota and Karen Zeigler "Are There Really Jobs Americans Won't Do? A detailed look at immigrant and native employment across occupations", Center for Immigration Studies, May 2013.
24 For each quarter the CPS includes roughly 355,000 natives and 44,000 immigrants. The survey is then weighted to reflect the actual size of the U.S. population.
25 For a technical discussion of why the Census Bureau believed the re-weighting improved the data, see Mary Bowler, Randy E. Ilg, Stephen Miller, Ed Robison, and Anne Polivka, "Revisions to the Current Population Survey Effective in January 2003", Bureau of Labor Statistics.