Download a PDF of this Backgrounder.
Can the Wall Pay for Itself?: An Update
Even Cato Agrees: A Border Wall Can Pay for Itself
Steven A. Camarota is the director of research at the Center for Immigration Studies.
The findings of this analysis show that if a border wall stopped a small fraction of the illegal immigrants who are expected to come in the next decade, the fiscal savings from having fewer illegal immigrants in the country would be sufficient to cover the costs of the wall. This analysis takes the likely education level of illegal border-crossers and applies fiscal estimates developed by the National Academies of Sciences, Engineering, and Medicine (NAS) for immigrants by education level. NAS calculates the future fiscal balance immigrants create — taxes paid minus costs. NAS reports fiscal balances as "net present values", which places a lower value on future expenditures than on current expenditures.
Based on the NAS data, illegal border-crossers create an average fiscal burden of approximately $74,722 during their lifetimes, excluding any costs for their U.S.-born children. If a border wall stopped between 160,000 and 200,000 illegal crossers — 9 to 12 percent of those expected to successfully cross in the next decade — the fiscal savings would equal the $12 to $15 billion cost of the wall.1
Among the findings:
- There is agreement among researchers that illegal immigrants overwhelmingly have modest levels of education — most have not completed high school or have only a high school education.
- There is also agreement that immigrants who come to America with modest levels of education create significantly more in costs for government than they pay in taxes.
- A recent NAS study estimated the lifetime fiscal impact (taxes paid minus services used) of immigrants by education. Averaging the cost estimates from that study and combining them with the education levels of illegal border-crossers shows a net fiscal drain of $74,722 per illegal crosser.2
- The above figures are only for the original illegal immigrants and do not include any costs for their U.S.-born descendants. If we use the NAS projections that include the descendants, the fiscal drain for border-crossers grows to $94,391 each.
- If a border wall prevented 160,000 to 200,000 illegal crossings (excluding descendants) in the next 10 years it would be enough to pay for the estimated $12 to $15 billion costs of the wall.
- Newly released research by the Institute for Defense Analyses (IDA) done for the Department of Homeland Security indicates that 170,000 illegal immigrants crossed the border successfully without going through a port of entry in 2015.3 While a significant decline in crossings from a decade ago, it still means that there may be 1.7 million successful crossings in the next decade. If a wall stopped just 9 to 12 percent of these crossings it would pay for itself.
- If a wall stopped half of those expected to successfully enter illegally without going through a port of entry at the southern border over the next 10 years, it would save taxpayers nearly $64 billion — several times the wall's cost.
Important Caveats and Observations About These Estimates
- In addition to crossing the border surreptitiously, aliens join the illegal population primarily by overstaying a temporary visa. A southern border wall would not address this part of the illegal flow.
- A large share of the net fiscal cost of illegal immigrants is at the state and local level, not the federal level. The costs of building the wall will be borne by the federal government.
- To create its long-term fiscal estimates for immigrants by education level, the NAS uses the concept of "net present value" (NPV). This concept, which is commonly used by economists, has the effect of reducing the size of the net fiscal drain that unskilled immigrants will create in the future. The NAS does this because costs or benefits years from now are valued less in economics relative to more immediate costs. But this means the actual net lifetime fiscal cost of illegal border-crossers, given their education levels, is possibly $140,000 to $150,000 each in their lifetimes if the NPV concept is not used.4
Methodology
The Importance of Educational Attainment. There is a good deal of agreement among researchers that the education level of immigrants is a key factor in determining their net fiscal impact. As a recent study by the NAS states, the education level of arriving immigrants is one of the "important determinants" of their fiscal impact.5 This finding is similar to a 1997 study by NAS that also examined the fiscal impact of immigrants.6 This conclusion also is mirrored by a 2013 study from the Heritage Foundation. Referring to the education level of household heads, Heritage concluded that "Well-educated households tend to be net tax contributors." But at the same time, "Poorly educated households, whether immigrant or U.S.-born, receive far more in government benefits than they pay in taxes."7 My own research has come to the same conclusion.8 The reason for this is straightforward: Those with modest levels of education tend to earn low wages in the modern American economy, and as a result tend to make low tax payments and often qualify for means-tested programs. The less educated are a net fiscal drain, on average, regardless of legal status or if they were born in the United States or a foreign country.
Education Levels of Illegal Immigrants. In terms of the educational attainment of illegal immigrants, there is a good deal of evidence that they have modest levels of education, much lower than native-born Americans or legal immigrants. The Heritage study discussed above estimated that, on average, illegal immigrants have 10 years of schooling. My own analysis for all illegal immigrants (visa overstayers and illegal border-crossers together) is that 54 percent of adults have not completed high school, 25 percent have only a high school degree, and 21 percent have education beyond high school.9 The Pew Research Center has estimated that of all adult illegal immigrants, 47 percent have not completed high school, 27 percent have only a high school education, 10 percent have some college, and 15 percent have a bachelor's degree or more.10 These figures are for all illegal immigrants, including those who overstayed a temporary visa, not just illegal border-crossers.
Education Level of Border-Crossers. Since the border wall would by definition only impact the flow of those who cross the border illegally and not those who overstay a temporary visa or are smuggled into the country, it is necessary to estimate the education level of illegal border-crossers separately. Illegal crossers tend to be the least educated component of illegal immigration because they are mostly from Latin America and because more educated foreign nationals wishing to come to the United States can often qualify for a temporary visa, which they can then overstay.11 For example, a person with few years of schooling, a low paying job, and no property in their home country is not likely to qualify for a tourist visa or other temporary visitor visa. American consulates overseas would typically deny such a person a tourist visa (B2) or business traveler visa (B1) because the assumption is that such persons may be coming to stay permanently. They are "intending immigrants" in the terminology of the consular service. This is especially true for the primary sending countries of illegal immigration, which are all developing countries.12 A more educated person is much more likely to qualify for a tourist visa, or for that matter a guestworker visa or a student visa, which they can then overstay.
Because illegal border-crossers are overwhelmingly from Mexico and the rest of Latin America, we use the education level of illegal immigrants from Latin America to estimate border-crossers' education profile. My analysis of illegal immigrants from Latin America indicates that they have the following education: 57 percent, less than high school; 27 percent, high school only; 10 percent, some college or associate's degree; 4 percent, bachelor's only; and 2 percent, more than a bachelor's.13 These educational levels provide a baseline for estimating the fiscal impact of illegal crossers. However, as we will see, even if we use somewhat different estimates of education, the fiscal impact of illegal border-crossers is still large and negative.
Fiscal Impact by Education Level. The 2016 NAS study mentioned above projected the lifetime fiscal impact (taxes paid minus services used) of immigrants by education. These estimates are expressed as a net present value. This is a concept used in fiscal studies to express the sum total of costs or benefits over long periods of time — in this case a lifetime. NPV represents the fiscal balance (taxes paid minus costs) if we had to spend the money today. Later in this report we discuss in more detail the concept of net present value, both its usefulness and it shortcomings.
In addition to the original immigrant, the NAS study also has separate estimates for the descendents of immigrants over 75 years.14 In this analysis we focus only on the fiscal impact of the original immigrant. The tax payments and costs created by the descendants of immigrants over 75 years are speculative, whereas the estimates for the original immigrants are more grounded in current reality. The NAS study does not report separate estimates for illegal and legal immigrants. Rather, they simply estimate tax payments and expenditures on immigrants as they appear in Census Bureau data, primarily the Current Population Survey Annual Social and Economic Supplement. As result, the education estimates from the NAS are for both legal and illegal immigrants.
The NAS fiscal projections include eight different scenarios, each with different assumptions about future spending, tax rates, and the future flow of immigrants. It is not entirely clear what set of fiscal assumptions are best, and the NAS study itself does not identify the one best scenario. In Table 1 we simply take all eight scenarios and average them together by education level.
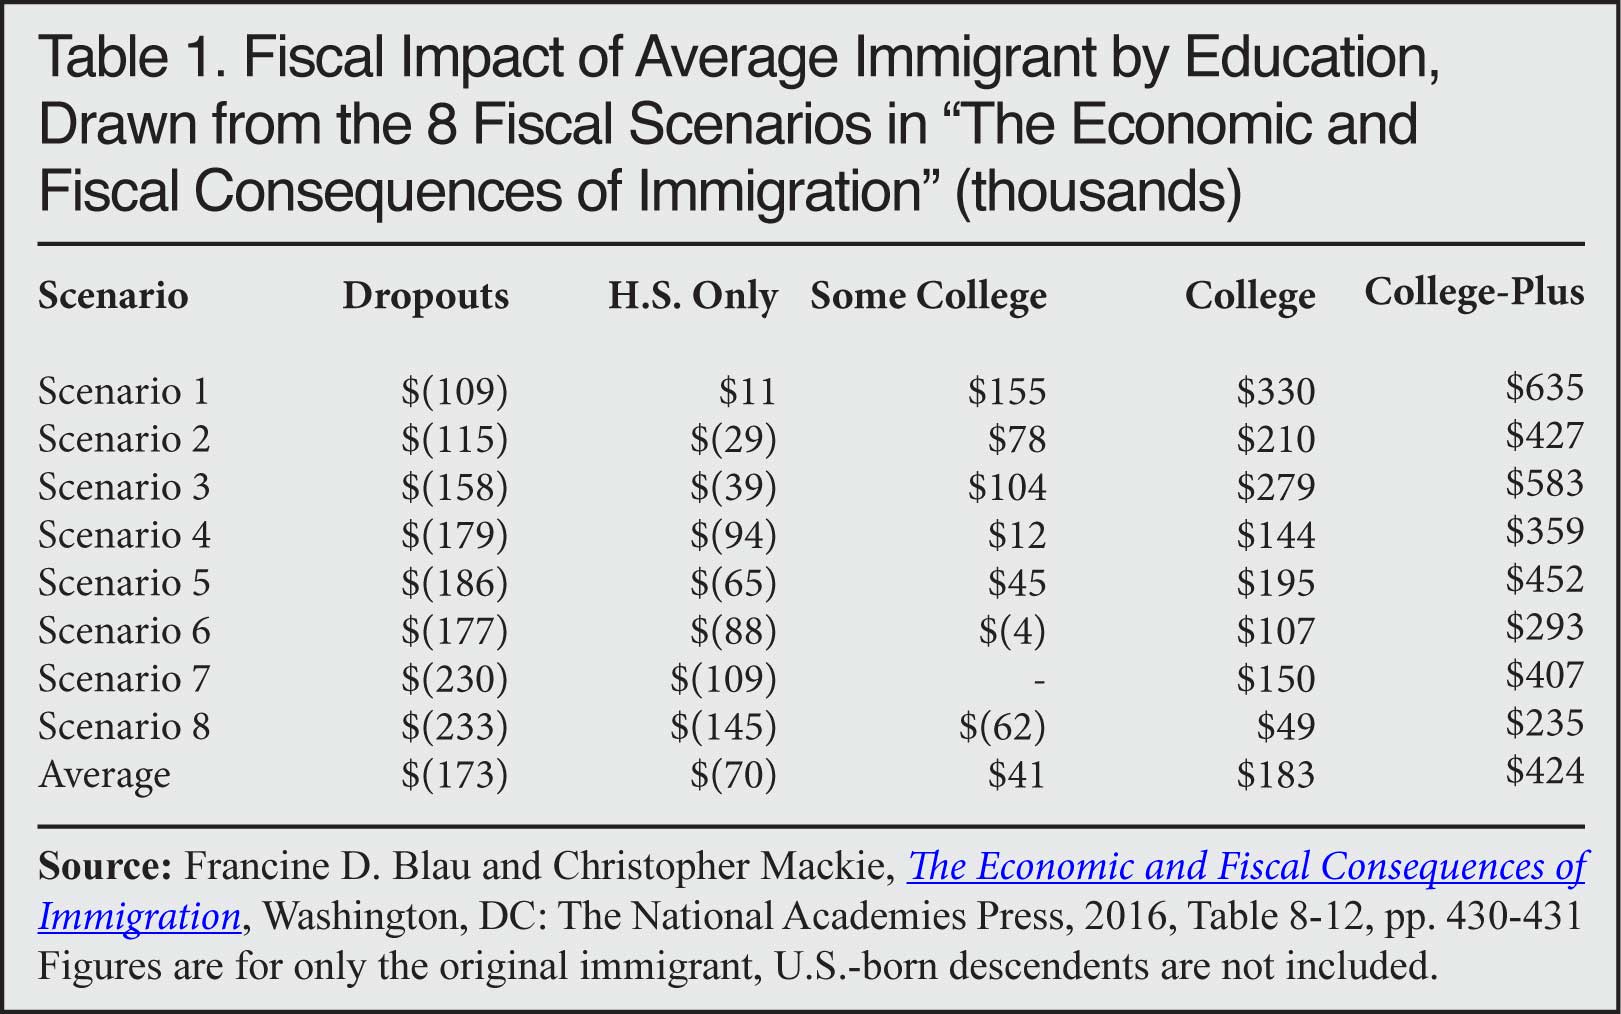
It should be pointed out that in every scenario from the NAS, as shown in Table 1, immigrants without a high school education are a significant net fiscal drain during their lifetimes. That is, they pay less in taxes than they use in services. Those with only a high school education are a net fiscal drain in seven of the eight scenarios. In contrast, the most educated immigrants, those with at least a bachelor's degree, are a net fiscal benefit in all eight scenarios.
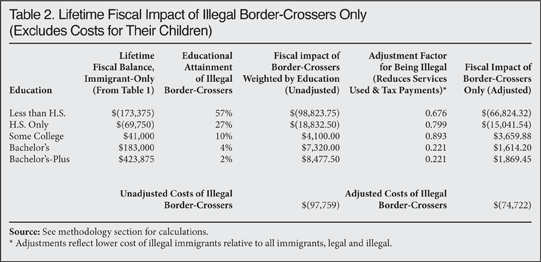
Calculating the Fiscal Impact of Border-Crossers. The first column of Table 2 reports the average fiscal effect of immigrants by education level, taken directly from the bottom of Table 1. Column 2 in Table 2 shows the education level of illegal border-crossers as discussed above. Column 3 multiplies the average cost by the share of border-crossers who fall into that educational category, and the bottom of column 3 adds up the costs to give a weighted average. This means that using the NAS average fiscal costs of immigrants by education and assuming the educational distribution of illegal border-crossers shown in the table means that the lifetime net fiscal drain per illegal crosser is $97,759. However, for reasons discussed below we think this figure somewhat overstates the fiscal costs.
As already mentioned, the NAS fiscal analysis includes all immigrants — both legal and illegal. Although illegal immigrants do access some welfare programs and create other significant costs, it is still the case that less-educated illegal immigrants create smaller net fiscal costs than less-educated legal immigrants. Unfortunately, the NAS study has very little discussion of how legal and illegal immigrants differ in their fiscal impact. The study does state: "Unauthorized immigrants as a group may have a more positive fiscal impact than authorized immigrants."15 We agree with this conclusion and so we adjust the fiscal drain created by less-educated illegal immigrants so it is less than that of less-educated legal immigrants.
To estimate the adjustment factor, we use the 2013 study by the Heritage Foundation mentioned above. That study has estimates for immigrants by education and legal status.16 While adjusting has the effect of reducing the fiscal costs for less-educated illegal immigrants, it also reduces the fiscal benefits for immigrants who are more educated. This reflects the fact that while higher-skilled illegal immigrants are assumed to create a fiscal surplus, they often are unable to find work commensurate with their education level because of their legal status and so have to work at lower paying jobs. As a result they do not have as large a positive impact on public coffers as their legal counterparts. Since there are relatively few illegal border crossers in the higher education categories, adjusting for the most educated crossers makes only a modest difference to the results.
The right lower corner of Table 2 shows that the fiscal costs of border-crossers, including the adjustment, is $74,722. Adjusting does significantly reduce the fiscal costs — by 23.6 percent. However, it is still the case that every 100,000 individuals who cross the border illegally cost taxpayers nearly $7.5 billion. It must be remembered that these are the present values of the lifetime net fiscal costs (taxes paid minus services used) for illegal border-crossers only, with no costs for their children or descendants.
Do Net Present Values Make Sense? Net present values are created by reducing or "discounting" costs or benefits in the future based on how long in the future they take place. Page 325 of the NAS study states that they used a 3 percent annual discount rate, which is common in this kind of analysis. So, for example, the fiscal balance (whether a net drain or benefit) an immigrant creates two years after arrival is reduced by about 6 percent. After 10 years the amount is reduced by about 26 percent, and at 20 years the discount is 45 percent. This means events that occur further in the future have a smaller impact on the total costs or benefits today. Comparing the net present value fiscal costs of illegal border-crossers to the costs of a wall can be seen as reasonable because the wall has to be paid for up front while the fiscal drain accrues over time. Using an NPV makes the costs of the wall and illegal border-crossers more comparable.
The primary downside of using NPVs for fiscal estimates is that it masks the size of future outlays created by less-educated illegal border-crossers. For example, using a 3 percent annual discount rate, as the NAS study does, means that if an illegal immigrant creates a net fiscal burden of $10,000 in the 23rd year of the projection, it will be reported and added to the total NPV as only $4,900 because of discounting. Without discounting, the actual outlays associated with illegal immigrants are much larger. This fact is worth keeping in mind when looking at the NPVs.
Making Different Assumptions. There are four key variables in the above calculations. The first is whether to include the children of illegal crossers. Many of the descendants of less-educated immigrants struggle, earning low wages and using a good deal in public services. If we use the NAS study's estimates that include the progeny of immigrants, the fiscal drain increases to $94,391. But, as already mentioned, the tax payments and costs created by the descendants of immigrants in the NAS study go out 75 years and are speculative. Therefore it makes more sense to focus on the original immigrants only.
The second question is what fiscal scenario from the NAS study should be used. (All the scenarios are shown in Table 1 of this report.) Scenario 1 makes assumptions that are most favorable to the fiscal impact of immigrants. If we use only this scenario, then the net fiscal costs drop significantly, to $20,092 for each illegal crosser. While significantly less than our estimates shown in Table 2, which reflect all the NAS scenarios averaged together, the best possible fiscal scenario for immigrants still shows a substantial net cost that would equal $2 billion for every 100,000 illegal border-crossers. This reflects the fact that even if one makes very favorable assumptions about immigrants it is still the case that less-educated immigrants, which account for most illegal crossers, are a large fiscal drain.
By way of contrast, if we use Scenario 8 from the NAS study, which makes the least favorable fiscal assumptions about immigrants, the net fiscal impact of each border-crosser increases dramatically — to $125,141, or $12.5 billion for every 100,000 illegal immigrants. This is a good deal more than when all NAS scenarios are averaged together, as reported in Table 2. But what is important to note is that no matter what NAS scenario is used, there is a significant lifetime net fiscal deficit for illegal border-crossers.
The third key assumption in our estimates is the education level of illegal border-crossers. As already discussed, there is widespread agreement that illegal immigrants are a relatively unskilled population. Further, illegal crossers are the least educated component of illegal immigration because they are mostly from Latin America and because, as already noted, more educated foreign nationals can often qualify for a temporary visa, which they can then overstay. The poor and less educated from Latin America typically have no other realistic option for getting into the United States than surreptitiously crossing the southern border.
If we assume that border-crossers are as educated as Pew estimated for all illegal immigrants, not just border-crossers, the average fiscal cost would still be very large — $57,778.17 While somewhat less than our estimated cost of $74,722, it would still mean that each group of 100,000 illegal border-crossers creates a net fiscal cost of more than $5.8 billion during their lifetimes. Again, Pew's figures show that about three-quarters of illegal immigrants have less than a high school education or only a high school education, and this makes them a large fiscal drain.
Finally, there is the question of the difference between the net fiscal impact of all immigrants (legal and illegal) by education level, which is what the NAS estimated, and the fiscal impact of illegal border-crossers. In Table 2 we adjust the fiscal impact of illegal border-crossers significantly, reducing the costs of less-educated illegal immigrants relative to immigrants of the same education by almost 24 percent. If we more than doubled this reduction to 50 percent for all educational categories, the net fiscal costs of border-crossers would still be $48,879. Under a 50 percent reduction, each 100,000 illegal immigrants still create a cost of nearly $5 billion, a very sizeable impact.18 Like the other assumptions, the adjustment factor matters, but the education level of illegal crossers drives the results and the fiscal balance is decidedly negative.
Overall, different assumptions can affect the results. But because the overwhelming share of illegal border-crossers have not completed high school, or have only a high school education, it would require highly implausible assumptions to avoid a substantial net fiscal drain from those who cross the border illegally. In short, illegal border-crossers are a large net fiscal drain because of their education levels and this fact drives the results. Therefore, a border wall would pay for itself even if it only stops a modest fraction of those expected to successfully cross in the next decade.
End Notes
1 There is no one definitive estimate of what a system of barriers, fencing, and walls will cost. The cost depends heavily on what type of system is constructed and the length of that system. Senate Majority Leader Mitch McConnell (R-Ky.) has said Congress would appropriate $12 to $15 billion for the wall, though he gave no time frame. As the senator is in a key position of authority to determine appropriations, his estimate seems a useful starting point for estimating what the federal government will spend on the wall. See Kate Drew, "This is what Trump's border wall could cost", CNBC, January 26, 2017.
2 Please see the methodology section of this report for an explanation of how we adjust downward the NAS fiscal cost estimates, which are for both legal and illegal immigrants, to reflect the cost for illegal border-crossers only.
3 John Whitley et. al., "Assessing Southern Border Security", Institute for Defense Analysis, May 2016, p. iv, Summary Table. It should be noted that some share of the 1.7 million border-crosers expected in the next 10 years may be people who successfully cross the border more than once. The border study does not have an estimate for the number of individuals who might cross successfully more than one time over a 10-year period. But if that number was perhaps a quarter of the total, then the number of unique border-crossers over a 10-year period would equal about 1.275 million. If this is correct, then a wall would have to stop 13 to 16 percent of illegal crossers in the next 10 years. Alternatively, if 41 percent are the same person successfully crossing more than one time in a 10-year period and the total number of unique crossers was one million, then a border wall would need to stop 16 to 20 percent of crossers to pay for itself.
4 The NAS does not report the fiscal impact of immigrants with and without the reduction in costs, referred to as discounting by economists. However, if one assumes a 45- or 50-year lifespan for illegal immigrants after they arrive and that the fiscal drain is evenly spread throughout their time in the United States, then the actual average fiscal costs are likely between $140,000 to $150,000 — perhaps twice what the costs are when the NPV is used. It must be emphasized that our undiscounted cost estimate is only an educated guess and the actual costs could be higher or lower. Later in this report we discuss in more detail the advantages and disadvantages of using NPV to think about fiscal issues.
5 Francine D. Blau and Christopher Mackie, eds., The Economic and Fiscal Consequences of Immigration, Washington, DC: The National Academies Press, September 22, 2016, p. 286.
6 James P. Smith and Barry Edmonston, The New Americans: Economic, Demographic, and Fiscal Effects of Immigration, Washington, DC: The National Academies Press, 1997.
7 Robert Rector and Jason Richwine, "The Fiscal Cost of Unlawful Immigrants and Amnesty to the U.S. Taxpayer", Heritage Foundation, May 6, 2013, p. v.
8 Steven A. Camarota, "The High Cost of Cheap Labor: Illegal Immigration and the Federal Budget", Center for Immigration Studies, August 2004.
9 Steven A. Camarota, "Immigrants in the United States, 2010: A Profile of America's Foreign-Born Population", Center for Immigration Studies, 2012, p. 69.
10 Jeffrey S. Passel and D'Vera Cohn, "A Portrait of Unauthorized Immigrants in the United States", Pew Hispanic Center, April 14, 2009, Figure 16, p. 11.
11 A study done for DHS by the Institute for Defense Analysis found that the overwhelming majority of successful border crossers are from Latin America. See John Whitley et. al., "Assessing Southern Border Security", Institute for Defense Analysis, May 2016, p. 24.
12 Less-educated people from developed countries can often enter the United States as tourists without a visa under the Visa Waiver Program. Developing countries are not typically part of the program.
13 This is based on analysis of illegal immigrants identified in the public-use files of the 2011, 2012, and 2013 Current Population Survey's Annual Social and Economic Supplement by the Center for Immigration Studies.
14 Both the estimates for the original immigrant and descendants are found on in Table 8-12 on p. 341 of the study. Francine D. Blau and Christopher Mackie, eds., The Economic and Fiscal Consequences of Immigration, Washington, DC: The National Academies Press, September 22, 2016, page 286.
15 Ibid., p. 280, end note number 2. See end note 16 in this report for a discussion of the fiscal costs of illegal vs. all immigrants (legal and illegal).
16 The Heritage Foundation reports the average fiscal impact for illegal immigrant and legal immigrant households by education level. They also report the number of households by education and legal status. With this information it is a relatively straightforward matter to calculate the average fiscal impact of all immigrant households (legal and illegal) by education. We then divide this amount by the estimated costs for illegal households by education to create an adjustment factor. So, for example, among illegal high school dropout households the net fiscal impact is -$20,485 a year, and for households headed by a legal immigrant who is a dropout the drain is a good deal more: -$36,993. In Heritage's estimate, illegal immigrants create a net fiscal cost that is about 55 percent that of the burden created by households headed by high school dropout legal immigrants. But this is not the proper comparison, as the NAS estimates are for all immigrants, not just legal immigrants. Given the number of households Heritage reports, the fiscal impact for all immigrant households (legal and illegal) headed by a dropout must be -$30,294. As this equals .676 of the estimated costs of illegal dropout households reported in the Heritage study, this becomes the adjustment factor. We do the same for the other educational categories. As the Heritage study does not show separate estimates for those with only a bachelor's degree and those with a graduate education, we use the same adjustment factor for both. Taken together, this approach reduces the net fiscal drain of illegal immigrants by almost 24 percent.
It is possible that this adjustment factor may be too large and that the costs of illegal immigration are actually greater. A study published by the Center for Immigration Studies in 2016 showed that the average illegal immigrant household creates 91 percent of the welfare costs of the average immigrant household (both legal and illegal). See Jason Richwine, "The Cost of Welfare Use By Immigrant and Native Households", Center for Immigration Studies, May 2016. However, welfare is only one cost and the Richwine study did not take into account tax payments. In a 2004 study of the federal budget, I found that the average household headed by an illegal immigrant created a fiscal drain equal to 79 percent that of households headed by legal immigrants with the same level of education. Relative to all immigrants (legal and illegal immigrants together), illegal immigrants created a fiscal cost equal to 88 percent that of legal immigrants, again controlling for education. However, the 2004 study was only for federal expenditures and tax payments. That study did not include costs and tax payments at the state and local level. See Steven A. Camarota, "The High Cost of Cheap Labor: Illegal Immigration and the Federal Budget", Center for Immigration Studies, August 2004. Later in this report we discuss the effect of using a different adjustment factor.
17 As will be recalled from the discussion above, Pew estimated that 47 percent of all illegal immigrants, not just illegal border-crossers, have not completed high school, 27 percent have only a high school education, 10 percent have some college, and 15 percent have a bachelor's or more. To make the estimates match the educational categories in the NAS study, which reports graduate degrees separately, we assume that 10 percent have a bachelor's degree and 5 percent have graduate degrees.
18 This would mean, for example, that the fiscal cost of legal immigrants with the same education would be substantially higher so that the average is what the NAS study reports. In the Census data the NAS study used, immigrants can only be legal or illegal, so the larger the reduction in costs for illegal immigrants, relative to all immigrants, the higher costs legal immigrants must create. Mathematically, the fiscal costs must average to those reported in the NAS study for all immigrants by education level.