Download a PDF of this Backgrounder.
VIDEO: Jason Richwine Discusses Welfare Report on FOX News
Jason Richwine, PhD, is an independent public policy analyst in Washington, D.C., and a contributing writer at National Review.
In September 2015, the Center for Immigration Studies published a landmark study of immigration and welfare use, showing that 51 percent of immigrant-headed households used at least one federal welfare program — cash, food, housing, or medical care — compared to 30 percent of native households. Following similar methodology, this new study examines the dollar cost of that welfare use.
- The average household headed by an immigrant (legal or illegal) costs taxpayers $6,234 in federal welfare benefits, which is 41 percent higher than the $4,431 received by the average native household.
- The average immigrant household consumes 33 percent more cash welfare, 57 percent more food assistance, and 44 percent more Medicaid dollars than the average native household. Housing costs are about the same for both groups.
- At $8,251, households headed by immigrants from Central America and Mexico have the highest welfare costs of any sending region — 86 percent higher than the costs of native households.
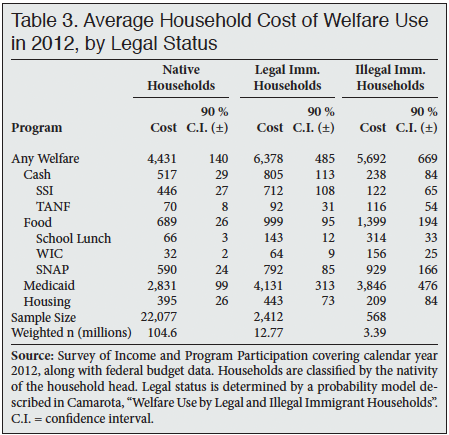
- Illegal immigrant households cost an average of $5,692 (driven largely by the presence of U.S.-born children), while legal immigrant households cost $6,378.
- The greater consumption of welfare dollars by immigrants can be explained in large part by their lower level of education and larger number of children compared to natives. Over 24 percent of immigrant households are headed by a high school dropout, compared to just 8 percent of native households. In addition, 13 percent of immigrant households have three or more children, vs. just 6 percent of native households.
Introduction
In September 2015, the Center for Immigration Studies published a landmark study of immigration and welfare use, showing that 51 percent of immigrant-headed households (legal and illegal) use at least one federal welfare program, compared to 30 percent of native households.1 "Welfare" refers to means-tested anti-poverty programs. These include direct cash assistance in the form of Supplemental Security Income (SSI) and Temporary Assistance for Needy Families (TANF); food aid such as free school lunch, the Women, Infants, and Children (WIC) nutrition program, and food stamps; Medicaid; and housing assistance in the form of rent subsidies and public housing. Not included are social insurance programs for which participants must generally pay into the system before drawing benefits, such as Social Security and Medicare.
The earlier CIS study was notable for showing much higher welfare participation rates than previously reported. The reason is that earlier studies measured welfare participation with the Annual Social and Economic Supplement (ASEC) of the Current Population Survey. The ASEC is a simple cross-sectional dataset widely used in labor market research. However, the ASEC substantially undercounts welfare participation, in part because it asks respondents to recall their welfare use over a period between three and 15 months before the interview takes place. To address the undercount problem, CIS used a more complex dataset called the Survey of Income and Program Participation (SIPP). As the name implies, the Census Bureau specifically designed the SIPP to measure participation in government programs. In addition, the SIPP is a "longitudinal" dataset, meaning it follows the same respondents over time, asking them about their monthly program participation in three different interview "waves" throughout the year. The result is a much more complete picture of welfare participation compared to what the ASEC provides.
Table 1, adapted from that CIS study, quantifies the differences. While the SIPP shows that 51 percent of immigrant-headed households and 30 percent of native-headed households used at least one welfare program in 2012, the comparable figures in the ASEC for immigrant and native households are just 39 percent and 24 percent, respectively.
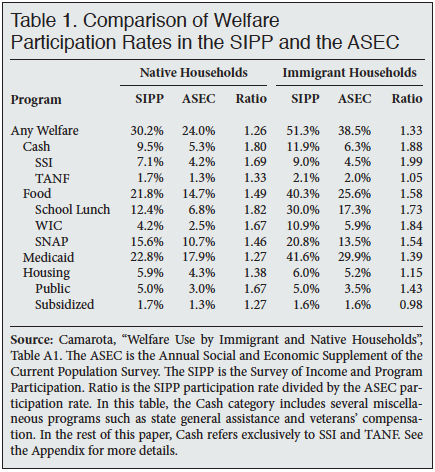
Note that the ASEC generally undercounts immigrant welfare use more than it undercounts native use. For example, the Medicaid participation rate among native households is 1.27 times (or 27 percent) higher in the SIPP compared to the ASEC, while Medicaid participation among immigrant households is 1.39 times (or 39 percent) higher.
Why Study the Cost of Welfare Use? The contribution of this new CIS study is to go beyond participation rates in the SIPP by estimating the dollar costs associated with immigrant and native welfare use. The purpose is two-fold. First, cost estimates are a natural extension of the original project. While it is important for Americans to understand the rate of welfare use among immigrants, expressing that use in dollar terms offers a more tangible metric that is tied to current debates over fiscal policy. With the nation facing a long-term budgetary deficit, this study helps illuminate immigration's impact on the problem.
The second purpose is more technical. As elaborated in the next section and in the Appendix, a standard strategy in cost studies is to take the undercounted costs in survey data and adjust them so that the total equals the official budgetary numbers. For example, when the National Research Council conducted its comprehensive fiscal analysis of immigration in 1997, the report's authors first calculated the percentage of a given welfare program's cost attributed to immigrants in the ASEC, then applied that percentage to the program's official budgetary cost.2 The assumption was that the undercount of welfare participation in the ASEC was the same for both immigrants and natives.3 Given Table 1 above, we now know that assumption does not hold. Undercount is greater for immigrants in the ASEC, meaning that immigrants use more welfare relative to natives than is reported in the National Research Council analysis. Estimating the dollar costs of welfare programs using the SIPP offers the chance for a more fine-tuned comparison.
Methodology Outline. The federal budget shows only how much the government spends on each program, not the demographics of recipients. Therefore, the only way to allocate welfare costs between immigrants and natives is to start with a survey — in this case, the SIPP — that includes both respondents' welfare participation and their demographic characteristics.
The SIPP can be used to estimate the portion of welfare costs listed in the government's budget that goes to immigrants. The assumption here is not that immigrants cost exactly what is reported in the SIPP, since surveys inevitably undercount receipt of government services. The key assumption is only that the fraction of costs attributed to immigrants in the SIPP is the same as the fraction of the real budgetary costs consumed by immigrants. For example, if immigrants account for 20 percent of SSI dollars reported in the SIPP, this study assumes that immigrants consume 20 percent of actual SSI spending reported in the budget.
The above approach — calculating the costs attributable to immigrant- or native-headed households in a survey, then adjusting those costs so that the total reflects official budgetary numbers — is equivalent to the National Research Council method mentioned earlier, except that CIS uses the more accurate SIPP rather than the ASEC to establish the initial allocation between immigrants and natives. Please see the Appendix for more details.
Technical specifics aside, the findings presented in the next section are estimates. All surveys — even the best ones, such as the SIPP — are subject to measurement error, particularly when the surveys ask respondents for the amount of money they receive from various programs. Adjusting the survey costs to reflect budgetary totals eliminates much of the uncertainty. However, the estimates presented in the next section should not be confused with exact budgetary figures.
Findings
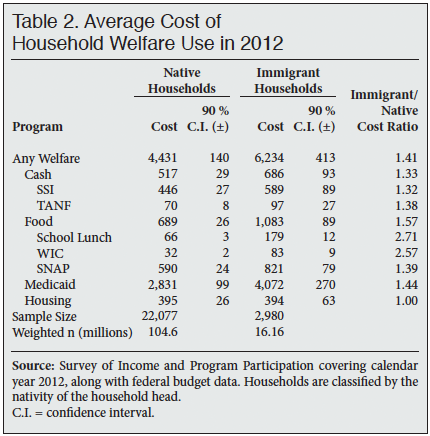
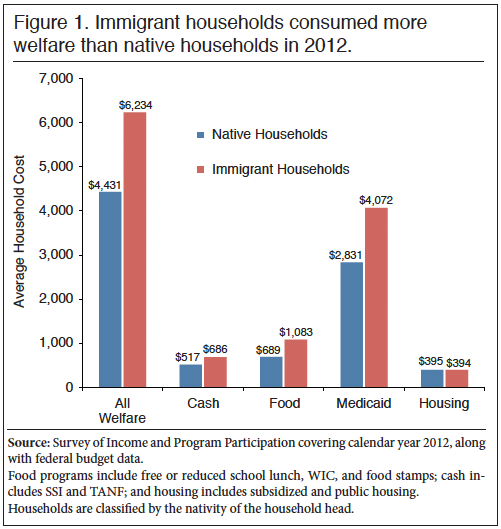
The main findings are presented in Table 2. The average welfare cost in immigrant-headed households is $6,234, compared to $4,431 in native-headed households. Immigrant households consume more cash, food, and Medicaid dollars than native households, while housing costs are roughly the same for both groups. Figure 1 shows that Medicaid is the largest welfare program, driving a large part of the overall difference between immigrants and natives.
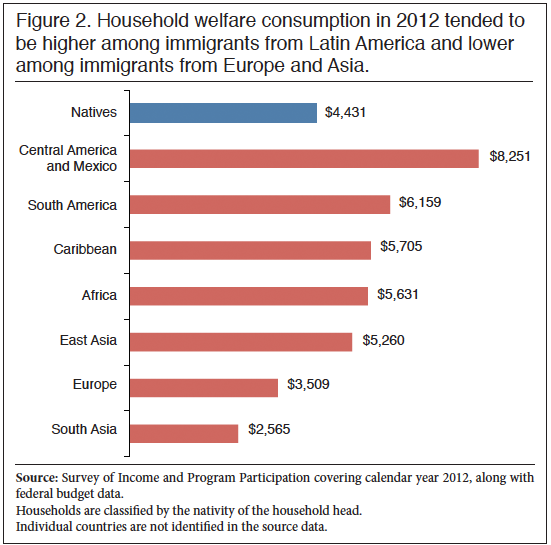
Sending Region. The cost of immigrant welfare use varies by the immigrants' region of origin. Figure 2 shows that the highest-cost households are those headed by immigrants from Central America and Mexico, consuming an average of $8,251 in welfare spending. Households headed by immigrants from Europe and Asia tend to be the least costly. Unfortunately, individual countries are not identified in the SIPP, so a finer-grained analysis is not
possible.4
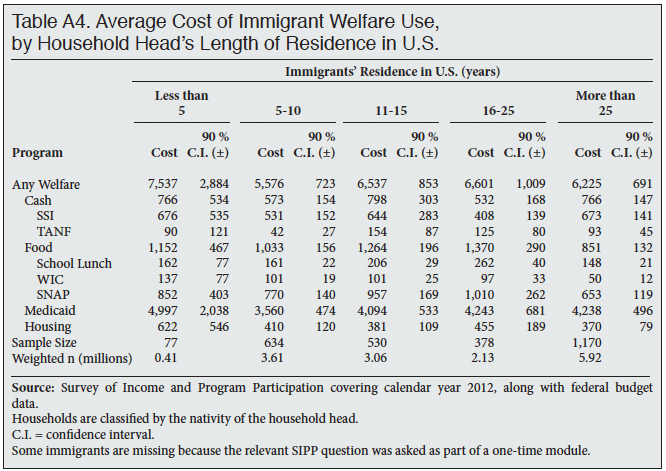
Legal Status. Although the SIPP does not directly measure legal status, probability models can be used to determine which immigrants are most likely to be in the country illegally.5 Table 3 indicates that households headed by (likely) illegal immigrants have an average welfare cost of $5,692. Illegal immigrants are barred from directly accessing most (though not all) welfare programs, but they can receive welfare through their U.S.-born children.6 Legal immigrant households, which have greater eligibility for welfare, cost $6,378 on average.
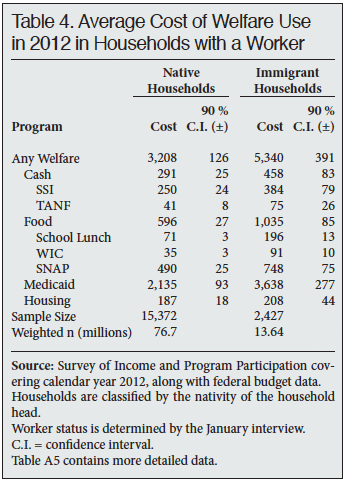
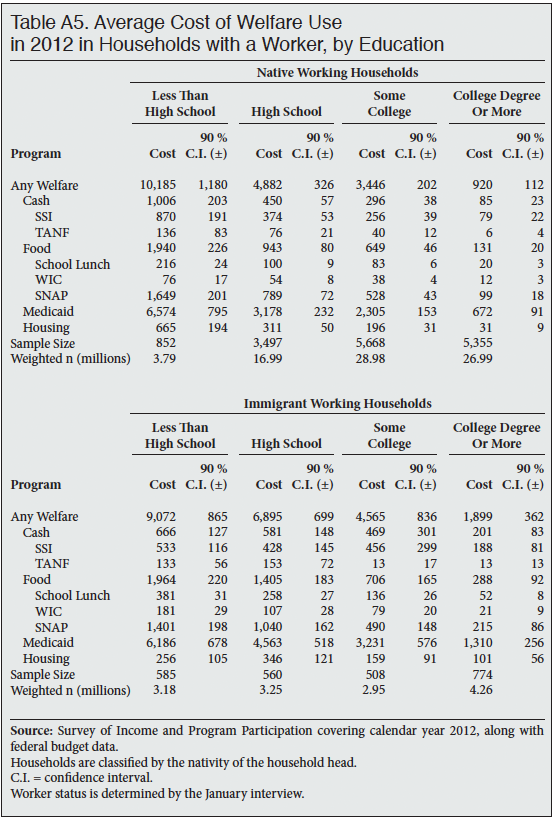
Workers. A popular misconception about the American welfare system is that it mainly benefits people who are not in the labor force. In fact, most means-tested anti-poverty programs are open to low-wage workers. For that reason, limiting the analysis to households with at least one worker, as Table 4 does, only modestly reduces the welfare cost estimates. The drop is especially small for immigrant households — from an overall cost of $6,234 in Table 2 to $5,340 in Table 4 — because 84 percent of immigrant households already contain a worker (vs. 73 percent of native households). Therefore, the higher welfare spending on immigrant households compared to native households is not due to a lack of work among immigrants. The difference is better explained by the demographic factors analyzed below.
Education. It is easy to understand why people with fewer skills are more likely to participate in welfare programs, since eligibility for those programs requires a low income. Unsurprisingly, Table 5 shows that welfare costs decrease as the education of the household head increases. Whereas immigrant households headed by a high school dropout cost an average of $10,329, immigrant households with college-educated heads cost just $2,455. The table demonstrates that the difference between immigrant and native household welfare costs becomes smaller after accounting for education.
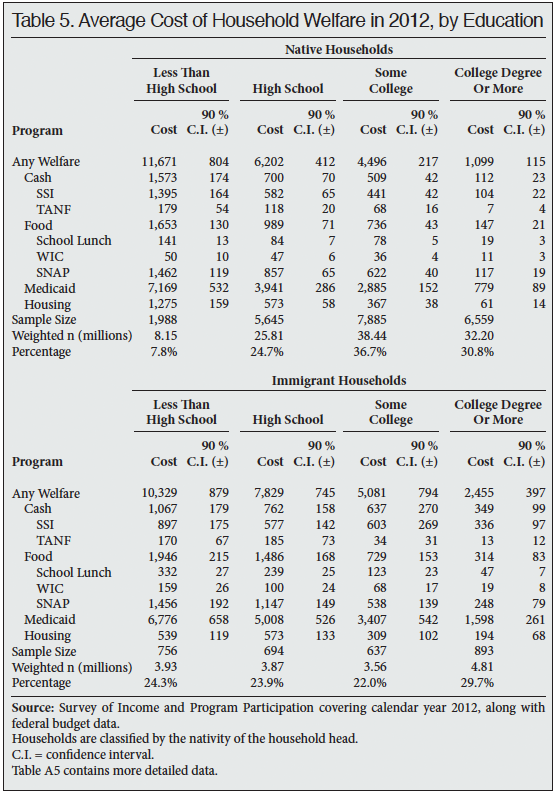
Some differences remain. College-educated immigrant households consume substantially more welfare than comparably educated natives. At the other end of the skill spectrum, immigrant households headed by a high school dropout use less welfare than their native counterparts. More important than those intra-education differences, however, is the distribution of education across households. The "Percentage" rows in Table 5 show that over 24 percent of immigrant households are headed by a high-school dropout, vs. just 8 percent of native households. Such stark educational differences will inevitably lead to differences in welfare consumption.
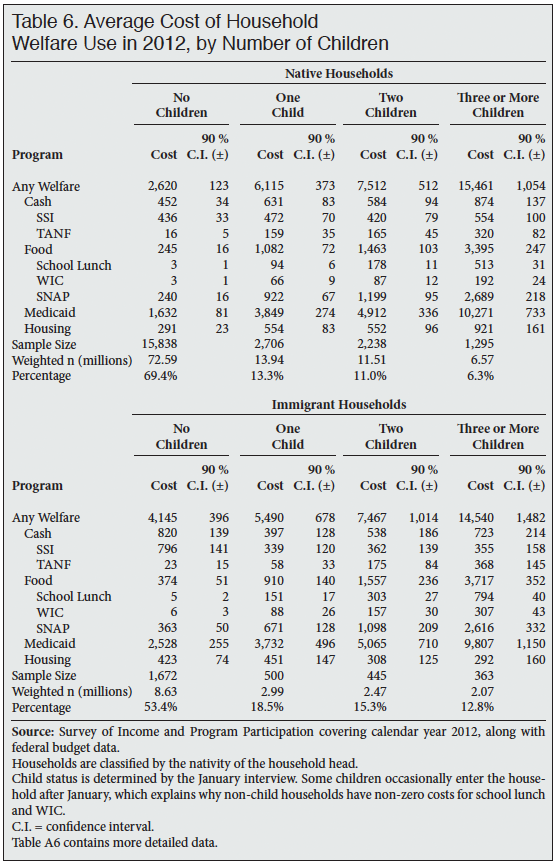
Children. Another important cause of the difference between immigrant and native households is the presence of minor children. Table 6 shows that costs are similar for a given number of children, and immigrant households have more children on average than native households. However, the presence of children is not the only reason for the relatively higher welfare cost of immigrant households. Table 6 shows that immigrant households without children consume significantly more welfare dollars than childless native households.
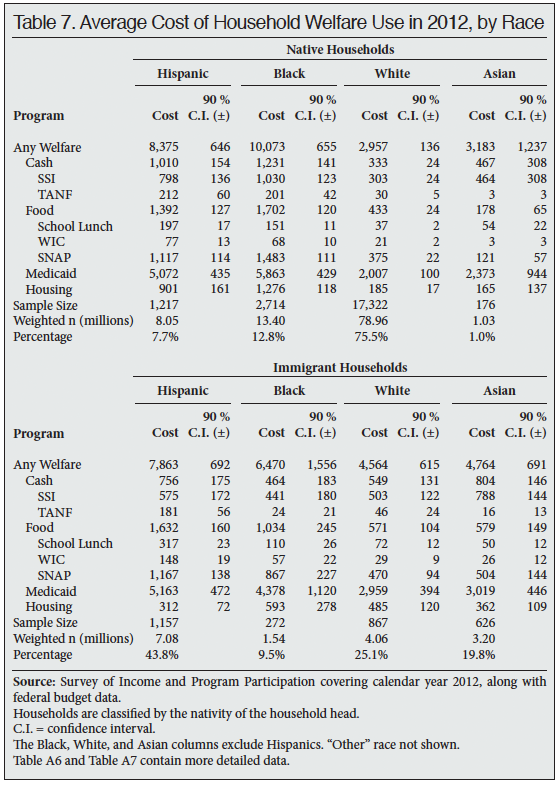
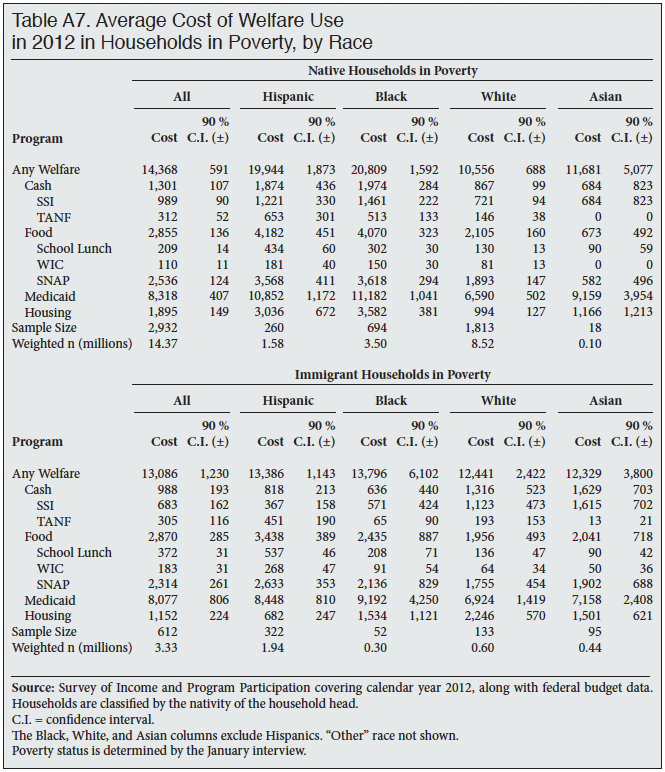
Race and Ethnicity. Regardless of nativity, households headed by blacks or Hispanics consume more welfare dollars on average than households headed by whites or Asians. However, Table 7 shows some interesting immigrant-native differences within racial groups. Immigrant households headed by blacks and Hispanics cost less than their native counterparts, while white- and Asian-headed immigrant households cost more. Despite the lower cost among immigrant Hispanics compared to native Hispanics, a much larger proportion of immigrant households are headed by Hispanics, which contributes to the greater overall cost difference between immigrants and natives.
Explaining Immigrant-Native Cost Differences with Regression Analysis. What explains the cost difference between immigrant and native households? The preceding sections control one at a time for factors such as education and number of children. This section uses regression analysis to simultaneously control for multiple explanatory variables, giving a better sense of which factors are most important.
Table 8 shows how the difference between immigrant and native welfare costs varies depending on the controls. The first row gives the baseline estimate with no controls other than an indicator for immigrant status. In the no-control scenario, immigrant households cost $1,803 more than native households, which is consistent with Table 2 above. The second row shows that the immigrant-native difference becomes larger — up to $2,323 — when we control for the presence of a worker in the household. The difference then becomes gradually smaller as controls are added for education and number of children. The fourth row shows that immigrant households with the same worker status, education, and number of children as native households cost just $309 more, which is a statistically insignificant difference. The fifth row shows that immigrants use fewer welfare dollars when they are compared to natives of the same race as well as worker status, education, and number of children.
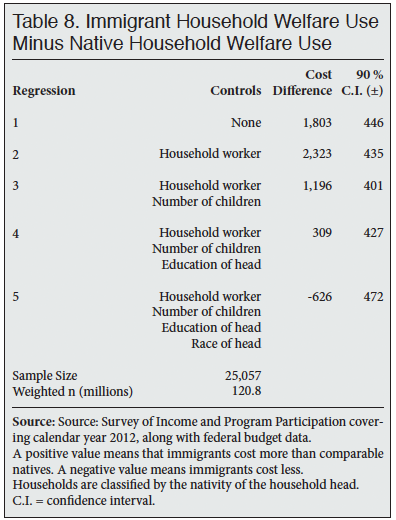
Although this regression analysis is interesting from a sociological perspective, it is important not to overstate its importance. Once we control for demographic factors, we are now looking only at hypothetical costs that might exist if immigrants had the average characteristics of natives. It is easy to see how these hypothetical costs could be abused in policy debates. For example, immigration restrictionists might argue that immigrants are uniquely prone to using welfare because they cost more than natives with the same employment status. Supporters of expanded immigration might counter that immigrants' greater attachment to the workforce is more important than their welfare use.
Similarly, immigration advocates often argue that although immigrants use more welfare than natives, low-skill immigrants use less welfare than low-skill natives.7 (See the "less than high school" column in Table 5.) Critics respond that this is the wrong standard for judgment. Just because poor and unskilled immigrants may consume fewer welfare dollars than equally poor and unskilled natives, it does not necessarily follow that such immigrants are good candidates for residence and citizenship, since the United States could simply pursue immigrants who do not have low levels of education in the first place.
The most important row in Table 8 is the first one, which shows the actual cost differences between immigrants and natives. The remaining rows help establish the reasons for the differences — and, in so doing, may inform policy debates regarding skill selection — but immigrants do not become more or less costly based on their hypothetical characteristics. It is the actual characteristics that matter.
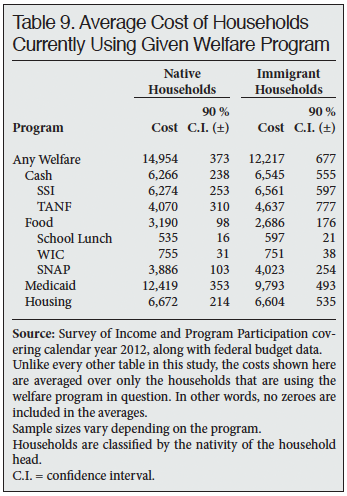
Cost of Households Currently Using a Given Welfare Program. Up to this point, every table in this study has shown welfare costs averaged across all households regardless of whether the households are participating in a welfare program. In other words, many $0 values are included in the averages. These tables answer the question, "How much does the average immigrant household cost in welfare expenditures compared to native households?"
A related but different question is how much immigrant and native households cost once they are on the welfare program in question. Table 9 restricts the cost averages to households participating in the welfare program listed in each row. For example, among immigrant households receiving SSI, the average benefit is $6,561, compared to $6,274 for native households receiving SSI. Immigrant and native household costs are generally similar in Table 9, with the important exception of Medicaid. Once enrolled in Medicaid, immigrant households cost less on average than native households, perhaps due to immigrant coverage being more tilted toward children rather than the elderly and disabled. In fact, because of legal restrictions, immigrant households are more likely to be "child-only" welfare recipients.8
The Broader Fiscal Picture
This study focuses on the cost of major welfare programs used by immigrant and native households. By contrast, a complete fiscal analysis would measure the cost of all government services and compare those costs with the taxes paid by each type of household. Some readers may wonder whether broadening the analysis would reveal that immigrant households make up for their greater welfare cost by paying higher taxes. This is not the case. As the previous CIS study of welfare participation demonstrated, immigrant households pay only about 89 cents in federal income and payroll taxes for every dollar paid by native households.9
The aforementioned report by the National Research Council, which did measure all government expenditures and taxes paid, found that immigrant households cost taxpayers as much as $2,200 per year in the 1990s, depending on their state of residence.10 More recently, the Heritage Foundation's complete fiscal analysis (to which the author of this study contributed) estimated that the average legal immigrant household paid $4,344 less in taxes than it received in services in 2010, compared to a deficit of just $310 for the average native household.11 For the most up-to-date numbers, the National Research Council will release a new analysis later this year.
The studies mentioned above measure the direct fiscal effects of immigration by comparing the services households receive with the taxes they pay. But what about indirect effects? Immigration touches all aspects of American life, so one could give almost endless examples of immigrants influencing society in ways that indirectly change how much the government taxes and spends. Attempting to quantify some of those indirect effects is not objectionable in itself, but it does open a "Pandora's Box" of selectivity bias and
exaggeration.
For example, consider the reaction to the Heritage Foundation's estimate that illegal immigration and amnesty would generate a direct lifetime cost of $6.3 trillion. Supporters of amnesty quickly settled on a rebuttal point: Although illegal immigrants who receive amnesty may pay as a group $6.3 trillion less in taxes than they receive in benefits over their lifetimes, their labor boosts economic productivity so much that natives probably still end up in the black.12 That claim is, first of all, a tremendous exaggeration. Most of the gains from immigration go to immigrants themselves, not to natives.13 In a paper for CIS back in 2013, economist George Borjas estimated that illegal immigrants increased GDP by $395 billion to $472 billion. Of that amount, however, only about $9 billion went to natives.14 After extending that $9 billion annually over an adult lifetime of 50 years, productivity gains would add back just 7 percent of the $6.3 trillion fiscal cost.
Furthermore, an increase in productivity is just one of many indirect fiscal effects of immigration. What is the cost of additional welfare spending on natives when they are displaced from jobs or see their wages lowered by immigrant competition?15 What are the moving and commuting costs incurred by natives who flee overcrowding? What are the costs of less social trust and cooperation identified by Robert Putnam and others?16 How about the increase in English-language learners in public schools? One could go on and on with costs and benefits of immigration that indirectly impact the government's fiscal situation. But once advocates enter the world of indirect effects, they become decidedly selective with the effects they wish to include.
Conclusion
When researchers analyze welfare participation and costs, their dataset of choice has traditionally been the Annual Social and Economic Supplement (ASEC) of the Current Population Survey. While the ASEC is certainly useful — CIS uses it frequently — it substantially undercounts welfare participation. For that reason, CIS turned to the Survey of Income and Program Participation (SIPP), a more complex dataset developed by the Census Bureau specifically to analyze welfare use. CIS's analysis of the SIPP has now generated two major studies. The first study, published in September 2015, measured welfare participation rates. It showed that 51 percent of immigrant-headed households used some form of welfare, compared to 30 percent of native households.17 This second study extends the SIPP analysis by moving from rates to costs. It finds that immigrant-headed households consume an average of $6,234 in welfare spending, compared to $4,431 for native households. The highest-cost immigrant households tend to be those headed by a person from Latin America, while the lowest-cost households are headed by people from Europe and Asia.
This study implies that two competing narratives about immigration are both true. Immigrants do indeed have a strong attachment to the labor force, as immigration advocates often point out. At the same time, however, immigrants consume a large amount of welfare spending, just as critics claim. The reason that both narratives are true is that the American welfare system has become increasingly focused on buttressing low-wage workers rather than supporting non-workers. Put more simply, welfare and low-wage work go together. Just as natives with low levels of education and large numbers of children are apt to consume welfare, immigrants with those same characteristics are also likely to be on welfare. A strong work ethic does not change this reality.
In order to reduce the cost of immigrant welfare use, either the welfare system or the immigration system must change. The former option is sometimes described as "building a wall around the welfare state" to prevent new immigrants from accessing it. It is easier said than done. Loopholes and exceptions have weakened previous attempts to limit immigrant access to welfare.18 More importantly, Congress has no power to prevent the U.S.-born children of immigrants from using the same welfare programs that the children of natives do. No matter how strong the "wall around the welfare state" is built, it cannot stop immigrant parents from signing up their U.S.-born children for Medicaid, SNAP, free school lunch, etc., as long as native parents can do the same.
Only a full-scale rollback of the welfare state for both immigrants and natives would prevent immigrant families from consuming welfare dollars. Whatever one thinks of that proposal, it is not a policy change likely to occur in the near future.19 In fact, importing new clients of the welfare state likely makes it even harder to roll back.20 As long as the U.S. continues to admit large numbers of low-skill immigrants (legal or illegal), then immigrant welfare consumption will remain high.
Appendix
To determine which households use which welfare programs in the SIPP, this study follows almost the exact methodology of the previous CIS report, "Welfare Use by Immigrant and Native Households". The one exception is that the aggregate Cash category now refers exclusively to SSI and TANF. In the previous study, Cash also included several miscellaneous programs such as state general assistance, veterans' compensation, and, in the cryptic words of the SIPP documentation, "other welfare".21 Because these smaller programs are too vaguely defined to locate in budget documents, the Cash category is now limited to the two largest cash assistance programs, SSI and TANF.
The contribution of this study is to estimate the dollar costs associated with the welfare use rates previously reported. That process involves two major steps. First, some program costs in the SIPP must be imputed because they are not measured directly in the survey. Second, due to measurement error in the survey responses and imputations, the SIPP costs must be adjusted to reflect the full cost of each welfare program as reported in the government's budget.
Program Costs in the SIPP. The SIPP provides direct cost estimates for some but not all of the welfare programs for which it measures participation. Determining the annual household cost of SSI, TANF, WIC, and food stamps is simply a matter of summing the monthly values of the variables provided in the SIPP.22 However, the cost of free or reduced school lunch, Medicaid, and subsidized housing (the "cost-unknown programs") must be imputed separately.
Recall that the ASEC substantially undercounts program participation, making it suboptimal for a welfare analysis. However, the ASEC does provide direct cost estimates for the cost-unknown programs using imputation procedures developed by the Census Bureau. The approach of this study is to apply the same imputation to the SIPP's cost-unknown programs as the Census Bureau uses with the ASEC. The aim is to produce a "best of both worlds" dataset that combines the more accurate participation rates of the SIPP with the more complete cost estimates of the ASEC. Table A1 outlines the process.
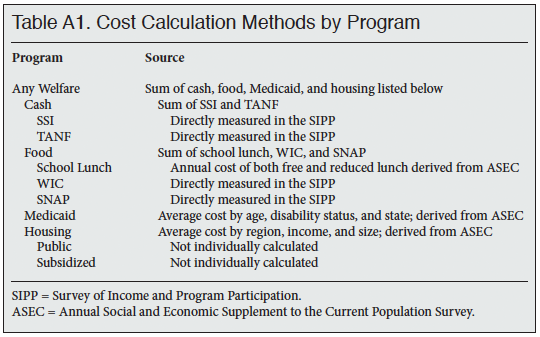
For its ASEC estimates, the Census Bureau determined that the average annual cost of free lunch for one child in 2012 was $507, while the annual cost of reduced lunch was $440. The SIPP distinguishes between free and reduced lunch receipt at the household level, so determining the monthly cost in the SIPP — remember that the SIPP measures welfare use by month — is simply a matter of dividing either $507 or $440 by 12, then multiplying by the number of eligible children in the household each month. The resulting monthly estimates are summed to produce an annual household cost.
Medicaid is more complicated. The Bureau identifies four "risk classes" — children (below age 21), non-elderly adults, seniors (age 65 and over), and the disabled.23 It then assigns each class an average cost by state. That generates 4*50 = 200 unique cost estimates. In addition, Medicaid pays the cost of Medicare premiums for people enrolled in both programs. The Bureau adds the annual Medicare premium, which was $1,199 in 2012, to the total cost of Medicaid for dual enrollees.24 To perform the imputation in the SIPP, the full matrix of cost estimates was generated in the ASEC, then merged into the SIPP using the same identifying variables of age, disability status, state, and Medicare coverage.25 As with school lunch, the annual ASEC cost estimates are divided by 12 to produce monthly SIPP costs, then summed to produce an annual figure.
The original CIS welfare study separately classified public housing and subsidized rent, but the ASEC collapses the cost of housing assistance into one category. The ASEC imputation is based on three groups of family income (below $6,000, between $6,000 and $10,000, more than $10,000), three bedroom counts (one, two, three or more), and four regions (Northeast, Midwest, South, West).26 Generating reliable bedroom counts is too difficult with the SIPP, so this study uses the number of people in the household (one, two, three or more). After generating the full matrix of cost estimates at the household level in the ASEC — based on region, household income, and the number of people — the costs are merged into the SIPP using those same three household characteristics. Unlike school lunch and Medicaid, housing costs in the ASEC are provided as a monthly cost, meaning no division by 12 is required when transferred to the SIPP.
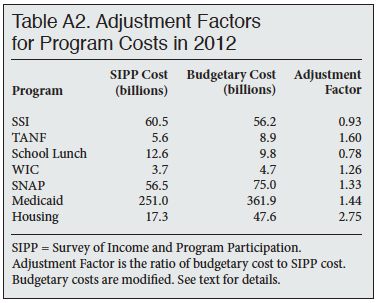
Adjustment to Reflect Budgetary Costs. After all the welfare costs in the SIPP are established, the next step is to adjust those costs to reflect the real budgetary totals. Table A2 compares the total costs reported (or imputed) in the SIPP with the total costs listed in the federal government's budgetary records. For consistency with the SIPP, the budgetary numbers collected here generally reflect the cost of actual benefits, not administrative costs. In addition, the cost of nursing home care is excluded from the Medicaid budget, since the SIPP does not cover the institutionalized population.
Some minor inconsistencies are unavoidable. For example, the budgetary cost of housing refers only to federal programs, although state and local programs are a small part of the housing cost measured in the SIPP. Tracking down the cost of every non-federal housing program would be infeasible. In addition, most budgetary figures are available only for the "fiscal year", which runs from October through September, whereas the SIPP covers the "calendar year" of January through December.27 This means that the SIPP time period includes nine months of FY 2012 (January through September) and three months of FY 2013 (October through December). To correct for the misalignment, this study's budgetary costs for the 2012 calendar year are calculated as a weighted average of fiscal-year costs: (9/12)*(FY 2012) + (3/12)*(FY 2013).
There are several reasons why the total cost of a given program in survey data does not match the total budgetary cost of the program. First, the cost of direct transfers such as TANF, WIC, and food stamps are typically underreported in surveys. Second, the cost imputations of school lunch, Medicaid, and housing are inherently inexact. Third, the budgetary figures may not refer to the exact same costs measured in the survey, as is the case with housing.
Costs are generally undercounted in the SIPP, but the discrepancies vary considerably from program to program, and SSI and school lunch are actually overestimated.28 These discrepancies may seem like a threat to the study's validity. Remember, however, that the SIPP cost estimates are merely a tool for dividing up the real budgetary costs between immigrants and natives. As noted in the main text, the assumption here is not that immigrants cost exactly what is reported in the SIPP; rather, it is that the fraction of costs attributed to immigrants in the SIPP is the same as the fraction of the real budgetary costs consumed by immigrants. Any bias in the SIPP data unrelated to immigration status — for example, if both immigrants and natives underreport their TANF income by the same percentage — is irrelevant once the costs are adjusted to reflect budgetary totals.
Table 1 demonstrates that the SIPP helps correct the ASEC's bias toward undercounting immigrant welfare participation vis-à-vis native participation. As long as the reported and imputed costs of that participation in the SIPP are reasonably unbiased with respect to immigration status, then the final adjusted cost estimates will be good approximations of the true budgetary numbers.
The adjustment procedure is simple. The cost of each SIPP household's participation in a given program is multiplied by an adjustment factor, which is the ratio of total budgetary spending on the program to the total spending on the same program reported in the SIPP. For example, the SNAP adjustment factor is $75.0 billion / $56.5 billion = 1.33. In other words, the total budgetary cost of SNAP is 1.33 times (or 33 percent) higher than the total SNAP cost in the SIPP. The cost of each SIPP household's SNAP usage is multiplied by 1.33 to bring the total SIPP costs up to the budgetary level. This is mathematically equivalent to calculating the portion of SNAP costs attributed to immigrants or natives in the SIPP, then multiplying that percentage by the total budgetary cost of SNAP.
Supplemental Tables

End Notes
1 Steven A. Camarota, "Welfare Use by Immigrant and Native Households", Center for Immigration Studies Backgrounder, September 2015.
2 National Research Council, The New Americans, Washington, D.C.: National Academy Press, 1997, p. 308.
3 The Heritage Foundation's 2013 fiscal analysis makes the same assumption. Robert Rector and Jason Richwine, "The Fiscal Cost of Unlawful Immigrants and Amnesty to the U.S. Taxpayer", Heritage Foundation Special Report, May 6, 2013, p. 47.
4 Here is a list of the countries grouped under the region categories in Figure 2. Central America: Belize, Mexico, Costa Rica, El Salvador, Guatemala, Honduras, Nicaragua, Panama. Caribbean: Barbados, Cuba, Dominica, Dominican Republic, Grenada, Haiti, Jamaica, Trinidad and Tobago, West Indies. South America: Argentina, Bolivia, Brazil, Chile, Colombia, Ecuador, Guyana, Peru, Uruguay, Venezuela. Europe: Austria, Belgium, France, Germany, Ireland, Holland/Netherlands, Norway, Sweden, Switzerland, United Kingdom, Albania, Bulgaria, Greece, Hungary, Italy, Poland, Portugal, Romania, Spain, Czech Republic, Bosnia and Herzegovina, Croatia, Lithuania, Belarus, Russia, Ukraine, USSR. East Asia: China, Hong Kong, Japan, Korea, South Korea, Taiwan. South Asia: Afghanistan, Bangladesh, India, Iran, Nepal, Pakistan, Sri Lanka, Uzbekistan. Africa: Egypt, Equatorial Guinea, Ethiopia, Eritrea, Ghana, Kenya, Liberia, Morocco, Nigeria, Sierra Leone, Somalia, South Africa, Sudan.
5 Steven A. Camarota, "Welfare Use by Legal and Illegal Immigrant Households", Center for Immigration Studies Backgrounder, September 2015, pp. 2-3.
6 Camarota, "Welfare Use by Immigrant and Native Households", Appendix.
7 See, for example, Shikha Dalmia, "Heritage's Updated Study on the Welfare Costs of Immigrants: Garbage In, Garbage Out", Reason, May 7, 2013.
8 Camarota, "Welfare Use by Immigrant and Native Households", Appendix.
9 Ibid., pp. 22-23.
10 National Research Council, The New Americans, pp. 284-289. The $2,200 figure refers to California, which the authors describe as likely to be an upper bound estimate.
11 Rector and Richwine, "The Fiscal Cost of Unlawful Immigrants and Amnesty to the U.S. Taxpayer", Table 6. Both types of households are in deficit because the government spends more than it takes in.
12 See, for example, Will Wilkinson, "Welfare and Amnesty", The Economist, May 8, 2013.
13 The mistaken belief that immigration generates large indirect fiscal benefits seems to stem from confusing GDP growth with gains for natives. The latter is just a tiny proportion of the former. For a more in-depth discussion, see Jason Richwine, "Most of the Gains from Immigration Go to Immigrants Themselves – Not to Natives", Center for Immigration Studies, February 10, 2016.
14 George Borjas, "Immigration and the American Worker", Center for Immigration Studies Backgrounder, April 2013.
15 See, for example, George J. Borjas, Jeffrey Grogger, and Gordon H. Hanson, "Immigration and the Economic Status of African-American Men", Economica, Vol. 73 (2010), pp. 255-282.
16 Robert D. Putnam, "E Pluribus Unum: Diversity and Community in the Twenty-first Century", Scandinavian Political Studies, Vol. 30, No. 2 (June 2007), pp. 137-174.
17 Camarota, "Welfare Use by Immigrant and Native Households".
18 Ibid., Appendix.
19 Means-tested anti-poverty spending has trended ineluctably upward. Even the famous "cuts" in 1981 and 1996 were just minor speed bumps on the road to higher spending. See Jason Richwine, "Crying Wolf Over Spending Cuts", The Richwine Archive, January 18, 2014.
20 "How Mass (Legal) Immigration Dooms a Conservative Republican Party", Eagle Forum, first published January 2014.
21 Personal communication with Shelley Irving at the Census Bureau.
22 One reported value for annual SSI receipt is an implausibly high $69,934. It appears to be a mis-code, as the next-highest value is just $37,281. The implausible value has been top-coded to $37,281 for this study.
23 A disabled person in the ASEC is under age 65 and has at least one of the following additional characteristics: SSI income, Social Security income, or not working due to illness.
24 Personal communication with Jessica Semega at the Census Bureau.
25 Unfortunately, the SIPP does not identify Medicare recipients who are under 15 years old, even though children with kidney disease could be on the program. Therefore, the cost of Medicaid never includes an additional $1,199 Medicare premium for respondents under 15 in this study.
26 Paul D. Johnson, Trudi Renwick, and Kathleen Short, "Estimating The Value of Federal Housing Assistance for the Supplemental Poverty Measure", U.S. Census Bureau Working Paper, December 2010, pp. 6-7.
27 The SIPP panel used in this study started in 2008, so it is possible to calculate SIPP welfare costs over the fiscal-year period of October 2011 to September 2012 rather than over the calendar-year period. The trouble is that the Census Bureau provides longitudinal weights only for calendar years. Without those weights, the SIPP would be unrepresentative of the general population.
28 One reason SSI is overestimated in the SIPP may be that respondents confuse it with disability insurance (DI) payments. Both SSI and DI are administered by the Social Security Administration, but DI is a social insurance program open only to workers who pay into the system, while SSI is a means-tested transfer payment.