Download a PDF of this Backgrounder
Steven A. Camarota is the director of research at the Center for Immigration Studies

This study is the first in recent years to examine immigrant (legal and illegal) and native welfare use using the Census Bureau's Survey of Income and Program Participation (SIPP). While its complexity makes it difficult to use, the survey is widely regarded as providing the most accurate picture of welfare participation. The SIPP shows immigrant households use welfare at significantly higher rates than native households, even higher than indicated by other Census surveys.
- In 2012, 51 percent of households headed by an immigrant (legal or illegal) reported that they used at least one welfare program during the year, compared to 30 percent of native households. Welfare in this study includes Medicaid and cash, food, and housing programs.
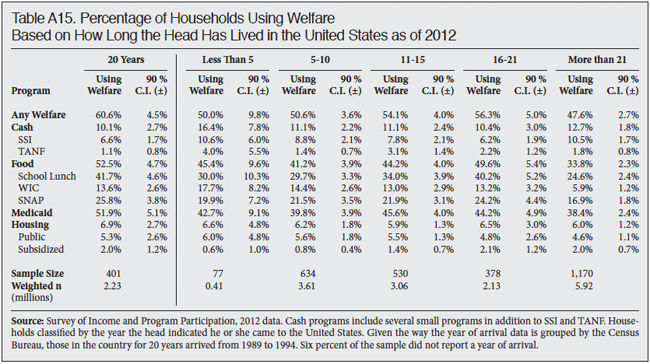
- Welfare use is high for both new arrivals and well-established immigrants. Of households headed by immigrants who have been in the country for more than two decades, 48 percent access welfare.
- No single program explains immigrants' higher overall welfare use. For example, not counting subsidized school lunch, welfare use is still 46 percent for immigrants and 28 percent for natives. Not counting Medicaid, welfare use is 44 percent for immigrants and 26 percent for natives.
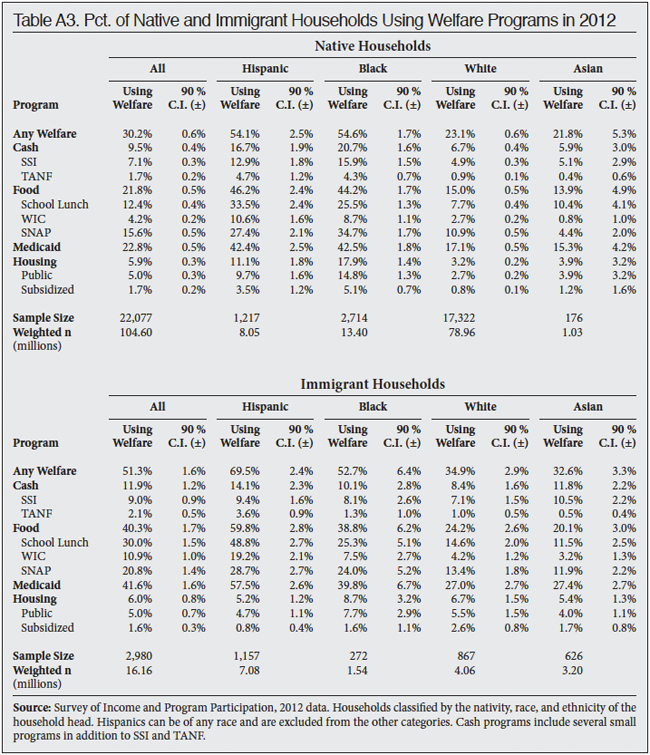
- Immigrant households have much higher use of food programs (40 percent vs. 22 percent for natives) and Medicaid (42 percent vs. 23 percent). Immigrant use of cash programs is somewhat higher than natives (12 percent vs. 10 percent) and use of housing programs is similar to natives.
- Welfare use varies among immigrant groups. Households headed by immigrants from Central America and Mexico (73 percent), the Caribbean (51 percent), and Africa (48 percent) have the highest overall welfare use. Those from East Asia (32 percent), Europe (26 percent), and South Asia (17 percent) have the lowest.
- Many immigrants struggle to support their children, and a large share of welfare is received on behalf of U.S.-born children. However, even immigrant households without children have significantly higher welfare use than native households without children — 30 percent vs. 20 percent.
- The welfare system is designed to help low-income workers, especially those with children, and this describes many immigrant households. In 2012, 51 percent of immigrant households with one or more workers accessed one or more welfare programs, as did 28 percent of working native households.
- The large share of immigrants with low levels of education and resulting low incomes partly explains their high use rates. In 2012, 76 percent of households headed by an immigrant who had not graduated high school used one or more welfare programs, as did 63 percent of households headed by an immigrant with only a high school education.
- The high rates of immigrant welfare use are not entirely explained by their lower education levels. Households headed by college-educated immigrants have significantly higher welfare use than households headed by college-educated natives — 26 percent vs. 13 percent.
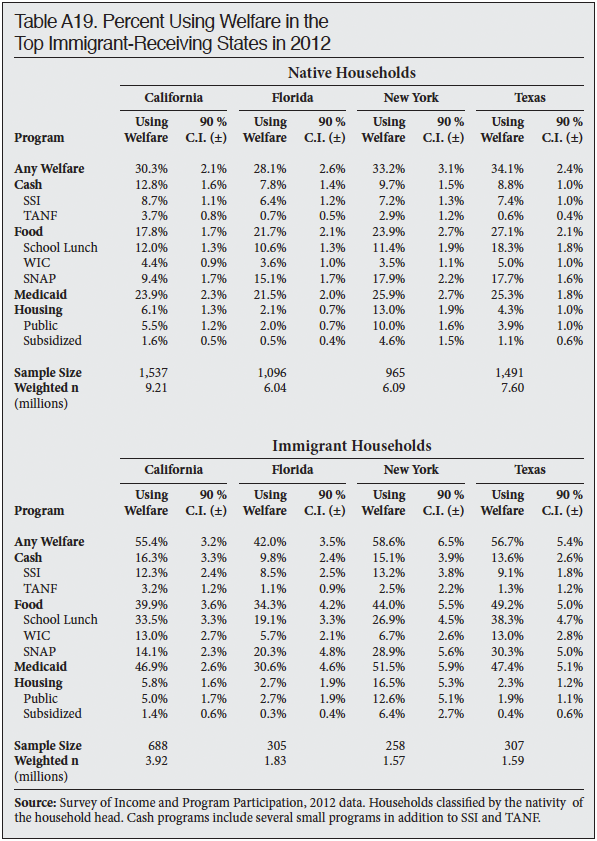
- In the four top immigrant-receiving states, use of welfare by immigrant households is significantly higher than that of native households: California (55 percent vs. 30 percent), New York (59 percent vs. 33 percent), Texas (57 percent vs. 34 percent), and Florida (42 percent vs. 28 percent).
- Illegal immigrants are included in the SIPP. In a forthcoming report, we will estimate welfare use for immigrants by legal status. However, it is clear that the overwhelming majority of immigrant households using welfare are headed by legal immigrants.
- Most new legal immigrants are barred from welfare programs when they first arrive, and illegal immigrants are barred as well. But the ban applies to only some programs; most legal immigrants have been in the country long enough to qualify for at least some programs and the bar often does not apply to children; states often provide welfare to new immigrants on their own; naturalizing makes immigrants eligible for all programs; and, most important, immigrants (including illegal immigrants) can receive benefits on behalf of their U.S.-born children who are awarded U.S. citizenship at birth.
- The heavy use of welfare by less-educated immigrants has three important policy implications: 1) prior research indicates that illegal immigrants are overwhelmingly less-educated, so allowing them to stay in the country creates significant welfare costs; 2) by admitting large numbers of less-educated immigrants to join their relatives, the legal immigration system brings in many immigrants who are likely to access the welfare system; and 3) proposals to allow in more less-educated immigrants to fill low-wage jobs would create significant welfare costs.
Introduction
This report examines welfare use for households headed by immigrants and natives based on the Census Bureau's Survey of Income and Program Participation (SIPP). Because of the survey's complexity, most researchers have relied on other sources of data to examine immigrant and native welfare use. However, there is widespread agreement that the SIPP provides the most accurate picture of welfare use of any Census Bureau survey. During 2012, the SIPP shows that 51 percent of immigrant households used at least one major welfare program during the year, compared to 30 percent of native households — a 21 percentage-point difference. This is a good deal higher than use rates shown by other Census data. The Census Bureau's Current Population Survey Annual Social and Economic Supplement shows that, in 2012, 39 percent of immigrant households and 24 percent of native households used one or more welfare programs — a 15 percentage-point gap. Thus, the more accurate SIPP shows a significantly larger gap between immigrant and native welfare use than the Current Population Survey.1
In this report we use the terms immigrant and foreign-born synonymously. The foreign-born include all individuals who were not U.S. citizens at birth, including naturalized citizens, green card holders, illegal immigrants, and a small number of individuals on long-term temporary visas such as guestworkers and foreign students. Although all the data analysis in this report was conducted by the Center for Immigration Studies, the results reported in the tables and figures have been independently verified by Decision Demographics, a demographic consulting firm in Arlington, Va.2
Immigrant households make more extensive use of welfare even though a number of restrictions have been passed designed to limit their access to such programs. As explained in detail in the appendix, most of the immigrant population is not covered by these restrictions and numerous exceptions exist that allow access to the welfare system. Furthermore, immigrants often receive benefits on behalf of their U.S.-born children.
The findings of this analysis have important policy implications. Perhaps most important, the significantly higher welfare use associated with immigrants means that it is very likely immigration is a drain on public coffers, exacerbating the nation's fiscal deficit.
Why Study Immigrant Welfare Use?
Use of welfare programs by immigrants is important mainly for two reasons. First, it is one measure of their impact on American society. If immigrants have high use rates, it is an indication that they are creating a significant burden on public coffers. Means-tested welfare programs comprise a significant share of federal and even state expenditures. Total federal expenditures for the programs examined in this study amounted to nearly half a trillion dollars in fiscal year 2012, and states spend an additional $180 billion of their own money on Medicaid alone.3 Moreover, those who receive welfare tend to pay little or no income tax. By using welfare programs immigrants may strain public resources, harming taxpayers and making it more difficult to assist the low-income population already in the country. If immigrant use of welfare is high, then it is an indication that immigration policy may need to be changed to select immigrants less likely to use these programs.4
The second reason to examine welfare use is that it can provide insight into how immigrants are doing in the United States. Accessing welfare programs is an indication that immigrants are struggling, or perhaps that some immigrants are assimilating into the welfare system. Thus, welfare use is a way of measuring immigrants' impact on American society, as well as their adaptation to life in their adopted country. Of course, it is by no means the only measure of these things.
Methodology
Data Source. The Survey of Income and Program Participation (SIPP) is a longitudinal dataset consisting of a series of "panels". Each panel is a nationally representative sample of U.S. households that is followed over several years.5 This study focuses on the panel begun in 2008, with 2009 as the first year of complete annual data. Data is collected on SIPP households for every month of the year, but the household interviews are divided into "waves" that cover four-month periods. In addition, the interviews are staggered. For example, in May households are asked about welfare use in January, February, March, and April. This means that data collected in February, March, and April of each year will include some information about welfare in the prior calendar year. Only welfare used during the 12 months of 2012 are reported in this analysis. (Appendix Tables A4 to A6 report welfare use for 2009 to 2011.)
The SIPP panel begun in 2008 includes more than 25,000 households over the full calendar year of 2012.6 The SIPP produces estimates of the immigrant population that are similar to other Census data. The 2012 American Community Survey, the largest annual survey conducted by the Census Bureau, shows 16.4 million immigrant-headed households compared to the 16.2 million in the 2012 SIPP, only about a 1 percent difference.
Why Use the SIPP? The key feature that distinguishes this analysis from most other research on immigrant and native welfare use is that it uses the SIPP. To the best of our knowledge, no other study on immigrant and native welfare use has used the 2009 to 2012 SIPP data. The SIPP is ideally suited for studying programs because, unlike other Census surveys that measure welfare, the SIPP was specifically designed for this purpose. As the Census Bureau states on its website, the purpose of the SIPP is to "provide accurate and comprehensive information about the income and program participation of individuals and households."7 Like all Census surveys of this kind, welfare use is self-reported by respondents.
In addition to the SIPP, the only other government surveys that identify immigrants and at the same time measure welfare use for the entire population are the American Community Survey (ACS) and the Current Population Survey's Annual Social and Economic Supplements, often abbreviated as CPS ASEC or just ASEC. The ASEC is also sometimes referred to as the March CPS because the data is collected in that month. The ACS is a very large survey, but only asks about a few programs; moreover it is not focused on welfare and, as we will see, research shows it significantly under-reports participation in the few programs it does measure. The ASEC asks about many different programs, but its primary purpose is to gather information on the labor force, not welfare use. Moreover, unlike the SIPP, the ASEC asks about welfare only once in March of the calendar year after the programs were used. Respondents sometimes forget about programs used more than a year prior when asked in March of the following year. Researchers refer to this as recall bias. There is general agreement among researchers that, because of the way the ASEC is designed, it significantly understates use of several different programs.
The Superiority of SIPP Data. An extensive analysis comparing administrative data to eight different government surveys, including the ACS and ASEC, conducted for the Department of Health and Human Services (HHS) concluded that the "SIPP performs much better than other surveys in identifying program participants." By interviewing respondents multiple times during the year, and focusing on welfare programs, the same analysis found "that SIPP's approach is clearly effective for program participation" and that "SIPP estimates exceed those of other surveys by a wide margin."8
Research by the Social Security Administration focused on SSI receipts also found that the SIPP provides a more accurate picture of programs' use than the ASEC. The SIPP is more likely to identify those using programs and at distinguishing the particular programs being used.9 A study published by the Urban Institute also shows that under-reporting of welfare programs is a larger problem in the ASEC than the SIPP.10 A new analysis of Medicaid use in the SIPP also finds that it better captures Medicaid use than the ASEC.11
Our own analysis also supports the conclusion that the SIPP is a much more accurate data source for measuring welfare use than the ASEC.12 Table A1 in the appendix shows a comparison between the ASEC and the SIPP for 2012. In general, the SIPP shows higher rates than the ASEC. These higher rates are more consistent with administrative data. Table A1 also indicates that the gap between immigrant and native use of welfare is significantly larger than the already large gap shown in the ASEC. Put a different way, the more accurate SIPP shows a wider gap between immigrant and native households in welfare use than other surveys not designed to measure welfare use.
This does not mean that the SIPP perfectly measures welfare programs. There remains some under-count of program use in the SIPP, particularly of the dollar value of programs received. Thus, the SIPP is better at determining whether households are using a particular program than it is at the dollar value of the benefits received. Nonetheless, prior research and our own analysis indicate that it is the best data available for evaluating participation in welfare programs by socio-demographic characteristics.
The main disadvantage with using the SIPP is its complex methodology. As discussed above, the survey is divided into four separate groups of respondents (referred to as rotation groups) who are interviewed every four months on a staggered schedule (referred to as waves) over the course of several years. This makes the raw data from the survey significantly more difficult to use than other surveys.13 As a result, most researchers have used the ASEC to measure immigrant and native welfare use. By using the SIPP, this study provides the most accurate picture of welfare use by immigrant- and native-headed households to date.
Programs Examined. The major welfare programs examined in this report are Supplemental Security Income (SSI), Temporary Assistance for Needy Families (TANF), the Women Infants and Children food program (WIC), free or subsidized school lunch, food stamps (Supplemental Nutrition Assistance Program, SNAP), Medicaid, and public housing and rent subsidies. Although we report figures for SSI and TANF separately, the SIPP variable used to measure all cash welfare includes several small federal programs such as those for low-income veterans and state assistance programs in addition to SSI and TANF.14
In the case of housing programs, unlike individual food programs for example, subsided housing and public housing cannot be used at the same time. However, it is the case that some households moved from one type of supported housing to another type of supported housing. For this reason, the total use of housing reported in the tables is often less than the sum of subsidized and public housing.15
Unit of Analysis. This report analyzes welfare usage at the household level. This means that a household is counted as using welfare if any one of its members used welfare during 2012. One challenge to conducting a household-level analysis over a full year is that household composition changes — families change addresses and individuals move in and out. To maintain consistency, the analysis defines households based on their characteristics in January. A household consists of a January head and all of the people who lived with him or her throughout the year.16 If someone moves out of the household during the year and then receives welfare, it is not counted as welfare used by that household.
Household characteristics — e.g., immigration status, race, age — are determined by the January head. For example, a household is considered to be an immigrant household based on the head's response in January. This is necessary because in a tiny number of cases the head reports different characteristics later in the year.
Examining Welfare Use by Household. A large body of prior research has examined welfare use and the fiscal impact of immigrants by looking at households because it makes the most sense. Perhaps the largest study of its kind was done by the National Research Council in 1997. The NRC did a household-level analysis in their fiscal estimates because "the household is the primary unit through which public services are consumed."17 In their fiscal study of New Jersey, Deborah Garvey and Thomas Espenshade also used households as the unit of analysis because "households come closer to approximating a functioning socioeconomic unit of mutual exchange and support."18 Other analyses of welfare use and programs, including by the U.S. Census Bureau, have also used the household as the basis for studying welfare use.19 The late Julian Simon of the Cato Institute, himself a strong immigration advocate, also argued that it did not make sense to examine individuals when looking at the fiscal impact of immigrants.20 In addition, some of the welfare use variables in the SIPP are reported at the household level, not the individual level.
The primary reason researchers have not looked at individuals is that, as Simon points out, eligibility for welfare programs is typically based on the income of all family or household members. Moreover, welfare benefits can often be consumed by all members of the household, such as food purchased with food stamps. Also, if the government provides food or health insurance to children, it creates a clear benefit to adult members of the household who will not have to spend money on these things.
Some advocates for expansive immigration argue that household comparisons are unfair or biased against immigrants because someday the children who receive welfare may pay back the costs of these programs in taxes as adults. There are a number of problems with this argument.21 The biggest is that excluding children obscures the fundamental issue that a very large share of immigrants are unable to support their own children. In terms of the policy debate over immigration and the implications for public coffers, this is a very important finding.
Weighting. All means and percentages are calculated using the longitudinal weights provided with the data by the Census Bureau. The longitudinal weights are specifically designed to provide accurate yearly estimates by eliminating households with partial-year records and statistically adjusting for those that drop out of the survey.22 All standard errors are also calculated using the longitudinal replicate weights provided by the bureau.
Findings
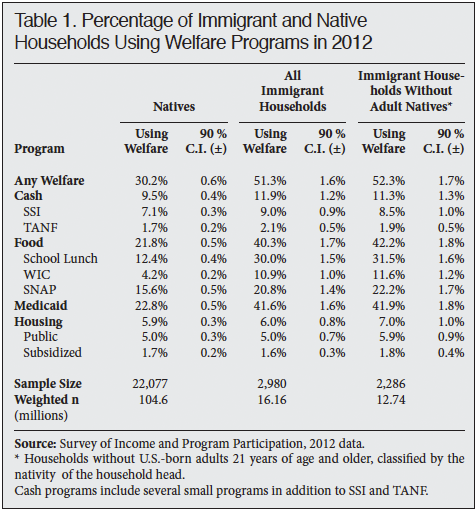
Overall Use Rates. Figure 1 reports use of welfare programs for households headed by immigrants and natives. The figure shows that welfare is common for both immigrant and native households, with slightly more than half of immigrant households and somewhat less than one-third of native households using at least one major program during 2012. Looking at broad categories of welfare programs (e.g. cash or food assistance) shows that, with the exception of housing, the higher use rates for immigrants are all statistically significant.23 Table 1 reports welfare use and confidence intervals for immigrant and native households in more detail than Figure 1. Throughout this report we follow the Census Bureau practice of reporting 90 percent confidence intervals and report statistical significance accordingly.24 Looking at specific programs, Table 1 shows that immigrant households have higher use of SSI, free/subsidized school lunch, WIC, SNAP, and Medicaid. For public housing, subsidized housing, and TANF there is no statistically significant difference between immigrant and native households. Thus, for five of the eight major welfare programs, immigrant use is higher than native use. There are no programs for which native households have statistically higher use than immigrant households.

Means-tested programs are linked and it is very common for a household or even individuals to use one or more programs at a time. Of immigrant households using at least one welfare program, 71 percent used two or more programs; for native households, 64 percent used two or more programs. Multiple program use is the norm for both types of households. Immigrant-headed households using any welfare program reported that they accessed 2.4 programs on average annually; for natives it was 2.3 programs in 2012. Thus, while immigrant households are more likely to use welfare, once on welfare the average number of programs used is about the same for both groups.25
It should be noted that not all persons in immigrant households are immigrants or the U.S.-born children of immigrants. A modest share, roughly 9 percent, are native-born adults 21 and older — typically the spouses of immigrants. It is possible that welfare received by these native-born adults partly explains the high welfare use rate of households headed by immigrants. The far-right-hand columns of Table 1 show this is not the case. When immigrant households with native-born adults are excluded, welfare use for immigrants is actually slightly higher, though the increase is not statistically significant.
No One Program Explains Results. Overall, Table 1 and Figure 1 show a significant difference in the share using welfare between immigrant and native households — 51 percent vs. 30 percent. This is a 21 percentage-point difference. But no single program accounts for this disparity. Table 2 reports welfare use overall, excluding one program at a time. For example, use of the subsidized school lunch program is very common. If we do not count that program, the share of immigrant households using at least one welfare program would be 46 percent vs. 28 percent for native households — an 18 point difference. Thus the inclusion of the school lunch program in the analysis only slightly increases the gap between immigrant and native households. Almost all of the difference in the overall use of welfare between immigrant and native households remains if that program is excluded.26

Medicaid is both the most commonly used program for immigrant and native households and has by far the largest budget. Nevertheless, if that program is excluded it is still the case that 44 percent of immigrant households use one or more welfare programs compared to 26 percent of native households — a 19 percentage-point difference. (Table 2 shows the actual gap is 18.7 percentage points) Table 2 shows that excluding any single program does not eliminate or even substantially reduce the gap in immigrant and native welfare use.
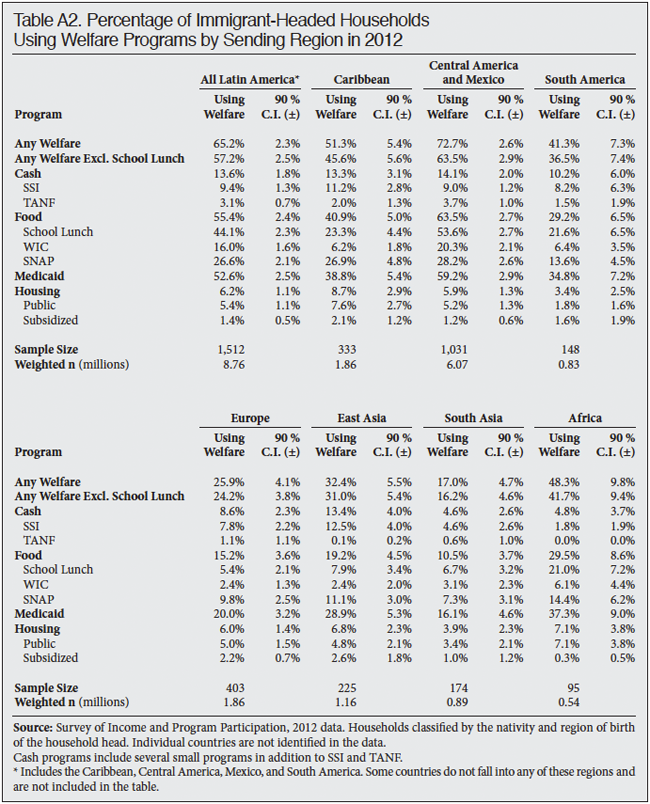
Welfare Use by Sending Region. The Census Bureau asks respondents about their country of birth, but does not include that information in the public-use data files of the SIPP. Instead, the countries are re-coded into broader geographical regions of the world.27 Figure 2 reports overall welfare use by sending region. Appendix Table A2 reports detailed welfare use by region. Looking at welfare use by sending region, households headed by immigrants from Central America and Mexico have by far the highest welfare use at nearly 73 percent. The differences with natives are statistically significant for all programs except housing. Immigrants from the Caribbean, Africa, and South America also tend to have high overall welfare use rates. Rates tend to be lowest for immigrants from East Asia, Europe, and South Asia. South Asian immigrants in particular have low use rates relative to natives across the board, using significantly less welfare than natives overall and for most specific programs.

When looking at welfare by sending region, Table A2 shows that, in general, the big difference between most immigrant-sending regions and with natives is for food programs and Medicaid. Though in the case of Latin American immigrants, particularly those from Central America and Mexico, welfare use is also significantly higher for cash programs than it is for natives.
Welfare Use 2009 to 2012. Tables A3 to A6 in the Appendix report welfare use for immigrant and native households from 2009 to 2012 using the SIPP. The tables show that welfare use in 2012 was very similar to the rates in 2009, 2010, and 2011. The difference between immigrant and native households was statistically significant overall, as well as for Medicaid, food programs, and cash programs in all four years. In contrast, immigrant households were not more likely to use housing programs at any time from 2009 to 2012. Tables A3 to A6 indicate that there was nothing unusual about 2012 in terms of the relative use rates of immigrant and native households compared to the prior three years.
Months on Welfare. Because it is a longitudinal survey, the SIPP allows for comparisons of means-tested programs for the same households at different points in time. Table A7 in the Appendix shows the average months of welfare use in 2012 for immigrant and native households using welfare. So the table reads as follows: In 2012, immigrant households using any program used one or more programs for 10.2 months on average, compared to 9.8 months for native households.28 While not a large difference, it is statistically significant. In general, Table A7 indicates that immigrant and native households on welfare used the programs for similar lengths of time in 2012. Thus, the main difference between the two populations is that immigrant households tend to be more likely to use welfare, but once on a program they use it for about as long as native households.
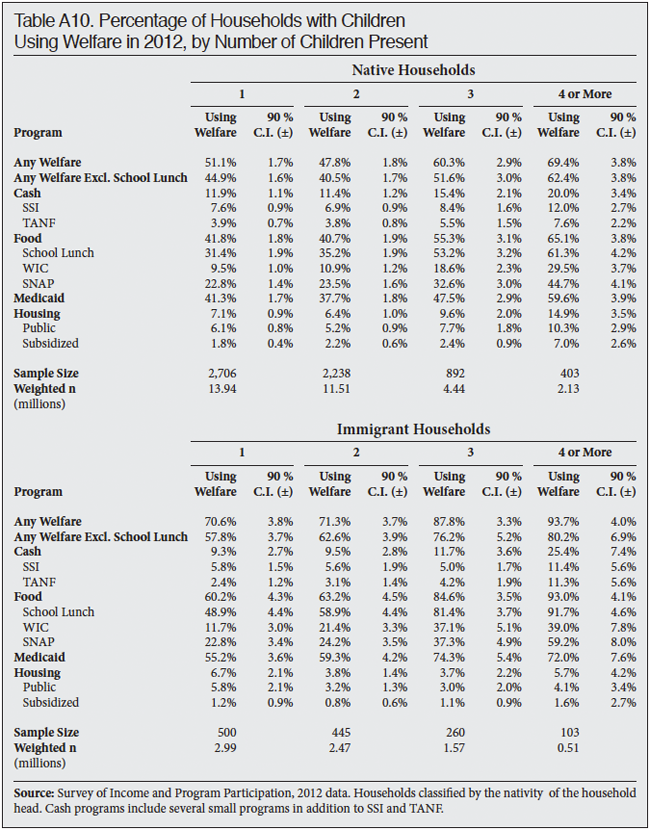
Households with Children. Figure 3 reports welfare use for immigrant and native households with children. Not surprisingly, welfare use is much higher for households with children than for all households as shown in Figure 1 and Table 1. The nation's welfare system is specifically designed to help households with children. Programs like WIC, free/subsidized lunch, and Medicaid for children (referred to as the Children's Health Insurance Program) were explicitly created for those under age 18. TANF, formerly called Aid to Families with Dependent Children, is also designed to help low-income children and their families. Other welfare programs benefit children as well.

Even though many welfare programs are targeted at households with children, it is still remarkable that 76 percent of immigrant households with children and 52 percent of native households with children reported in 2012 that they used at least one welfare program. These figures are so high that they seem almost implausible. It must be remembered that these figures are based only on self-reported use of welfare programs in the public-use files. Moreover, a Census Bureau report published in December 2014 using 2011 SIPP data showed that 65 percent of the nation's children live in a household using one or more welfare programs. While the results in Figure 3 may seem incredibly high, they are entirely consistent with what the Census Bureau itself has found.29
The left side of Table 3 provides more detail on welfare use for households with children. Immigrant households with children have statistically higher welfare use than their native counterparts for food assistance and Medicaid. For cash programs the difference is not statistically significant and the native rate is higher for housing programs.
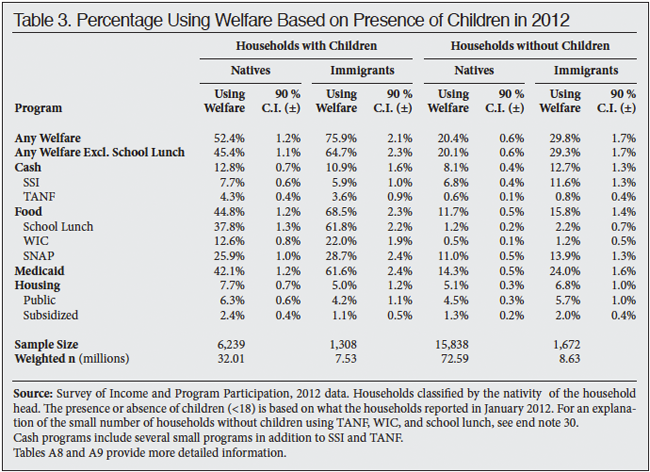
Figure 3 and Table 3 make clear that a very large share of immigrants come to America with children or have children after they arrive and struggle to support them. As a result, they end up using the welfare system. We can see this most clearly by looking at the WIC and subsidized school lunch programs. In 2012, 49 percent of immigrant households with children under age five, the target population for this program, accessed the WIC program. It is also the case that 70 percent of immigrant households with school-age children (five to 17 years of age) use the school lunch program. The comparison figures for native households with children under age five are 30 percent for WIC and 43 percent for subsidized lunch for native households with school age children.
While the impact on taxpayers is certainly a concern, the larger issue is that we have an immigration policy that allows people to settle in the country, of whom half to two-thirds turn to taxpayers for help feed their children. To be sure, the rates for native households with children are also high. It might be more accurate to put things this way: At a time when many Americans struggle to provide for their own children, we are adding millions of immigrants who are even less likely to be able to do so.
A large share of the welfare used by immigrant households is received on behalf of U.S.-born children. Of all immigrant households using at least one welfare program, 64 percent have one or more U.S.-born children. There is simply no question that many immigrants have children after they arrive and find it difficult to provide for them. This, of course, does not mean they had the children to get welfare. Nonetheless, many immigrants turn to taxpayers and the welfare system for support because they unable to provide for their own children.
Households without Children. Figure 4 and the right side of Table 3 show that 30 percent of immigrant households with no children used one or more welfare programs in 2012, compared to 20 percent of native households with no children.30 In fact, Table 3 indicates that immigrant households without children have statistically significant higher rates of welfare use than native households without children overall; and for every type of welfare program — cash, food, Medicaid, and housing.31 Thus, it is not the case that the presence of U.S. children by itself explains the relatively high welfare use among immigrants. Even when no children are present, U.S.-born or foreign-born, immigrant-headed households report high rates of welfare use relative to native-headed households with no children.

Welfare Use Based on Number of Children. Immigrants tend to have more children on average than natives.32 However, it still must be remembered that more than 70 percent of immigrant households with children have only one or two immigrant children. Most immigrant families are not large. Table A10 in the Appendix reports welfare use based on the number of children in each household. When we look at households with the same number of children we find that immigrant use rates tend to be significantly higher overall, and for some food programs and Medicaid. There tends to be little difference in other programs.
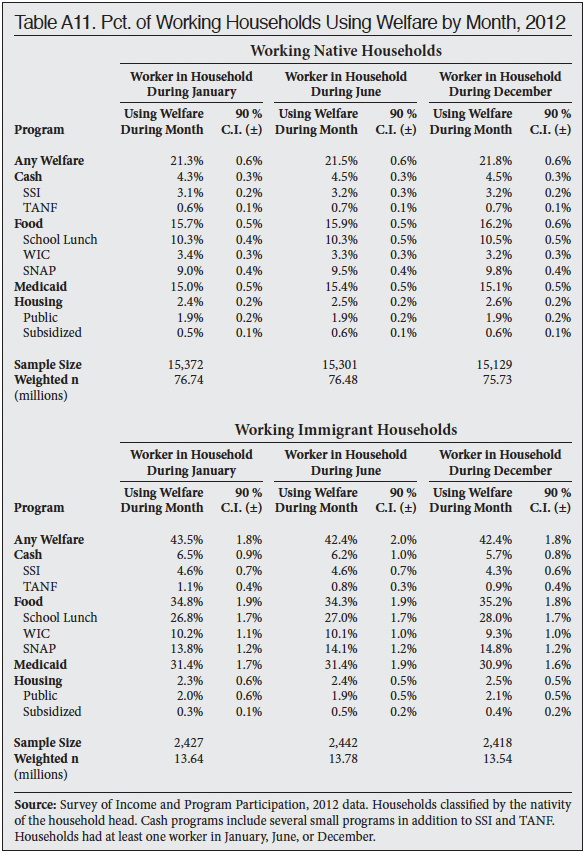
Working Households. Figure 5 reports welfare use for households with at least one individual who worked during 2012. Table 4 provides more detail for working households. It may be surprising to some, but Figure 5 shows that, overall, and for most welfare programs, use rates are not that different for households that work than for all households. This is the case for both immigrants and natives. There are several reasons for this, but the most important is that the nation's welfare system is explicitly designed to assist low-income workers with children, especially after the 1996 welfare reform. It is very common for people to work full- or part-time for at least some portion of the year and to also use welfare programs. For example, a family of two children and a single parent who works full-time earning $20,000 a year would meet the income requirements for most welfare programs in almost every state. By design, work, even full-time work, does not preclude welfare eligibility. Put a different way, people can be very hard-working but still make extensive use of the welfare system, especially if they have children.

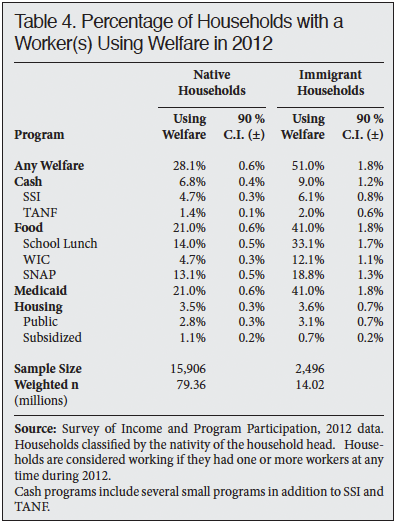
The vast majority (87 percent) of immigrant households had at least one worker in 2012. In fact, the rate is higher than the 76 percent rate for native households. But as Figure 5 makes clear, the majority of immigrant households (51 percent) with a worker during the year still accessed one or more welfare programs. Table 4 shows more detailed information for working immigrants and natives. At 28 percent, the welfare use rate for native households with at least one worker is certainly not low. Welfare use by working households is extremely common. In fact most households, immigrant or native, receiving welfare in 2012 had at least one worker during the year.
Figure 5 and Table 4 report welfare use for households with at least one worker during the year. But this could be due to households with part-year workers who access welfare when the worker is unemployed. Table A11 in the Appendix reports welfare use for the months of January, June, and December. In general, Table A11 shows that welfare use is lower when examined by month. In January 2012, of immigrant households that had a worker in that same month, 44 percent used at least one welfare program; the corresponding figure for natives was 21 percent. The months of June and December 2012 show a very similar pattern to January. Table A11 indicates that the share of both working immigrant and native households using the welfare system is somewhat lower when looked at monthly. Lower monthly use rates make sense for working households as it is less likely that a household will use welfare in the course of the month than in the course of an entire year. But what is important about Table A11 is that the gap between immigrants and natives remains roughly as large as the yearly analysis shown in Table 4. The only program that is rarely used when a worker is present is TANF.
Use of the other programs is common for working households whether we look at yearly or monthly data. To be clear, this fact does not represent cheating. Rather it reflects the explicit intent of the nation's welfare system. The welfare system is designed to help low-income workers.
Figure 5, Table 4, and Appendix Table A11 point to a key finding of this analysis: Work does not equal self-sufficiency when it comes to the welfare system. This means that bringing workers into the country to fill low-wage jobs will often create very large costs for taxpayers in the form of welfare. This fact should be considered when debating proposals to bring in workers.
Welfare Use by Education Level. Table 5 reports welfare use by the education level of the household head. Education has become the single best predictor of income in the modern American economy. Not surprisingly, the table shows huge differences in welfare use by educational attainment. Households headed by better-educated immigrants, like their native-born counterparts, have the lowest welfare use, while those with the lowest education tend to have the highest use. This is especially true for the least-educated immigrant households.

In 2012, 76 percent of immigrant households headed by a person who had not graduated high school used at least one welfare program. For immigrant households headed by someone with only a high school education, 63 percent used at least one welfare program. It is not just that overall rates of welfare use are high for less-educated immigrant households, it is also the case that use of individual programs is high. Table 5 shows that of households headed by immigrant high school dropouts, 19 percent used a cash program and for those with only a high school education, cash assistance use was 14 percent. Use of food programs was also very high at 64 percent for those households headed by immigrant dropouts and 53 percent for those headed by immigrants with only a high school education. Moreover, two-thirds of households headed by immigrants with less than a high school education had one or more people enrolled in Medicaid, as did half of immigrant households headed by immigrants with only a high school degree.
While these figures may seem almost unbelievable, it should be pointed out that prior analysis of the Current Population Survey (CPS) showed that 59 percent of households headed by an immigrant without a high school education used one or more welfare programs and for those with only a high school education it was 42 percent.33 As discussed in the Methodology section, the CPS understates welfare use relative to the SIPP. Nonetheless, the CPS shows the same pattern of extraordinarily high rates of welfare use for the less-educated. Thus, the very high overall welfare use rates for less-educated immigrant households shown by the SIPP is entirely consistent with prior analysis. Also the rates for less-educated natives, while often not as high as for immigrants, are still extremely high, as shown in Appendix Table A13. Welfare use rates for less-educated immigrants from the SIPP are certainly striking, but not unprecedented or unexpected.
The relevant policy question is not whether immigrants and natives with the same level of education have higher or lower welfare use rates. Assuming immigration is supposed to benefit the United States, then the key policy question is whether immigrants in the United States, whose presence reflects our immigration policy, use welfare at higher rates than natives. More specifically, what criteria for immigrant admission might be used when admitting immigrants if self-sufficiency is a policy goal?
Table 5 makes clear that less-educated immigrant households are extremely heavy users of welfare relative to average native households. The high use of welfare among the less-educated native-born population has no implications for immigration policy, as they are already here. But the high rate for less-educated immigrants indicates that something may be wrong with an immigration policy that allows in so many people who are unable to support themselves or their children. Thus it may make sense in the future to move to an immigration system that selects immigrants who are unlikely to need the welfare system.
The Most-Educated Immigrants. Table 5 shows that welfare use for the most-educated immigrant households is surprisingly high at 26 percent. This is a good deal higher than the 13 percent shown for college-educated native households, as shown in Appendix Table A13. Furthermore, immigrant households headed by college graduates have statistically significant higher welfare use for cash, food, Medicaid, and housing programs than native households headed by college graduates. This indicates that factors other than education play a role in explaining the high welfare use of immigrant households in general.
Working Households by Education. Appendix Table A14 reports welfare use for working households by education. All of the households in the figure had at least one worker during the year. As already discussed, work is no guarantee of self-sufficiency. This is especially true of households headed by someone without a high school education or only a high school education. The combination of work and welfare is extremely common for less-educated households. It is not enough to say that allowing in less-educated immigrants to fill low-wage jobs is simply a matter of matching willing employers with willing workers. The potential impact on taxpayers must be considered. The evidence presented here indicates that the impact of less-educated immigrants on taxpayers is likely to be large and negative.
These results raise the question of whether it makes sense to continue to admit less-educated immigrants to fill lower-wage, lower-skilled jobs. To be sure, working households headed by less-educated natives also have high use of welfare. But they are already in the country. In contrast, future immigration policy can be changed to admit immigrants less likely to access the welfare system.
Welfare Use by Year of Entry. The SIPP asks immigrants when they came to the United States. Figure 6 reports welfare use based on when household heads said they came to the United States. Table A15 in the Appendix reports more detailed welfare use by length of residence in the United States for specific programs. Figure 6 reads as follows: of households headed by immigrants in the country for fewer than five years, about half access the welfare system. This could be because the heads of the households are eligible, or because there are immigrants in the households who are eligible, or there are U.S. citizens in the households who are eligible, mostly American-born children.

Figure 6 shows that welfare use is high for the newest arrivals as well as for well-established immigrants who have been in the country for many years. Immigrants in the country for more than 21 years tend to be much older than the average native-born person, and they are certainly well established in the country even though they are the least likely to have young children. Yet these long-time households still have welfare use rates that are statistically higher than native households for cash, food, and Medicaid. Welfare use is common among immigrant households regardless of how long the household head has been in the country.
Welfare Use by Age. Table 6 shows welfare use based on the age of the household head. Welfare use tends to be higher for households headed by people under age 40. This is partly because such households are more likely to have young children and because younger workers generally have lower wages. Looking first at the youngest households, those with heads 29 and younger and for those with household heads in their 30s, the big difference between immigrant and native households is in overall use of any welfare program. Immigrants have higher use for some programs, while native use is higher for others. However, other than the higher overall use rate for immigrant households, the differences between immigrants and natives are generally not very large for households with younger heads.

Looking at households headed by immigrants in their 40s shows that their welfare use rates are higher than those of natives in the same age group overall and for school lunch, WIC, SNAP, and Medicaid in particular. Households headed by immigrants 50 to 64 have statistically higher use overall and for cash and food programs as well as Medicaid. And for households with a head over age 65, immigrant use is higher for all four types of programs: cash, food, Medicaid, and housing. In fact, for these oldest households immigrants' use is statistically higher for every specific program except TANF and WIC. Thus, as immigrants age, Table 6 indicates that like natives they become less likely to use welfare, but they also become more likely to use welfare than natives of similar age. This means that it would be a mistake to think that the higher welfare use of immigrant households is simply due to the larger share who are young. Older immigrants use welfare at significantly higher rates than older natives.
Many More Immigrants Are in Poverty. Figure 7 shows the share of immigrant and native households with low incomes. In 2012, the official poverty threshold for a family of three living in the continental 48 states was $18,284.34 The figure shows that immigrant households are 50 percent more likely to be in poverty than native households — 21 percent vs. 14 percent. In addition to those in poverty, households that have incomes that are above the official poverty threshold, but are still low, are also often eligible for welfare. Of immigrant households, 26 percent have incomes between 100 and 199 percent of poverty, while this is the case for 20 percent of native households. The larger share of immigrant households with low incomes helps explain the larger share using welfare.

Figure 8 shows welfare use for immigrant and native households below the official federal poverty threshold. The figure shows that both immigrant and natives households in poverty have extraordinarily high use of welfare. While immigrant households in poverty have higher overall welfare use, they and native households both make extensive use of every type of welfare program. None of this is surprising, as being in poverty makes someone eligible for welfare. (Tables A16 and A17 in the Appendix show detailed welfare use for immigrant and native households in poverty or with incomes 100 to 199 percent of the poverty threshold.) What is most important to understand is not that low-income immigrants make more use of welfare programs than low-income natives; rather it is that immigrants are much more likely to have low incomes. This matters enormously because two-thirds of all households (immigrant and native) receiving some form of welfare reported an annual income of less than 200 percent of the poverty threshold in 2012.35

Immigrant households are much more likely to be low-income because such a large share have low educational attainment. Of immigrant households headed by someone who has not completed high school, 71 percent have an income below 200 percent of poverty. For households headed by an immigrant with only a high school education, 57 percent have an income below 200 percent of poverty. While the figures are similar for native households, a much higher percentage of immigrants than natives have not graduated high school. In short, the higher percentages of immigrants who have modest levels of education means a larger percentage have low incomes, which in turn allows them to access welfare programs.
Refugees and Asylees. Those admitted to the country for humanitarian reasons generally are allowed immediate access to the welfare system. This could make their use of programs very high and thus pull the numbers up for all immigrant households. However, of all permanent legal immigrants admitted in the last three decades, 13 percent were admitted as refugees or asylees; and this number does not include illegal immigrants who are included in the SIPP.36 Thus, humanitarian immigrants do not constitute a large enough share of the total immigrant population to explain the very high welfare use rates observed in Table 1 and Figure 1. Further, administrative data examined by the Congressional Research Service also shows that refugees comprise less than 1 percent of all individuals on SSI and SNAP (food stamps). While this analysis is focused on households, not individuals, the CRS analysis confirms the fact that refugee are simply too small a share of the immigrant population or the nation's overall population to explain the high welfare use of immigrant households.37
There is other evidence that refugees and asylees also do not explain the high welfare use rates of immigrants. Most refugees and asylees in the last 30 years have come from Asia, Africa, and Europe. Latin American immigrants, who comprise nearly half the nation's foreign-born are, with the notable exception of Cubans, overwhelmingly are not refugees or asylees. Yet as Appendix Table A2 shows, Latin Americans have the highest rates of welfare use. Further, while the SIPP does not identify countries, the CPS ASEC does, so it is possible to use that data to focus on those countries that have sent the most refugees. Our prior analysis of the ASEC showed that households headed by refugee-sending countries had almost the same overall welfare use rates as non-refugee sending countries, with somewhat higher rates for cash and housing programs.38 In short, refugee use rates are not that different from immigrants overall, and they are not a large enough share of the total foreign-born population to explain the high welfare use of immigrants.
Welfare Use by Geography
State of Residence. States differ somewhat in the generosity of their welfare systems and the composition of their immigrant populations. The sample size of the SIPP does not allow comparisons of all 50 states. Table A19 in the Appendix shows welfare use for immigrant and native households in the four states with the largest immigrant populations in 2012. The table shows that, overall, immigrant households have higher welfare use than native households in all four top immigrant-receiving states. This overall difference is statistically significant. In terms of specific programs and states, immigrant use is statistically higher than natives for cash, food, and Medicaid in New York and Texas, but not housing. It is higher for food and Medicaid in California and Florida, but not cash and housing. There are no programs in any of these four states in which native households' use is statistically higher than immigrant households. California and New York are often seen as having more generous welfare systems, while Texas and Florida are less generous. But the same pattern holds across all of these states: Immigrant households have higher welfare use overall and for many individual programs than natives, despite the different welfare rules in these states.
Regions of the United States. Table A20 reports figures for the four major regions of the United States. Like the state and national data, the regional data shows that immigrant welfare use is higher both overall and for food and Medicaid in every region. In the West, immigrants' use of cash is also higher than native use. There is no statistically significant difference for housing programs between immigrants and natives, with one exception.39 One thing to keep in mind is that immigrants are not evenly distributed across the regions. For example, 36 percent of all immigrant households live in the Western region, and this is more than the Northeast and the Midwest combined. Thus, the characteristics of immigrants in the West exert a large influence on the national data. This is important because immigrant households in that region tend to have the highest rates of welfare use.
Tax Payments
Income and Payroll Taxes. This report has compared immigrant and native welfare use. This is an important comparison because welfare is one of the key ways immigrant households can differ from native households in terms of imposing fiscal costs. Unlike the costs associated with welfare use, however, all households need the protection of federal law enforcement or need to use the nation's roads and bridges; and nearly all U.S. residents (immigrant or native) use Social Security and Medicare when they retire. But welfare is different because most Americans will never use welfare. The higher use of welfare associated with immigrants indicates that immigrant households are creating a significant fiscal drain in a way that is not true for natives. Of course, it is possible that immigrants pay more in taxes than native households on average, thereby compensating for the higher costs they create for the welfare system. Below we compare immigrant and native household tax contributions to the federal government.
With the exception of Medicaid, the welfare programs examined in this report are paid for almost entirely by the federal government. Even in the case of Medicaid, 58 percent of its costs were born by Washington in 2012.40 About 88 percent of tax revenue paid to the federal government comes from income taxes and payroll taxes (Social Security and Medicaid).41 Figure 9 estimates these taxes for immigrant and native households. The figure shows that immigrant households made lower average tax payments to the federal government in 2012 than did native households.42

On average, immigrant-headed households had tax liability in income and payroll taxes in 2012 that was about 11 percent less than native households, or about 89 cents for every dollar native households pay, based on Census Bureau data. Immigrant households have lower average incomes (from all sources) than native households and are a good deal larger, giving them more tax deductions.43 As a result, their average income tax liability is less than native households. However, the earnings of immigrant households, which are primarily from wages and salary, are very similar to native households.44 Because earnings are the basis of Social Security and Medicare taxes, immigrant and native households make similar tax payments to these programs.45
Tax Compliance and Other Issues. Figure 9 does not represent a fully developed model of immigrant and native tax contributions to the federal government.46 No adjustment is made for the under-reporting of income in Census Bureau data and the resulting impact on tax payments. Equally important, there is no adjustment for the different rates of tax compliance for immigrants and natives, which means immigrant payments are overestimated relative to those of natives. Most prior research indicates that about half of illegal immigrants, who are about one-fourth of all immigrants, are paid "off the books" and do not have taxes withheld from their paychecks.47 Figure 9 takes the tax liability as indicated by Census Bureau data as a given. Nevertheless, the lower income and larger size of immigrant households means that the average tax payments by immigrant households to the federal government are almost certainly less than native households, making it unlikely that they offset their higher use of welfare.48
Conclusion
While most research examining immigrant and native welfare use has relied on the Current Population Survey (CPS), this report has used the more difficult to use, but more accurate, Survey of Income and Program Participation (SIPP). While the CPS shows that immigrant households have higher welfare use than native households, this analysis based on the SIPP shows the gap between immigrant and native households is even larger than previously shown by the CPS. The SIPP shows a 21 percentage-point difference between immigrant and native households' welfare use — 51 percent vs. 30 percent. This a good deal higher than the 15 percentage-point gap shown by the CPS — 39 percent vs. 24 percent. The more accurate SIPP indicates immigrant welfare use is higher relative to native households than previously thought.
If one assumes that immigration is supposed to benefit the country, then immigrant welfare use should be much lower than natives'. Instead, the SIPP shows that, two decades after welfare reform tried to curtail immigrant eligibility, immigrant-headed households are using welfare at much higher rates than native households for most programs. Based on data collected in 2012, 51 percent of households headed by immigrants (legal or illegal) reported that they used at least one welfare program, compared to 30 percent of native-headed households. In addition to having higher welfare use, immigrant households pay less in taxes to the federal government on average than native households.
The vast majority (87 percent) of immigrant households had at least one worker in 2012, higher than the 76 percent of native households. But the relatively low education level of a large share of immigrants partly explains why more than half of working immigrant households accessed at least one major welfare program in 2012. Of immigrant households, 24 percent are headed by someone who has not completed high school, compared to 8 percent of native households. However, among the most educated households, those headed by a person with a bachelor's degree or more, immigrant households are still much more likely to use all forms of welfare than native households. Therefore, other factors such as culture and the exchange of information provided by immigrant social networks also likely play a significant role in explaining immigrant "success" in accessing welfare programs.49
A large share of the welfare used by immigrant households is received on behalf of U.S.-born children. One way to describe what happens in regard to welfare is to recognize that most immigrants come to America to work, and most find jobs. However, many earn low wages because of their education levels, language skills, or other factors. As a result, many immigrants, especially those with children, are eligible for welfare programs, primarily food assistance and Medicaid, and to a lesser extent cash assistance. Well-developed social networks and high welfare use for many different programs in immigrant communities help each new wave of immigrants navigate the welfare system. Put a different way, the nation's welfare system is designed to assist low-income workers, primarily those with children. This describes a very large share of immigrant households and so their use of welfare programs reflects this fact.
It is also worth remembering that the high welfare use by immigrant households is not explained by the presence of adult natives in these households. The presence of adult natives actually slightly lowers the welfare use rates of immigrant households overall.
The discussion of what to do about immigrants' heavy use of welfare should be conducted with the recognition of its complexity. On the one hand, it is not enough to say that welfare use by immigrants is not a problem because illegal immigrants and newly arrived legal immigrants are barred from using most welfare programs. While advocates of expansive immigration often make this argument, it does not reflect the way the welfare system actually works. As discussed at length in the Appendix, restrictions on immigrant use of welfare cover only a modest fraction of legal immigrants at any one time, many programs are not barred, and numerous exceptions negate the restrictions. Further, benefits are often received on behalf of American-born children who have the same welfare eligibility as any other citizen.
Moreover, it is not enough to point out that most immigrants work. Work and welfare often go together. The welfare system, particularly non-cash programs, is specifically designed to help low-income workers. Nor is it enough to argue that low-income immigrants are no more likely to use welfare than low-income natives, when immigrants are much more likely to have low incomes than natives in the first place.
On the other hand, it is incorrect to see high use of non-cash welfare programs by immigrant households as a moral failing on their part. High welfare use among immigrants reflects the realities of the modern U.S. economy, which offers limited job opportunities to the less-educated, and the generous nature of the nation's welfare system, which means that immigrants will be more dependent on welfare programs than the native-born. Further, we should not be surprised that knowledge of the welfare system is extensive in well-networked immigrant communities.
It is also important to not compare today's immigrants with those who arrived 100 years ago during the prior great wave of immigration. Welfare simply did not exist at that time in the same way that it does now. Thus, prior immigration is not really relevant to the issue of current welfare use. When thinking about this issue, it makes more sense to acknowledge that spending on welfare programs is a part of every advanced industrial democracy, including ours. Moreover, we have to recognize that less-educated workers will earn modest wages in the modern American economy. Therefore our immigration policies need to reflect these realities. If we want to avoid this situation, past experience clearly demonstrates that, for practical and political reasons, trying to bar immigrant families that are already here from accessing these programs is not likely to be successful.
Our legal immigration system admits large numbers of less-educated immigrants who are primarily the family members of immigrants already here. Most of these immigrants work, but many are unable to provide for themselves or their children and so turn to the welfare system. If we continue to admit large numbers of less-educated legal immigrants and allow illegal immigrants to remain, most of whom have modest levels of education, then immigrant welfare use will continue to be high in the future.
Appendix: Immigrant Eligibility for Welfare
A number of policies have been adopted that are designed to limit immigrant reliance on welfare. While these policies may reduce immigrant welfare use below what it otherwise would be, they have not prevented immigrant households from making significant use of welfare, often at significantly higher rates than native households. These policies include the public charge doctrine, a bar on new legal permanent residents receiving welfare in their first five years, and a "deeming" requirement to determine welfare eligibility. Further, illegal immigrants are not supposed to use any welfare. I explain these provisions below, including why they do not prevent immigrant households from making extensive use of welfare programs. The restrictions have not had their intended impact because they often apply only to a modest share of immigrants; some programs are not restricted; there are numerous exceptions and exemptions; and some provisions are entirely unenforced.
Public Charge. The public charge doctrine is a long-standing principle that is supposed to preclude non-humanitarian immigrants from entering the country if they are likely to become dependent on the government.50 Further, if people become dependent on the government after arriving in the country and before naturalizing, in theory they could be deported. Refugees and asylees comprised 15 percent of new legal immigrants in recent years and are exempt from this requirement.51 In practice, the public charge doctrine is not meaningful. First, almost no immigrants are excluded from the United States because they are likely to become dependent on the government.52 Second, the regulations governing its implementation once an immigrant is in the country state that only cash programs are counted when determining if someone has become a public charge.53 Thus a household can be accessing food stamps, WIC, school lunch, Medicaid, and be living in public housing, but its residents would not be considered public charges.
Even this very limited approach to public charge is entirely unenforced. In all of 2012, the Department of Homeland Security reported that they had initiated just one case against an immigrant for being a public charge, which was eventually dropped.54 It is not just that the public charge doctrine is meaningless; the Department of Homeland Security actually makes a point of informing new immigrants of the government benefits for which they may be eligible. A significant portion of DHS' "Welcome to the USA" website is devoted to providing information for new immigrants about signing up for government benefits.55
The Five-Year Bar on New Immigrants. Under the 1996 welfare reform law know as the Personal Responsibility and Work Opportunity Reconciliation Act (PRWORA), most new legal immigrants (those issued a green card) are barred from receiving federally funded welfare programs for the first five years after they receive permanent residency.56 However, PRWORA did not cover all programs or all immigrants; and the act's restrictions have been scaled back by subsequent legislation. What remains of the bar has only a modest impact on the share of immigrant households receiving one or more welfare programs for a number of reasons. The most important reason is that, at most, one out of six legal immigrants has been in the country for less than five years.57 Thus, at any given point in time, the vast majority of legal immigrants, who are nearly three-quarters of all immigrants (legal and illegal) in Census surveys such as the SIPP, are not covered by the five-year welfare bar.58
As for those legal immigrants who are within the five-year window, several factors reduce its effect. Immigrants admitted for humanitarian reasons (primarily refugees and asylees) are eligible for all federally funded welfare programs without having to wait five years. These humanitarian immigrants constitute 15 percent of immigrants who arrived in the five year prior to 2012.59 Also, the spouses of U.S. citizens can naturalize after three years and gain access to all welfare programs, negating the five-year bar.60
There are a number of circumstances and exemptions that further reduce the impact of PRWORA. All permanent residents (green card holders) and even illegal immigrants under age 18 can receive federally funded free or subsidized school lunch and WIC.61 In addition, legal immigrants under age 18 and all legal immigrants who become disabled can receive federally funded SNAP, regardless of when they entered the country.62 Moreover, many states also take advantage of an option to use federal funding to provide all pregnant women (legal and illegal) and all legal immigrants under 18 with Medicaid, without regard to the five-year waiting period.63 Finally, a number of states provide welfare to new legal immigrants using their own funds.64
In addition to the circumstances and exemptions described above, some new legal immigrants can access welfare programs by getting credit for work done as temporary workers or even for work done while illegally in the country before they received their green cards. Immigrants have to show that they have worked in the country for 10 years to be eligible for welfare.65 So, for example, if a new green card holder worked on a H-1B, H-2A, or H-2B visa or any combination of work visas for, say, seven years, then he or she only has to work three additional years after getting a green card to access most welfare programs.66 While the five-year bar would seem to significantly reduce welfare eligibility for immigrants, its actual effect is limited.
Deeming. Related to the five-year ban is the concept of "deeming", which was also part of PRWORA. Deeming means that the income of the immigrant's sponsor (for immigrants arriving after 1996), is included or "deemed" when calculating whether an immigrant has income low enough to qualify for welfare. Immigrants are subject to this provision until they or a parent or spouse has worked 40 quarters (10 years).67 Deeming only pertains to immigrants who have sponsors, such as those entering under family-based immigration and some categories of sponsored employment-based immigration. It would not, for example, apply to those who enter under the visa lottery. The idea behind deeming is that if an immigrant needs support in the first 10 years, it should come from the person who petitioned to bring them into the country. Deeming applies only to TANF, SSI, and food stamps and in some states Medicaid. In theory, sponsors could be asked to pay back the costs of welfare benefits used during the deeming period, but this is very rare. The GAO found in 2009, 13 years after PRWORA's passage, that only two states had pursued sponsor repayment.68
Like the five-year bar, the deeming requirement has not stopped immigrant households from accessing welfare programs at very high rates. There are a number of reasons for this. First, it must be remembered that deeming does not prevent receipt of welfare. If the sponsor and immigrant are both poor enough, then their combined income could still allow the immigrant to receive welfare. Second, only about one in seven legal immigrants has been in the country for less than 10 years and is likely to be subject to deeming.69 Third, if the sponsor lives with the immigrant, then his income is typically already counted for determining welfare eligibility. This is, of course, very common as immigrants with sponsors are almost always the spouses or other family members of those who sponsored them. Fourth, deeming does not apply to housing programs, school lunch, or WIC. Fifth, deeming does not apply to immigrants who are under age 18. Sixth, after five years legal immigrants can naturalize; it is three years for the spouses of U.S. citizens. Naturalization renders the 10-year work requirement moot.
Finally, there is the "indigent exception", which creates a 12-month period in which deeming does not apply. An alien can qualify for this exception if the immigrant's income and any money he or she receives from the sponsor is less than 130 percent of poverty.70 In many cases, the indigent expectation completely negates the intent of deeming. Like the other provisions of PRWORA designed to restrict immigrant use of welfare, the regulations and rules covering deeming dramatically circumscribe its impact.
Receiving Benefits on Behalf of Children. Besides all the exceptions to the five-year bar and deeming, new legal or illegal immigrants can receive welfare benefits on behalf of their U.S.-born children, who as American citizens are eligible for all programs at birth. There is no question that this is a relatively common occurrence. In 2010, for example, HHS reported that 46 percent of all families on TANF were "child-only", which means that the adults in the family were not receiving TANF, but the children were. Some 28 percent of these child-only families, or about 13 percent of all TANF-receiving families, had parents with "unknown" citizenship status.71 That is, the parents were ineligible new legal immigrants or illegal aliens so TANF funds were only supposed to be for the children. As for SNAP, the Department of Agriculture is clear that ineligible immigrant parents can still receive benefits on behalf of their eligible children. In 2012, 8 percent of individuals receiving SNAP were the U.S.-born children of non-citizen parents.72 As for housing programs, HUD regulations state that if at least one member of a family is eligible (e.g., a U.S.-born child), then the family can live in federally subsidized housing, though they may receive prorated assistance.73 The cash, food payments, housing subsidies, or Medicaid received by non-eligible immigrants through their children are a clear benefit to the immigrant parents who do not have to provide these things themselves.
In short, the welfare ban on new immigrants covers only a small fraction of legal immigrants at any one time, numerous exceptions and circumstances negate the waiting periods for welfare, and new legal immigrants and illegal immigrants can still benefit from welfare programs through their U.S.-born children. While restrictions on immigrant welfare use certainly can impact some individuals, its effect has not prevented immigrant households from making extensive use of the nation's welfare system.
Illegal Immigrant Eligibility. As already discussed, illegal immigrants under age 18 are eligible for free and subsidized school lunch and the WIC program. Also, pregnant illegal immigrant women can be enrolled in Medicaid in some states. With the exception of fraud or administrative errors, illegal immigrants should not directly receive welfare program other than those listed above. However, like new green card holders who are themselves ineligible, illegal immigrants can receive SSI, TANF, and SNAP on behalf of their U.S.-born children. The administrative data discussed above for citizen children living with non-citizen parents receiving these programs includes some number of illegal immigrants. Illegal immigrants can also live in public housing if they have U.S.-born children and their U.S.-born children can also be enrolled in Medicaid. As is the case with new legal immigrants, the cash, food assistance, housing subsidies, and Medicaid received by the children of illegal immigrants are a clear benefit to the parents.


End Notes
1 See Table A1 in the Appendix for a comparison of the Current Population Survey Annual Social and Economic Supplement and the SIPP.
2 Decision Demographics has 28 years of experience in analyzing Census Bureau data.
3 "Growth in Means-Tested Programs and Tax Credits for Low-Income Households", Congressional Budget Office, 2013. The 2013 actuarial report on Medicaid shows state expenditures in 2012. See Table 1 in "Actuarial Report on the Financial Outlook for Medicaid 2013", Centers for Medicare and Medicaid, 2013.
4 Immigration policy is focused on the selection criteria and numerical limits on who may come. Immigrant policy deals with what benefits, privileges, and rights should be extended to the foreign-born, such as welfare eligibility.
5 The SIPP does not cover the institutionalized population. It does include a small number of people living in group quarters. By focusing on households, we are excluding those in group quarters.
6 It should be noted that, due to the longitudinal nature of the SIPP, the dataset is a cross-section of households as of 2008, not as of 2012. However, the households do reflect births and deaths among individuals in the survey and also those who move in and out of the households.
7 Survey of Income and Program Participation website.
8 John L. Czajka and Gabrielle Denmead, "Income Data for Policy Analysis: A Comparative Assessment of Eight Surveys", prepared for Office of the Assistant Secretary for Planning and Evaluation (ASPE) and U.S. Department of Health and Human Services (HHS), December 2008.
9 "The Impact of Survey Choice on Measuring the Relative Importance of Social Security Benefits to the Elderly", Social Security Administration Office of Policy, 2007.
10 Laura Wheaton, "Underreporting of Means-Tested Transfer Programs in the CPS and SIPP", Proceedings of the American Statistical Association, Social Statistics Section, 2007.
11 Jamie Rubenstein Taber and Brett O'Hara, "The Case of the Missing Medicaid Enrollees: Identifying the Magnitude and Causes of the Medicaid Undercount in the SIPP", U.S. Census Bureau paper presented at the annual APPAM conference, 2014.
12 The 2012 SIPP found 19.66 million households using SNAP (food stamps) while the ASEC from 2013, which asks about welfare use in the prior calendar year (2012), showed 13.63 million households. The administrative data from the Department of Agriculture shows an annual average of 22.33 million households on SNAP. Administrative data for SNAP can be found here. These numbers indicate that while the SIPP undercounts SNAP use somewhat, the undercount is at least three times as large in the ASEC. It should be pointed out that administrative data does not measure the exact same thing as survey data, and this can explain some of the difference with the SIPP or even the ASEC, on the one hand, and administrative data, on the other.
13 "Census Bureau Launches Redesigned Survey of Income and Program Participation", U.S. Census Bureau press release CB14-20, February 3, 2014. The survey began in 2008 and provides complete year data for 2009 to 2013 and the first nine months of 2014. Other SIPP panels cover different lengths of time. In 2014, the SIPP began implementing a new design that will survey respondents only once a year. It is unclear how these changes will impact data quality in the future.
14 Our reporting of all cash programs therefore includes these programs, and it is for this reason that in a few cases cash use is higher than the sum of SSI and TANF.
15 Housing programs include several different programs and arrangements, most of which are funded by the federal government. State and local governments also have their own programs.
16 Though it may seem unlikely, a tiny share (0.4 percent) of January household heads end up living with another January household head sometime during 2012. In that case, we continue to count each January household head separately. That means if a welfare-using individual lives with two January heads, that individual's welfare use counts toward both heads' household welfare usage. How we treat two immigrant-headed households makes virtually no difference to the results, but we note it here for completeness.
17 James P. Smith and Barry Edmonston, eds., The New Americans: Economic, Demographic, and Fiscal Effects of Immigration, Washington, DC: National Academy Press, 1997. See pp. 255-256.
18 Deborah Garvey and Thomas J. Espenshade, "State and Local Fiscal Impacts of New Jersey's Immigrant and Native Households" in Keys to Successful Immigration: Implications of the New Jersey Experience, Thomas J. Espenshade, ed., Washington, DC: Urban Institute Press, 1997.
19 See Kanin L. Reese, "An Analysis of the Characteristics of Multiple Program Participation Using the Survey of Income and Program Participation (SIPP)" , Census Bureau Working Paper 244, (undated); "Profile of the Foreign-Born Population in the United States: 2000", Census Bureau, December 2001, pp. 23-206; and Robert Rector and Jason Richwine, "The Fiscal Cost of Unlawful Immigrants and Amnesty to the U.S. Taxpayer", Heritage Foundation, 2013.
20 He observed that "One important reason for not focusing on individuals is that it is on the basis of family needs that public welfare, Aid to Families with Dependent Children (AFDC), and similar transfers are received." For this reason, Simon examined families, not individuals. While not exactly the same as households, as Simon also observed, the household "in most cases" is "identical with the family". See Julian L. Simon, "Immigrants, Taxes, and Welfare in the United States 1984", Population and Development Review, Vol. 10, No. 1 (March, 1984), pp. 55-69.
21 But as we will see, immigrant households where no children are present have significantly higher rates of welfare use than their native-born counterparts. Moreover, any hoped-for tax benefit from the U.S.-born children of immigrants is a long way off and uncertain while the costs of welfare to children are real and current. Equally important, if receipt of welfare by the children of immigrants should not be considered because of hoped-for future tax payments, then the same must also be true for welfare received by the children of natives. This of course makes no sense. The cost of welfare for children runs into the hundreds of billions of dollars annually, and is quite real.
22 As a robustness check, yearly weights were also generated by summing the monthly weights and excluding households without full-year data. Results were very similar to the standard approach of using the calendar-year longitudinal weight.
23 This is the case using a 90 or 95 percent confidence interval.
24 For those who would like to use a different interval, simply increase the interval by the appropriate amount. For a 95 percent interval, this can be done simply by increasing the intervals reported in the tables by roughly 19 percent.
25 It is possible that while immigrant households are more likely to have a person on welfare than native households, there are fewer people on a program in the immigrant households. While some of the data in the SIPP is only reported at the household or family level, individual-level data is available for SSI, TANF, Medicaid, SNAP, and WIC. Looking at households that used SSI in January 2012, natives had 1.15 users on average and immigrants 1.17. For native households with at least one person on Medicaid, native households had 1.95 users of the program and immigrant households had 2.19 users. For TANF-using households, it was 2.16 for natives and 2.68 for immigrants. For households using SNAP, native households had 2.5 users on average and immigrant households had 3.09 users. And for WIC it was 1.32 users for immigrants and 1.4 for natives. With the exception of WIC, immigrant households using welfare tend to have somewhat more people using the program.
26 There is no obvious reason to exclude the school lunch program as it cost taxpayers nearly $12 billion dollars in 2012 and furthermore is linked to the subsidized breakfast program, which costs additional billions. Perhaps most important, the fact that so many immigrants allowed into the country cannot afford to feed their own children is by itself an important finding. See "National School Lunch Program fact Sheet", USDA.
27 The Census Bureau includes the following countries in each region in the public-use files of the SIPP: Central America: Belize, Mexico, Costa Rica, El Salvador, Guatemala, Honduras, Nicaragua, Panama, and Central America not specified. Caribbean: Barbados, Cuba, Dominica, Dominican Republic, Grenada, Haiti, Jamaica, Trinidad and Tobago, West Indies, and other Caribbean not specified. South America, Argentina, Bolivia, Brazil, Chile, Colombia, Ecuador, Guyana, Peru, Uruguay, Venezuela, and South America not specified. Europe: Austria, Belgium, France, Germany, Ireland, Holland/Netherlands, Norway, Sweden, Switzerland, United Kingdom, Albania, Bulgaria, Greece, Hungary, Italy, Poland, Portugal, Romania, Spain, Czech Republic, Bosnia and Herzegovina, Croatia, Lithuania, Belarus, Russia, Ukraine, USSR and Europe not specified. Eastern Asia: China, Hong Kong, Japan, Korea, South Korea and Taiwan. South Asia (Census calls the region (South Central Asia): Afghanistan, Bangladesh, India, Iran, Nepal, Pakistan, Sri Lanka and Uzbekistan. Africa: Egypt, Equatorial Guinea, Ethiopia, Eritrea, Ghana, Kenya, Liberia, Morocco, Nigeria, Sierra Leone, Somalia, South Africa, Sudan, Other Africa and North Africa not specified.
28 Table A7 does not measure continuous use, so it is possible that a household went on and off welfare during the year.
29 While the unit of analysis in the Census report is children, not households as it is this analysis, the findings still indicate that it is the norm for children in America today to live in households using welfare. See Lynda Laughlin, "A Child's Day: Living Arrangements, Nativity, and Family Transitions: 2011 (Selected Indicators of Child Well-Being)", U.S. Census Bureau, December 2014. The report was based on SIPP data collected in 2011. The bottom of Table 1 shows 47.9 million children living in households using TANF, WIC, Medicaid, food stamps, or subsidized lunch and 26.4 million living in households not using these programs.
30 The tiny number of households without children that report using programs designed for children reflects the following: For households without children, use of WIC is due to use by pregnant women and children born into the household or who joined it after January. Use of the school lunch program reflects school-age children who joined the household after January. Use of TANF is due to children who joined the household after January and children born into the household after January and women in their final trimester who can also receive the program.
31 In the case of housing programs, the difference is statistically significant at the 90 percent confidence level but not at the 95 percent level.
32 Based on the 2013 public-use file of the American Community Survey, we find that the total fertility rate of immigrants is 2.22 children per woman and 1.79 for native-born women — making immigrant fertility 24 percent higher than native fertility.
33 See Steven A. Camarota, "Immigrants in the United States 2010: A Profile of America's Foreign-Born Population", Center for Immigration Studies, August 2012.
34 The Census Bureau's poverty thresholds can be found here.
35 Some programs can be accessed with income above 200 percent of poverty. More important, a household can earn more than 200 percent of poverty in a calendar year, but have income that was much lower in specific months, allowing them to receive welfare. The income thresholds for welfare are not based on annual income; rather they are based on income at the time of application. So, for example, a person who is laid off from work for part of the year can begin to receive welfare even though his or her reported annual income at the end would seem to be too high to qualify for such programs.
36 Figures are based on the 1982 to 2012 Yearbooks of Immigration Statistics. They include those admitted under Section 203 of the Nicaraguan Adjustment and Central American Relief Act and the Haitian Refugee Immigrant Fairness Act.
37 Letter from CRS dated April 14, 2015, to the Senate Judiciary Committee.
38 Our analysis showed that 36.3 percent of all immigrant households in the ASEC used one or more welfare programs; when refugee and asylee-sending countries are excluded, the rate was 36.0 percent. For cash programs, the use rate was 5.8 percent for immigrants overall and 5.1 percent when refugee countries are excluded. We also found that 4.6 percent of all immigrant households in the ASEC used a housing program(s) and the figure was 4.0 percent when refugee countries were excluded. See Steven A. Camarota, "Immigrants in the United States 2010: A Profile of America's Foreign-Born Population", Center for Immigration Studies, August 2012.
39 At 4.8 percent, native households receiving housing assistance in the South are statistically more likely than immigrants to use housing assistance.
40 See Table 1 in "2013 Actuarial Report On The Financial Outlook For Medicaid", Department of Health and Human Services, 2013.
41 According to Usgovernmentrevenue.com, in 2012 total federal revenue was $2.45 trillion, of which $770.6 billion came from Medicare and Social Security taxes (including disability and the employers' contribution) and $1.375 trillion from income tax. This means that 88 percent of federal revenue collected from taxes and fees came from income tax, Medicare, and Social Security taxes.
42 The SIPP data has some tax information, but much of it is coded as interval level variables, so Figure 9 uses the CPS ASEC. The ASEC includes estimated income taxes and annual earnings in the prior calendar year, so the 2012 figures reported are based on the 2013 ASEC.
43 The average immigrant household was 28 percent larger than the average native household — 3.07 members versus 2.4 members. At the same time, immigrant households' total income was 9 percent smaller, $66,325 vs. $72,018.
44 The average earnings of native households were equal to 98 percent that of immigrant households — $57,089 vs. $58,171.
45 Figure 9 uses the earnings of immigrant and native households to calculate payroll taxes. Medicare taxes, including the employer contribution, are equal to 2.9 percent of all earnings. Social Security taxes (employer and employee) are 12.4 percent of earnings up to $110,100 in 2012, with no taxes above that amount. Figure 9 takes the average earnings of immigrants as reported in the 2012 CPS ASEC and applies these percentages. It may seem surprising that immigrant households have nearly identical earnings to native households. But it must be remembered that immigrant households have on average more workers than native households and this compensates for lower earnings at the individual level. Immigrant households have 1.4 workers on average compared to 1.2 in native households. In contrast, native households have significantly higher income from sources other than earnings, such as investments and interest. This fact, coupled with the smaller size of native households, means that they pay significantly more in income tax.
46 This does not include other taxes collected by the federal government, which account for about 12 percent of federal revenue.
47 See Jeffrey Passel and Rebecca Clark, "Immigrants in New York: Their Legal Status, Incomes, and Taxes", the Urban Institute, 1998; Joel Feinleib, and David Warner, "The Impact of Immigration on Social Security and the National Economy", Social Security Advisory Board, 2005; Robert Rector and Jason Richwine, "The Fiscal Cost of Unlawful Immigrants and Amnesty to the U.S. Taxpayer", Heritage Foundation, 2013.
48 By design, the income tax falls less heavily on those with lower incomes and larger families, and this describes a significant share of immigrants. In contrast, payroll taxes are essentially flat taxes with no adjustments for dependents and no deductions. As a result, immigrant and native liability for these taxes by household are nearly identical. The lower average income tax payments of immigrant households are important because the federal government collects about twice as much revenue each year from the income tax as it does from Social Security and Medicare taxes combined.
49 Marianne Bertrand, Erzo Luttmer, and Sendhil Mullainathan, "Network Effects and Welfare Cultures", The Quarterly Journal of Economics, August 2000.
50 See James R. Edwards, Jr., "Public Charge Doctrine: A Fundamental Principle of American Immigration Policy", Center for Immigration Studies, May 2001.
51 Figures include those admitted under section 202 of the Nicaraguan Adjustment and Central American Relief Act and Haitian Refugee Immigrant Fairness Act between 2008 and 2012 and are from the Yearbooks of Immigration Statistics.
52 Caroline May, "DHS memo reveals limited public charge exclusions, tracking", The Daily Caller, February 12, 2013.
53 "Public Charge", U.S. Citizenship and Immigration Services, last updated September 3, 2009.
54 Department of Homeland Security letter to Sen. Jeff Sessions, February 8, 2013.
56 For the immigrants who were sponsored, typically by a family member, the sponsor's income is considered when determining eligibility for TANF, SSI, and food stamps (for adults) and in some states Medicaid. This is called deeming.
57 It is possible to estimate the share of legal immigrants (green card holders and naturalized U.S. citizens) impacted by the five-year bar. In 2012, DHS estimated that 4.24 million green card holders were in the country who entered from 2005 to 2009 and 1.93 million who entered in 2010 and 2011. (This reflects how DHS chose to group the data; see Table 3 in "Estimates of the Legal Permanent Resident Population in 2012", Office of Immigration Statistics, July 2013.) If we exclude two years (1.7 million) of the 2005 to 2009 arrivals, we get 4.47 million green card holders who entered the United States from 2007 to 2011 living here at the start of 2012. DHS, in the same report, estimates 13.3 million green card holders in the country and the 2012 ACS shows 18.6 million naturalized citizens, for a total legal permanent immigrant population of 31.9 million. Dividing the number of new green card holders by the total legal immigrant population subject to the bar indicates that about 15 percent of all legal immigrants were impacted by the five-year bar at the start of 2012. The rest would have been in the country more than five years or have naturalized. Of course, the actual number is much lower than 15 percent, as more than 800,000 people were issued green cards as refugees and asylees in the five years prior to 2012 and thus are not subject to the bar. For DHS estimates of the green card population see "Estimates of the Legal Permanent Resident Population in 2012", Office of Immigration Statistics, July 2013.
58 We have estimated in prior research that about 28 percent of immigrants in the Current Population Survey are in the country illegally; see Table 36 in Steven A. Camarota, "Immigrants in the United States 2010: A Profile of the Foreign-Born Population", Center for Immigration Studies, 2012. These estimates are consistent with those from the Pew Hispanic Center; see Jeffrey S. Passel and D'Vera Cohn, "Unauthorized Immigrant Population: National and State Trends, 2010", Pew Hispanic Center, 2011, p. 9. It is possible that the illegal immigrant share is slightly different in the SIPP, but both surveys are collected by the Census Bureau and are weighted to the same population controls. Thus, the illegal immigrant share of the total in both surveys should be very similar.
59 Between 2007 and 2011, 5.4 million green cards were issued, of which 791,000 went to refugees or asylees. Figures are based on the 2007 to 2011 Yearbooks of Immigration Statistics and include those admitted under section 203 of the Nicaraguan Adjustment and Central American Relief Act and the Haitian Refugee Immigrant Fairness Act.
60 Almost all other new green card holders have to wait five years.
61 Guidelines issued by the Department of Agriculture state that the free school lunch and breakfast programs are not subject to PRWORA (see p. 32 in "Eligibility Manual for School Meals Determining and Verifying Eligibility", August 2014). Federal regulations covering the WIC program (see Subpart C Participation Eligibility, p. 373) allow states to exclude new legal immigrants and illegal immigrants from WIC, but they are not required to do so and must inform the federal government if they choose to exercise this option. The National Immigration Law Center reported in 2011 that all states have chosen to cover otherwise ineligible legal and illegal immigrants with WIC. (See Tanya Broder and Jonathan Blazer, "Overview of Immigrant Eligibility for Federal Programs", NILC, October 2011.) Our research of polices in states with large immigration populations confirms this conclusion.
62 The Farm Security and Rural Investment Act of 2002 restored SNAP eligibility regardless of time in the United States for all legal immigrants under age 18 and for adult immigrants who are disabled. See "Supplemental Nutrition Assistance Program Guidance on Non-Citizen Eligibility", U.S. Department of Agriculture, June 2011.
63 The Children's Health Insurance Program Reauthorization Act of 2009 provided states this option. The National Immigration Law Center reported in 2011 that almost half of all states have taken advantage of it. See Tanya Broder and Jonathan Blazer, "Overview of Immigrant Eligibility for Federal Programs", NILC, October 2011.
64 For example, many states provide Medicaid to pregnant women and new legal immigrant children without the five-year wait. See Tanya Broder and Jonathan Blazer, "Overview of Immigrant Eligibility for Federal Programs", NILC, October 2011.
65 In some cases, work by a parent or spouse can count toward the 10 years (40 quarters) of work necessary to qualify for welfare. See a recent Congressional Research Service report, "Noncitizen Eligibility for Federal Public Assistance: Policy Overview and Trends", Congressional Research Service, September 2014. It should be noted that, even with 40 quarters of work, individuals are not eligible for SSI in the first five years.
66 It must be remembered that more than half of new green card recipients each year are "adjusting status" from within the United States and are not new arrivals. Thus, a significant share of new legal immigrants are former guestworkers or illegal immigrants who can take advantage of this provision to shorten the five-year period.
67 Pages 7 and 8 of the affidavit that sponsors sign spells out the way their income will counted and for how long for the purposes of deeming.
68 The GAO found that pursuing payment is administratively costly and "since noncitizens who receive benefits after deeming only qualify because both they and their sponsors have very low incomes" it very difficult to collect money. See "Sponsored Noncitizens and Public Benefits: More Clarity in Federal Guidance and Better Access to Federal Information Could Improve Implementation of Income Eligibility Rules", GAO, May 2009.
69 It is possible to estimate the share of legal immigrants (green card holders and naturalized U.S. citizens) who might possibly be impacted by deeming. In 2012, DHS estimated that there were 1.97 million green card holders in the country who entered from 2000 to 2004, 4.24 million immigrants who entered 2005-2009, and 1.93 million who entered in 2010 and 2011, for a total of 8.14 million green card holders who entered during the 12-year period 2000 to 2011. (This reflects how DHS chooses to group the data; see Table 3 in "Estimates of the Legal Permanent Resident Population in 2012", Office of Immigration Statistics, July 2013.) If we exclude two years, or .79 million, of the 2000 to 2004 arrivals, we get 7.35 million green card holders who entered from 2002 to 2011 living in the United States at the start of 2012. This gives a base for those who might be impacted by the 10-year deeming requirement. DHS, in the same report, estimates 13.3 million total green card holders in the country, and the 2012 ACS shows 18.6 million naturalized citizens for a total legal permanent immigrant population of 31.9 million. Dividing the number of new green card holders by the total legal immigrant population subject to the bar indicates that about 23 percent of all legal immigrants, at most, could possibly have been impacted by deeming at the start of 2012. The rest would have been in the country more than 10 years or have naturalized. Of course, the actual number is much lower than 23 percent as nearly one and a half million people were issued green cards from 2002 to 2011 as refugee and asylees and are not subject to deeming. In addition, the half-million visa lottery winners over this time period and roughly 800,000 employment-based immigrants who do not have sponsors are also not subject to deeming. If only sponsored immigrants are considered, then it is likely that only one in seven of the total legal permanent immigrant population could be subject to deeming.
70 The Department of Health and Human Services explanation of deeming, including the indigent exception, can be found here. The Department of Agriculture also has a publication explaining immigrant eligibility, deeming, and how an immigrant is determined to be indigent: "Supplemental Nutrition Assistance Program Guidance on Non-Citizen Eligibility", last updated October 3, 2011.
71 Another 8 percent of the 46 percent of child-only families were in this status for unknown reasons. See Figure B in "Characteristics and Financial Circumstances of TANF Recipients, Fiscal Year 2010", DHS Office of Family Assistance, August 8, 2012.
72 In its report, "Characteristics of Supplemental Nutrition Assistance Program Households: Fiscal Year 2012", the Department of Agriculture does not specify what share of these children have illegal immigrant or non-eligible legal immigrant parents.
73 "HUD Handbook 4350.3: Occupancy Requirements of Subsidized Multifamily Housing Programs", Department of Urban Development, June 2009, "Chapter 3. Eligibility for Assistance and Occupancy".