This report finds that immigrants have been hit somewhat harder by the current recession than have native-born Americans. Immigrants (legal and illegal) now have significantly higher unemployment than natives. This represents a change from the recent past, when native-born Americans typically had higher unemployment rates. The picture is complex, with the least and most educated immigrants experiencing the largest increases in unemployment relative to natives. However, the least educated immigrants still have a lower unemployment rate than their native-born counter parts. (All figures in this report are seasonally unadjusted).
Among the findings:
- Immigrant unemployment in the first quarter of 2009 was 9.7 percent, the highest level since 1994, when data began to be collected for immigrants. The current figure for natives is 8.6 percent, also the highest since 1994.
- The immigrant unemployment rate is now 5.6 percentage points higher than in the third quarter of 2007, before the recession began. Native unemployment has increased 3.8 percentage points over the same period.
- Among immigrants who arrived in 2006 or later unemployment is 13.3 percent.
- The number of unemployed immigrants increased 1.3 million (130 percent) since the third quarter of 2007. Among natives the increase was five million (81 percent).
- Looking at the number of immigrants holding a job shows a drop of 2.1 million (9 percent) from the third quarter of 2007 to the first quarter of this year. For natives, the drop was 4.5 million (4 percent).
- There is no way to know if the current trend will continue, but these very high unemployment rates for immigrants and natives raise the question of whether it makes sense to continue admitting so many new immigrants. In FY 2008, some 1.45 million new immigrants (temporary and permanent) were given work authorization.
- From 1994 until a few years ago immigrants consistently had higher unemployment than natives, though the rates tended to converge over time. By 2005 natives consistently had higher unemployment rates.
- In the second half of 2007 and into 2008 unemployment began to rise slightly faster for immigrants than for natives. By the first quarter of this year, immigrants had higher unemployment than natives.
- Unemployment has risen faster among the least educated immigrants. The unemployment rate for immigrants without a high school diploma has increased 9.9 percentage points since the third quarter of 2007 to 14.7 percent in the first quarter of 2009. For natives without a high school diploma it increased 7.9 percentage points to 19.5 percent during the same period.
- The unemployment rate for immigrants with at least a college degree has increased 3.7 percentage points since the third quarter of 2007 to 6.3 percent in the first quarter of 2009. For natives it increased 1.5 percentage points to 4.0 percent.
- There is little evidence of a labor shortage, particularly for less-educated workers. In the first quarter of 2009 there are almost 31 million natives and immigrants with a high school degree or less unemployed or not in the labor force. (Persons not in the labor force are ages 18-65 and neither working nor looking for work.)
- Even before the recession began, unemployment for young and less-educated natives was very high. In the third quarter of 2007 unemployment was 11.6 percent for those native-born without a high school diploma and 10.6 percent for those (18 to 29) with only a high school diploma.
- States with the largest decline in immigrant employment are Colorado, Georgia, North Carolina, Arizona, Nevada, Minnesota, Massachusetts, New Jersey, Florida, Connecticut, Virginia, and California. Native-born jobs losses also have been significant in most of these states.
- Analysis by job category shows that a major reason for the more rapid increase in immigrant unemployment is that they tend to be employed at the bottom end of the labor market, in occupations hit hard by the recession. However, the larger increase in unemployment for immigrants with a college degree relative to natives with the same education is harder to explain.
Methodology
The statistics in this report come from the public use files of the Current Population Survey (CPS), which is collected monthly by the Census Bureau for the Bureau of Labor Statistics (BLS). The CPS is the primary data source for the nation’s unemployment rate and other labor-force-related statistics. Each CPS includes about 130,000 individuals, roughly half of whom are in the labor force. It does not include those in institutions such as prisons. Like all government surveys, the data are weighted to reflect the actual size and demographic makeup of the U.S. population. The government publishes employment statistics that are both seasonally adjusted and unadjusted from the survey. The figures in this analysis are all seasonally unadjusted. Unadjusted numbers are computationally straightforward and easy for other researchers to replicate. Most researchers outside of the government report unadjusted numbers.1 In fact, the government itself has never reported seasonally adjusted numbers for immigrants and natives.
The figures in this report are reported by quarter. Quarterly data are more statistically robust, especially for smaller populations like immigrants, because they include three months of data. To provide unbiased estimates, all significant tests in this report were calculated using the parameter estimates provided by the Census Bureau.2 Although in general when comparing two populations in Census Bureau data, 90 percent confidence levels for significance tests are often used, we report both 90 and 95 percent confidence levels. In this report we use the terms immigrant and foreign-born interchangeably. Immigrants are all persons who are not U.S. citizens at birth. In the CPS this includes naturalized citizens, legal permanent residents, temporary workers, and illegal aliens.
Findings
The Current Situation
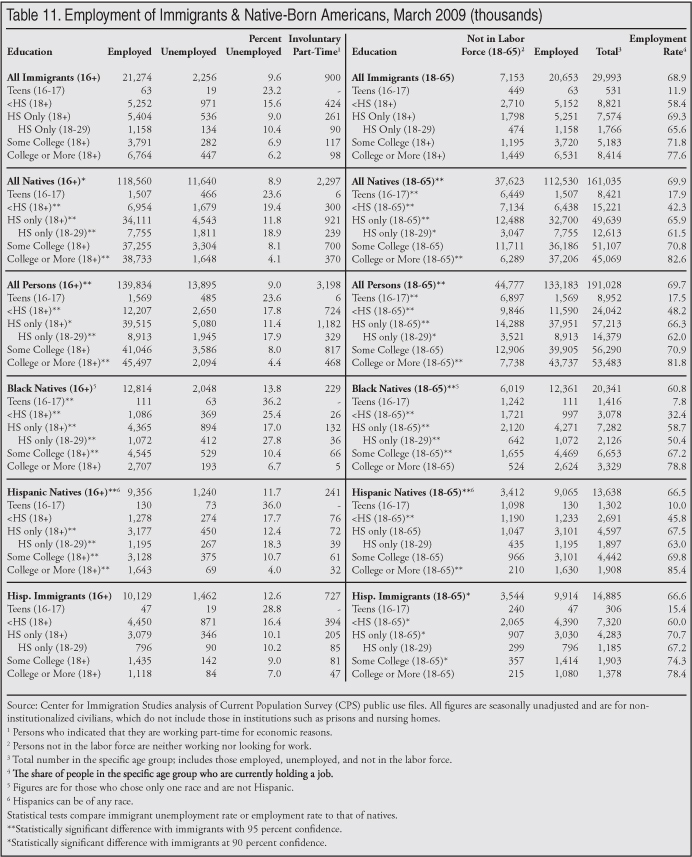
Table 1 shows the unemployment rate for immigrants and native-born Americans in first quarter of 2009.3 The left side of the table compares employment and unemployment; the right side looks at those in and out of the labor force. To be in the labor force one has to either be working or looking for work. The statistical tests in the table compare either the unemployment rate on the left side of the table or employment rate on the right side to the same educational category of immigrants. So, for example, the overall native-born unemployment rate of 8.6 percent is statistically lower than the overall foreign-born unemployment rate of 9.7. However, the 7.8 percent unemployment rate for natives with some college is not statistically different from the 7.7 percent unemployment rate for immigrants with some college. It is important to note that in some cases the foreign-born have higher unemployment while in others the native-born have higher rates. The asterisks only indicate whether the difference is statistically significant.
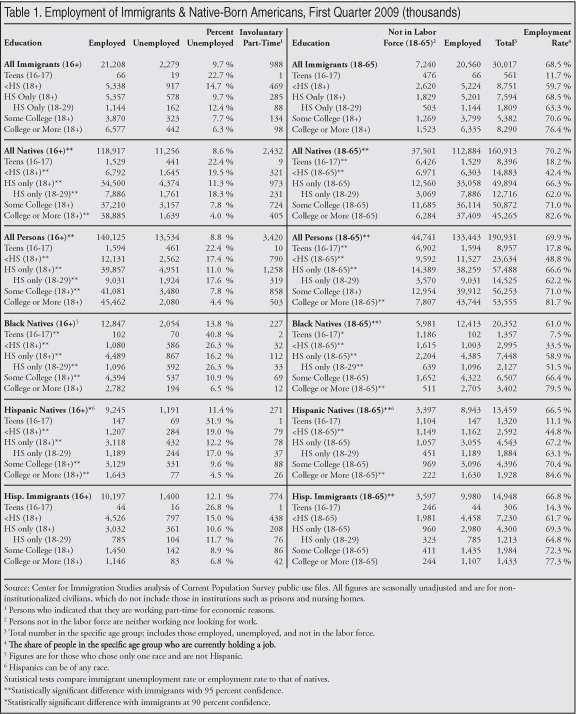
Table 1 shows that, in general, natives with more education tend to have lower unemployment rates than immigrants with the same level of education, while natives with relatively little education have higher unemployment rates than immigrants with the same education. While there are many skilled immigrants, the native-born are much more likely than immigrants to have completed high school. As a result, immigrants are disproportionately represented in lower-wage, entry-level jobs that generally require fewer skills. The natives most in competition with immigrants are those with a similar skill set. This includes teenagers, natives without a high school degree, and natives who have a high school degree but are young. Of workers who are teenagers (16-17) or have not completed high school or are young (18 to 29) high school graduates, 29 percent are immigrants. In contrast, immigrants are 14 percent of workers with a college degree.
Table 1 shows that those native-born workers most in competition with immigrants, particularly illegal immigrants, are having the toughest time in the labor market. Unemployment for native-born Americans without a high school degree is 19.5 percent, and for those who are young and have only a high school degree it is 18.3 percent. The rate for native-born teenagers is also very high at 22.4 percent. The table shows that the situation for native-born minorities, particularly black natives, is even worse.
Before the Recession
The National Bureau of Economic Research (NBER) reports that the recession began in the fourth quarter of 2007.4 The NBER estimates are not based on unemployment: A recession is measured by economic activity. The unemployment rate and number unemployed started to increase after October 2007. The number of immigrants holding a job peaked in the third quarter of 2007, while the number of natives holding a job peaked in the fourth quarter of 2007. We make a number of comparisons in this report to the third quarter of 2007. However, we also provide detailed information for every quarter between the third quarter of 2007 and the first quarter of this year so other points of comparison can also be made. We even provide unemployment figures going back to 1994.
Table 2 reports detailed unemployment statistics for the third quarter of 2007. As in Table 1, the statistical tests are all comparisons with immigrant rates in the same category. Comparing the third quarter of 2007 to the first quarter of this year shows dramatic growth in both immigrant and native unemployment for all education categories. Overall, the seasonally unadjusted unemployment rate for immigrants went up 5.6 percentage points, from 4.1 to 9.7 percent. Native unemployment increased 3.8 percentage points over the same period, from 4.8 to 8.6 percent. While immigrants actually had statistically lower overall unemployment than natives in the third quarter of 2007, they now have statistically higher unemployment. Moreover, the increase in immigrant unemployment of 5.6 percentage points is statistically larger than the 3.8 percentage-point rise for natives.
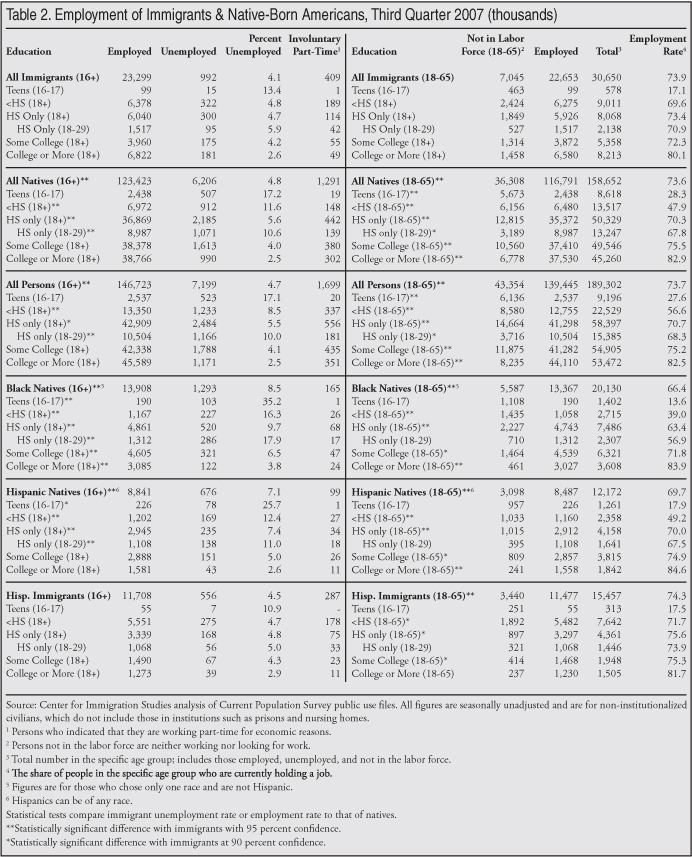
Table 3 compares just the unemployment rates of immigrants and natives in the third quarter of 2007 and the first quarter of 2009. Unemployment for immigrants with less than a high school diploma grew by 9.9 percentage points. For natives with less than a high school education, it grew by 7.9 percentage points. This difference in percentage-point rise — 9.9 vs. 7.9 percentage points — is statistically significant. Not surprisingly, the growth in unemployment for both groups is also statistically larger than for any of the other education categories reported in Table 3. The least educated have been, by far, the hardest-hit group in this recession. And the unemployment rate for high school dropout immigrants has gone up even faster than for their native-born counterparts. Despite the enormous increase in unemployment for immigrants without a high school diploma, the unemployment rate for these least educated immigrants is still statistically lower than for natives with the same education.
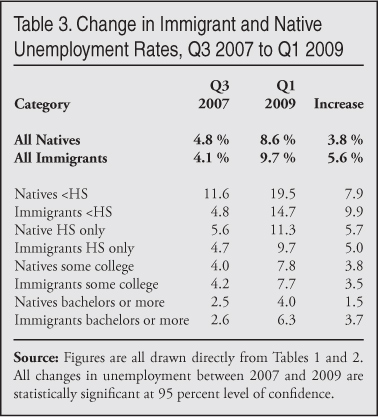
The situation is somewhat different for the most educated. In the third quarter of 2007, the unemployment rate for immigrants and natives with at least a college degree was both low and statistically the same — 2.5 percent for natives and 2.6 percent for immigrants. However, the unemployment rate for immigrants with a college education went up more than it did for natives with the same education. The 3.7 percentage-point rise for immigrants with at least a college degree between 2007 and 2009 was statistically larger than the 1.5 percentage-point rise for natives with at least a college degree. The 6.3 percent unemployment rate for college-educated immigrants now is also statistically higher than the 4.0 percent unemployment rate for natives. Thus, among the most educated, both immigrants and natives have seen a large increase in unemployment rates. But the increase for immigrants has been much more pronounced relative to their native-born counterparts.
Numerical Increase in Unemployment
Analyzing the numerical increase in immigrant unemployment shows that the least educated accounted for much of the increase in unemployment. Of the 1.3 million increase in the number of unemployed immigrants between the third quarter of 2007 and the first quarter of 2009, those with less than a high school education accounted for 46 percent. Those immigrants with only a high school education accounted for 22 percent. Among natives, those with less than a high school education accounted for only 15 percent of the numerical increase. However, those with just a high school education accounted for 43 percent of the increase in native unemployment. For both immigrants and natives the two least educated categories accounted for the majority of the increase in unemployment.
The picture is complex because immigrants with at least a college degree accounted for 20 percent of the increase in the number of unemployed immigrants. Among the native-born, those with at least a college degree accounted for 13 percent of the numerical increase. This is an interesting finding because a somewhat larger fraction of natives have a college degree to begin with, yet these educated natives still accounted for a smaller fraction of the increase in the total number of those unemployed.
If we look at the most educated and least educated (dropouts and college graduates) we find that among the foreign-born these two categories account for 66 percent of the increase in the number unemployed. For natives, the very top and bottom of the education distribution accounted just 28 percent of their increase in unemployment.5 This is due mainly to the fact that high school dropouts comprise a much smaller fraction of natives than they do of immigrants. But it is clear that the increases in immigrant unemployment are concentrated at the ends of the educational distribution, while among natives the concentration is in the middle education categories.
The rise in unemployment for the most educated immigrants is hard to explain. There is no obvious reason why college graduate immigrants should have fared worse in the labor market relative to natives.
Hispanic Increase in Unemployment
The bottom portions of Tables 1 and 2 report unemployment for Hispanic immigrants. They show that Hispanic immigrants accounted for 66 percent of the increase in the number of unemployed immigrants since the third quarter of 2007. Hispanic immigrants accounted for 50 percent of all immigrant workers in 2007. Unemployment among foreign-born Hispanics increased dramatically, from 4.5 percent to 12.1 percent — a 7.6 percentage-point increase. This indicates that Hispanic immigrants were disproportionately hit by the recession. However, unemployment among non-Hispanic immigrants increased dramatically as well. In the third quarter of 2007 it was 3.6 percent, by the first quarter of 2009 it was 7.4 percent — a 3.8 percentage- point increase. Thus, it is not just Hispanic immigrants who have experienced a dramatic increase in unemployment.
Numerical Job Losses
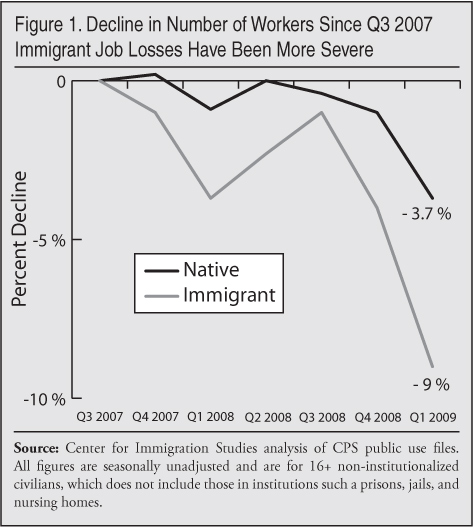
Another way to look at the recession is to examine the number of people holding jobs. Tables 1 and 2 report this information. Since the third quarter of 2007 the number of working immigrants declined 2.1 million, or 9 percent. Among natives the decline in the number working was about 4.5 million, or 3.7 percent. This adds further support to the idea that immigrants are being hit harder by the recession than are natives. Figure 1 reports this information graphically.
The rise in immigrant unemployment was 1.3 million — a good deal less than their 2.1 million job losses. Part of the reason the two numbers do not match is that to be considered unemployed a person has to say he or she is actually looking for work. Otherwise, people are considered out of the labor force and do not figure into the unemployment statistics. The number of immigrants not in the labor force is up about 200,000 since the third quarter of 2007. But if we look at the total 18- to 65-year-old immigrant population, which includes the vast majority of workers, Tables 1 and 2 show that this population actually declined by a little over 600,000 during this time period. This explains why the number of immigrants unemployed is up “only” 1.3 million even though their job losses are 2.1 million. For the decline in the number of 18- to 65-year-olds to occur, a significant number of immigrants had to leave the country because new immigrants are constantly arriving (legally and illegally), almost all of whom are in the 18- to 65-year-old age group. Most of the decline is among less-educated immigrants. Since illegal immigrants tend to be the least educated, this an indication that the number of illegal immigrants in the country has declined since 2007.
The situation for natives is different. The number of unemployed natives is up 5 million. This is actually larger than the 4.5 million decline in the number of natives holding a job. Moreover, the number of natives (18 to 65) not in the labor force is up 1.2 million. Thus the number of unemployed natives and the number not the labor force has increased substantially. This suggests that young natives aging into the workforce or graduating from college and high school are trying to find work and have been unable to do so. The overall size of the 18- to 65-year-old native-born population actually grew over this period by well over two million people. Perhaps the recession has also prompted natives who might not have looked for a job to try and find work because of a cut in pay or a spouse’s job loss. For these reasons the increase in the number unemployed is larger than the number of job losses among natives.
Other Points of Comparison
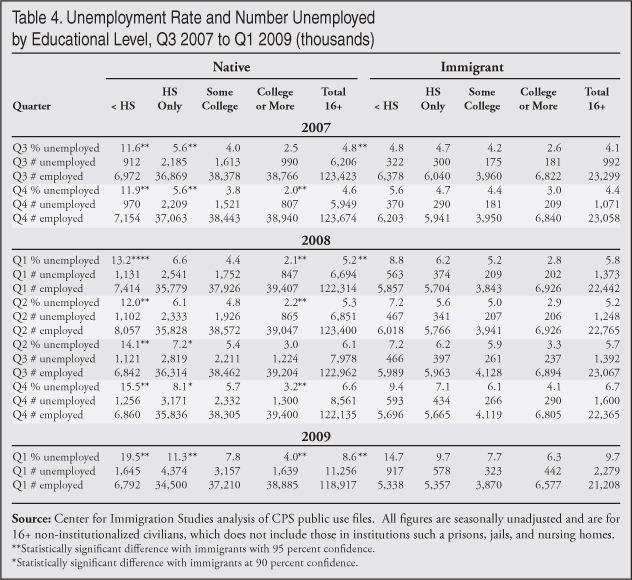
In the above analysis we compared the third quarter of 2007 to the current quarter. If one wishes to compare unemployment rates in other quarters, Table 4 provides employment statistics by educational attainment for every quarter since the third quarter of 2007. Figure 2 is a graphical representation of unemployment rates of immigrants and natives going back to the beginning of 2005.
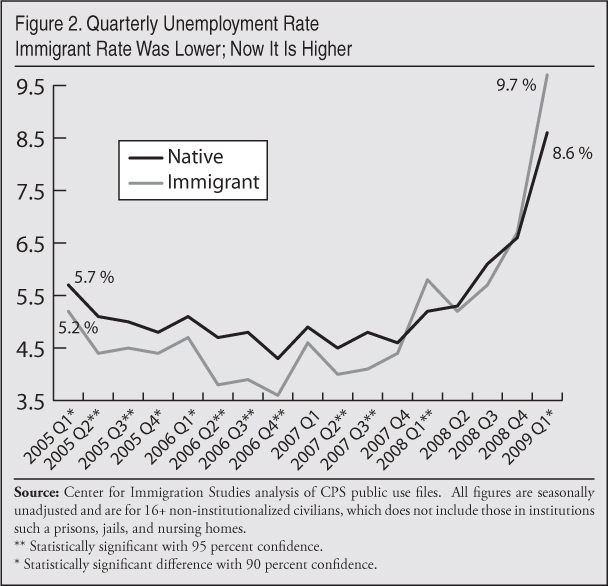
As is well known, unemployment and job losses did not really spike until the latter part of 2008. In general, unemployment in a recession rises first for the least educated and we can see this in Table 4. For immigrants and natives without a high school degree unemployment was up 2.4 and 2.5 percentage points respectively between the third quarter of 2007 and the third quarter of 2008. For other skill categories it was up much less over that time period. Since the third quarter of 2008 however, things have deteriorated across the board for immigrants and natives in every educational category. Again things seem to have been worse for immigrants. The unemployment rate for immigrants overall is up four percentage points since the third quarter of 2008, while the rate for natives is up 2.5 percentage points. In the current quarter there are 1.9 million fewer immigrants working than in the third quarter of 2008 — an 8 percent decline. There are four million fewer natives working — a decline of 3 percent. As the recession developed, immigrants fared worse than natives.
From Lower to Higher Unemployment
Figure 2 reports quarterly unemployment figures for immigrants and natives from the first quarter of 2005 to the first quarter of 2009. It shows that for all of 2005 and 2006 immigrants had lower unemployment than natives. In two quarters in 2007, immigrants also had statistically significant lower unemployment than natives. But once the recession began there was a convergence in unemployment between the two groups. As we have seen, at the end of 2008 and into 2009 unemployment increased dramatically for the foreign-born. The difference in immigrant and native unemployment is now much larger than at any point in the last few years. In fact, it is a reversal of the case just a few years ago, when immigrants had the lower unemployment rate.
Longer-Term Historical Trends
Figure 3 shows quarterly immigrant and native unemployment data going back to January 1994, when the Census Bureau began to identify immigrants in the monthly Current Population Survey. We report statistical significance tests for unemployment rates for every quarter going back to 1994 in Table 5. Figure 3 shows that from 1994, when the government started to collect separate immigrant data, until 2000 natives had statistically significant lower unemployment rates in almost every quarter. This is also the case for most of 2001, 2002, and 2003, but the general trend was toward convergence. By 2004 there was no meaningful difference between the two groups for the entire year. Beginning in 2005 and running through the third quarter of 2007 immigrants had lower unemployment rates in virtually every quarter. Clearly, the historical pattern had reversed, with immigrants now enjoying lower levels of unemployment. As we have seen, since the third quarter of 2007 immigrant and native rates began to converge and immigrants now have the higher rate of unemployment.
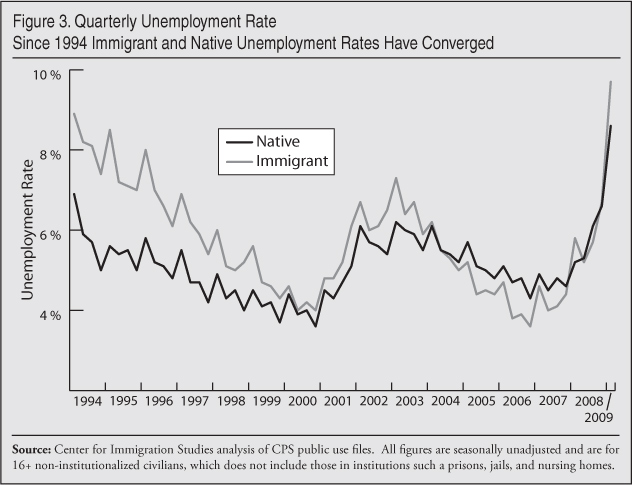
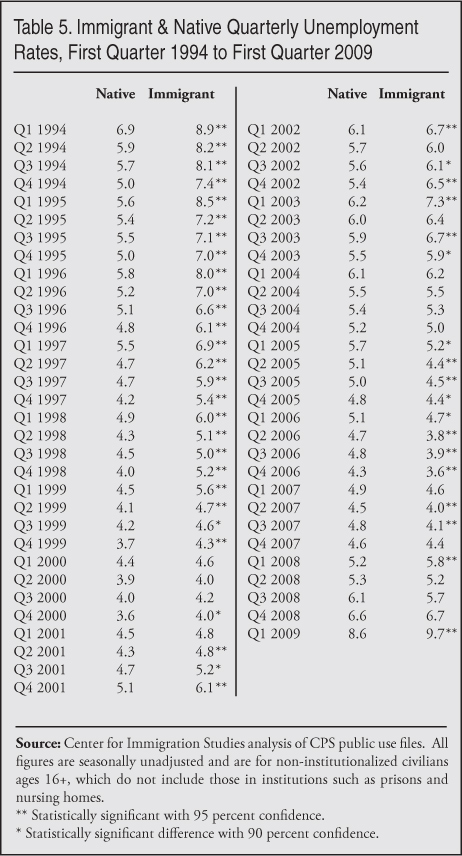
Figure 3 and Table 5 can be used to examine the last recession. That recession is generally thought to have lasted from March 2001 to November 2001.6 If this is correct, the data do not show clear evidence that immigrants were hit much harder by that recession. Natives had lower unemployment in 2001 and the rate for immigrants rose somewhat faster than for natives and this may be evidence the last recession was harder on immigrants. But, by the second quarter of 2002 there was no statistical difference between native and immigrant unemployment. Throughout all of 2001, 2002, and 2003 immigrant unemployment, while often statistically higher than native unemployment, was not that different. The average difference was only 0.6 percentage points. Thus it is hard to argue that immigrants fared significantly worse than natives in the last recession.
Seasonal Changes
The detailed information in Table 5 can be used to see if the current higher rate of unemployment for immigrants in the first quarter of 2009 reflects seasonal variation. In the first quarter of 2008 immigrant unemployment was statistically higher than native unemployment. But in the first quarter of 2007 there was no statistical difference. Moreover, in the first quarters of 2006 and 2005 immigrants actually had statistically lower unemployment. Also, there is no evidence that unemployment rises more rapidly for immigrants between the fourth quarter of one year and the first quarter of the next. Between the third quarter of 2003 and the first quarter of 2004, unemployment rose faster for natives. This was also the case between the third quarter of 2004 and the first quarter of 2005. And between those same quarters for 2005 and 2006 the percentage-point increase was the same for both groups. The current deterioration for immigrants relative to natives does not seem to be part of a pattern in which immigrant unemployment goes up faster than native unemployment each winter.
Unemployment by Year of Entry
Immigrants who arrived from 2006 through the first quarter of 2009 have an unemployment rate of 13.3 percent.7 For those who arrived from 2000 through 2005 it is 10.8 percent. For those who arrived in the 1990s it is 10 percent, and for those who arrived in the 1980s it is 9.2 percent. These numbers imply a decline over time, but statistically the rate for the 1990s is not lower than the rate for the 1980s. So it is not clear the extent to which immigrants make progress over time from this simple comparison. Statistically the 9.2 percent unemployment rate for 1980s immigrants is the same as the 8.6 percent rate for natives. Immigrants in the labor force who arrived in the 1980s have an average age of 44 years compared to 41 for natives in the labor force overall. Unemployment normally declines with age, so 1980s immigrants should have a somewhat lower rate than natives, but this is not the case. On the other hand, we can say that after 19 years of being in the country, the immigrant unemployment rate does match that of natives.
State Comparisons
Table 6 reports the unemployment rates of immigrants and natives in the first quarter of 2007, the third quarter of that year, and in the first quarter of 2009. On the one hand, a comparison with the third quarter of 2007 provides a picture of immigrant and native unemployment by state right before the recession began. On the other hand, looking at the same quarter in 2007 and 2009 has the advantage of controlling for the seasonality in the data. In general, Table 7 shows that where immigrant unemployment is the highest, native unemployment is also very high. And in general where it grew the most among natives it also grew the most among immigrants. As a result, in most states the difference in unemployment is not statistically significant. In California and Maryland, however, immigrants had statistically lower unemployment rates than natives in the third quarter of 2007, but this is no longer the case. Also at the start of 2007 Texas immigrants had a statistically lower unemployment rate. But this is no longer the case.
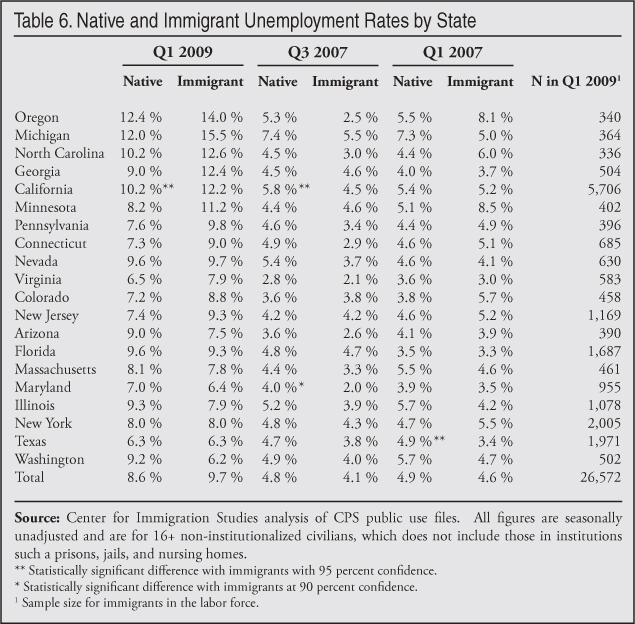
Table 7 reports the number of immigrants and natives unemployed in the first and third quarters of 2007 and the first quarter of 2009. The first column shows the percentage change in the number of employed immigrants from the third quarter of 2007 to the first quarter of 2009. In 12 of the states with the largest immigrant populations shown in Table 7, immigrants had double-digit declines in employment. Interestingly Pennsylvania had double-digit growth. In general, the percentage decline in employment among the foreign-born is larger than among natives. But there are other ways to look at this data. For example, Table 7 shows that job losses for immigrants have been very high in Arizona since the third quarter of 2007. In contrast, the number of natives employed has held steady. However, the number of native-born Arizonans who are unemployed nearly tripled. Thus looking at different employment trends can provide a different perspective on the situation in a state.8
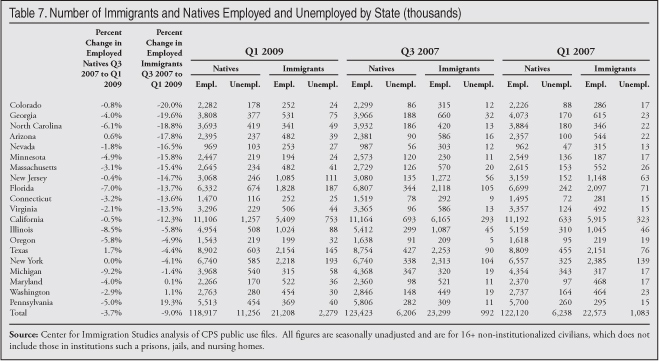
In terms of immigrant job losses, California (36 percent) Florida (14 percent) and New Jersey (9 percent) account for more than half of the decline in employment. These states accounted for 41 percent of immigrant workers in the third quarter of 2007. This is an indication that immigrants in these states were hit harder by the recession than immigrants elsewhere. In contrast, Texas and Illinois, which together accounted for 14 percent of immigrant workers before the recession, accounted for just 8 percent of the decline in immigrant employment. Clearly, immigrant job losses have not been uniform.
Unemployment by Occupation
Table 8 shows unemployment rates by occupation in the first quarter of 2009 and the third quarter of 2007. Table 9 shows the number of immigrants and natives employed and unemployed. Since occupations vary a lot by season, we also include the first quarter of 2007 to compare with the first quarter of this year. It should be noted that the statistics in Tables 8 and 9, including the totals, are only for persons who reported an occupation — a modest number of the unemployed do not give an occupation. Excluding those who do not report an occupation, while creating consistency in the data, lowers the number of unemployed people and as a result the unemployment rate. Employed people in almost every case give an occupation so there is no impact on the totals for the number employed.
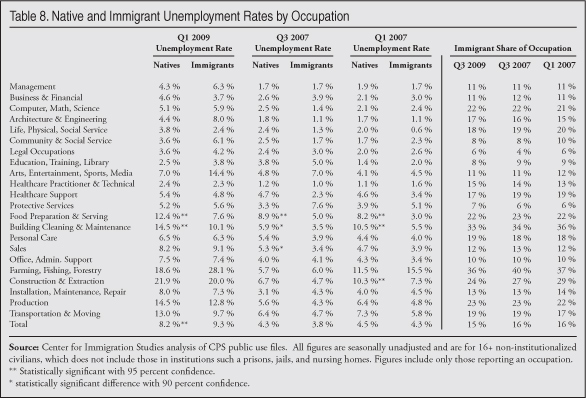
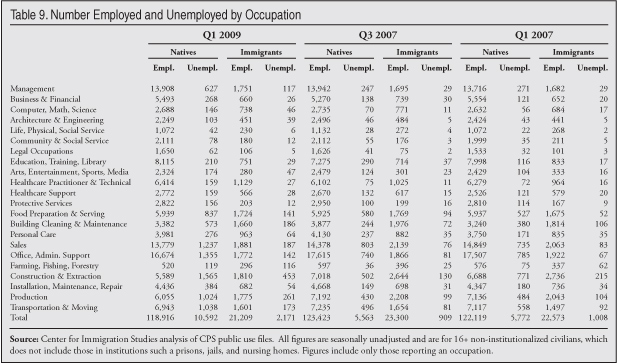
Table 8 shows that in a few occupations immigrants have statistically lower unemployment than natives in the first quarter of 2009. This is the case in all three quarters. Table 9 shows that the numerical increase in unemployment for immigrants between the third quarter of 2007 and the first quarter of this year was 1.262 million for those who gave an occupation. Of this increase, 26 percent was due to a rise in unemployment among immigrant construction workers. Among natives, construction accounted for 21 percent. In production jobs, unemployment accounted for 13 percent of the increase in immigrant unemployment and for natives production jobs accounted for 12 percent of the increase in unemployment. Building cleaning and maintenance accounted for 9 percent of the increase in unemployment for immigrants and 7 percent for natives. Sales accounted for 9 percent of the increase in unemployment for both groups. Transportation and moving was 7 percent of the increase for immigrants and 11 percent for natives. Farming, fishing, and forestry accounted for 7 percent of the increase in the number of unemployed immigrants, but only 2 percent for natives. Office and administrative support accounted for 12 percent of the increase in unemployment for natives but only 5 percent for immigrants. If we use the first quarter of 2007 as our point of comparison, we still get very similar results.
The increase in the number unemployed is only one way to think about these questions. We can also look at the decline in the number of people working. Doing so shows that employment losses at least since the third quarter of 2007 are very concentrated. Many occupations have not seen a decline in the number of people working. For example, in such large occupations as protective services, management, or education the number of workers has either remained the same or actually gone up. Examining the decline in workers shows that among immigrants construction accounted for 40 percent of the decline, but 32 percent for natives. Production jobs accounted for 21 percent of employment losses for immigrants and 25 percent for natives. The only other large area of employment loss for immigrants was in the building cleaning and maintenance category, which accounted for 15 percent of the decline in immigrant employment and 11 percent of the decline for natives.
If we use the first quarter of 2007 as a comparison with the current quarter, we find that construction accounts for a much larger share of employment losses among immigrants. But this is because there were actually job gains for most other categories between the first and third quarters of 2007. This is true for immigrants and natives alike. So if we compare immigrant jobs losses between the first quarter of 2007 and the first quarter of this year, a majority of the decline turns out to be in construction. Seasonality and the way the recession unfolded mean that these results should be interpreted with caution. Nonetheless, it is clear that certain job categories have been hit harder by the recession than others. Moreover, immigrants are concentrated in these occupations such as construction, cleaning, and maintenance; production; and farming. However, these occupations account for a significant share of native employment losses as well. So the difference should not be
exaggerated.
An analysis by occupation does not easily explain why more educated immigrants fared worse in the labor market than more educated natives. Perhaps it is the case that a larger fraction of educated immigrants are employed in occupations that are typically filled by less-educated people.9 Unfamiliarity with a new country, language issues, and other factors can cause immigrants with a college degree to a drive cabs or work in construction or be janitors at higher rates than natives with the same education. Of course immigrants are well represented in life, physical, and social service occupations and health care occupations, which tend to be relatively resistive to recession. Nonetheless, the high concentration of immigrants in occupations like construction is a key part of the reason the employment picture for immigrants has deteriorated more than it has for natives.
Policy Discussion
Legal Immigration
The above statistics paint a very bleak picture for unemployment among immigrants and natives. The unemployment rate was 9.7 percent for immigrants overall and 8.6 percent for natives. At present the United States has not changed its immigration policy in any significant way in response to the recession. Table 10 reports the number of individuals given authorization to work in the United States (temporary and permanent) in fiscal year 2008. The table shows that more than 1.3 million new individuals were authorized to work in the United States in 2008 on a temporary or permanent basis. If we include adult illegal aliens who were given permanent residence (a “green card”) from within the United States, which confers work authorization, we would have to add another 100,000 to 250,000 new individuals to this total. The very high unemployment of immigrants overall, and the rapid increase in unemployment even among educated immigrants, calls into question the wisdom of bringing in so many foreign workers. This is especially true when one considers that the unemployment rate for the most recently arrived immigrants is 13.3 percent.
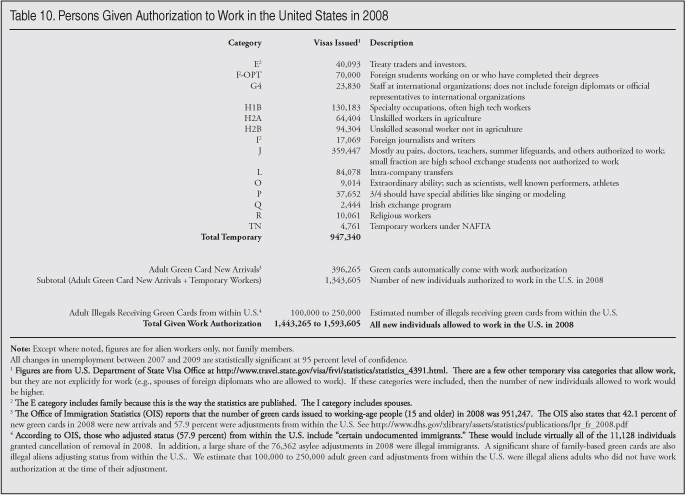
Virtually all of fiscal year 2008 took place during the current recession, which began at the end of 2007, and yet the level of new legal immigration (temporary and permanent) shown in Table 10 for fiscal year 2008 is still very high. All of the primary immigrant-sending countries have seen a significant slowdown in their economies, however, so while it is possible that legal immigration (temporary and permanent) might fall this year, migration to the United States remains attractive. Conditions in the United States often are still better than in the home countries of many potential immigrants.
Illegal Immigration
Table 1 shows 21.2 million immigrants (legal and illegal) holding jobs in the United States. Prior research indicates that about seven million illegal immigrants are included in the monthly Current Population Survey.10 At least 6.5 million illegal immigrants worked outside of agriculture in the first quarter of 2009.11 The overwhelming majority of illegal immigrants have a high school degree or less. As a result, illegals are primarily employed in construction, building cleaning and maintenance, food preparation and service, transportation and moving, and agriculture.12 With the exception of agricultural laborers, the majority of workers in these occupational categories are native-born Americans. As we have seen, these occupations have extremely high unemployment (see Table 8).
Since the job losses and growth in unemployment are concentrated among the least educated immigrants, it is very likely that illegal immigrants account for a large share of this deterioration. But illegal aliens cannot account for a significant increase in unemployment for the most educated immigrants, who are overwhelmingly legal residents. Thus losses by illegal aliens are only one of the reasons for the findings in this report.
If the United States chose to more vigorously enforce immigration laws over the next year and this resulted in one or two million illegal workers deciding to leave, it could significantly improve the employment prospects for less-educated natives. Of course, it is unlikely that there would be perfect symmetry between the number of departing illegals and the number of jobs gained by natives and legal immigrants already here because the economy is complex and there are many factors impacting hiring decisions and job creation. But an economic downturn would seem to be the ideal time to step up enforcement and encourage those in the country illegally to return home. Those thinking about leaving would have both the economy and immigration enforcement to consider. Moreover, a severe recession is when native-born Americans and legal immigrants already here are most in need of jobs. This is especially true of the poorest and least educated workers.
Conclusion
The findings of this report indicate that immigrant and native unemployment has increased substantially. Immigrant unemployment stands at 9.7 percent in the first quarter of this year, the highest level recorded since 1994, when data for immigrants was first collected. The 8.6 unemployment rate for natives is also very high. While immigrants once had lower unemployment than natives, in recent months they have had higher rates. The number of unemployed immigrants increased 130 percent from the third quarter of 2007 to first quarter of 2009. Among natives the increase was 81 percent. If we look at the number of people working, we find that between the third quarter of 2007 and this quarter the number of working immigrants declined 2.1 million, or 9 percent. Among natives the decline was 4.5 million, or 4 percent. These data indicate that immigrants seem to have been hit harder by the recession than native-born Americans. Relative to natives, the least educated and most educated immigrants have seen the largest increases in unemployment.
The very high unemployment of immigrants and natives alike raises the question of whether continuing to admit so many new immigrants make sense. Last year more than 1.3 million new immigrants (temporary and permanent) were given authorization to work in the United States. If we include illegal immigrants adjusting status from within the United States the figure is even larger.
All of the primary immigrant-sending countries have seen a significant deterioration in their economies and migration to the United States remains an attractive option to a significant share of people in those countries. There was intense debate about whether the country needed so many foreign workers even before the recession, especially at the bottom end of the labor market where unemployment has always been high for less-educated natives. Even before the recession began, unemployment was 11.6 percent for natives without a high school diploma and for young natives (18 to 29) with only a high school diploma it was 10.6 percent. The rates are now much higher. Therefore the question remains: Should immigration policy be adjusted to take account of economic reality?
End Notes
1 A recent example of this is a Pew Hispanic Center study of Hispanic immigrants: http://pewhispanic.org/files/reports/102.pdf Also see a recent Urban Institute study of unemployment among older Americans: www.urban.org/UploadedPDF/411846_recessionandolderworkersfactsheetmarch2....
2 All statistical tests were performed using the methodology outlined by the Census Bureau in its source and accuracy statement for the Current Population Survey. They can be found at http://www.bls.census.gov/cps/bsrcacc.htm. For immigrants we use the Hispanic parameter estimates because no parameters are provided for the foreign-born.
3 When looking at the overall employment picture, we follow the example of the Bureau of Labor Statistics and report figures for those 16 and older. When we examine employment by education we look at the18 and older population. We feel this makes sense because we are interested in unemployment for both younger and older people. However, particularly for those with more education, researchers sometimes examine only those 21 and older or 25 and older. For both immigrants and natives with the same education level the population 21 and older has almost exactly the same unemployment rate as the18 and older population. If we use the 25 and older population, among more educated immigrants, their unemployment rate is also very similar to the 18 and older population. Among natives the rates are slightly lower. For example, among natives 25 and older in the first quarter of 2009, the unemployment rate was 7.4 percent for those with some college and 3.8 percent for those with at least a college degree. This compares to 7.8 and 4.0 percent (see Table 1) for these two groups when we examine the 18 and older population. Thus the more educated natives do have slightly lower unemployment when we confine our analysis to only those 25 and older. This in turn makes the gap with immigrants slightly larger. But the differences are still small and by looking at the 18+ population we are able to incorporate unemployment statistics for young workers into our educational analysis.
4 The NBER report can be found at http://wwwdev.nber.org/cycles/dec2008.html. The unemployment statistics are not part of the calculation of a recession. The number of people employed peaked in December of 2007, but the number unemployed started to increase after October, as did the unemployment rate.
5 Some percentages in the report reflect slight rounding error.
6 National Bureau of Economic Research (NBER) states that the recession lasted from March 2001 to November 2001. Although there was controversy over the timing of the recession, NBER has not revised its dates. The Council of Economic Advisors in the Bush administration estimated that the recession began earlier, but NBER is still considered the best arbiter of when a recession begins.
7 The Census Bureau groups data by year of entry in this way to preserve anonymity.
8 Part of the reason for the situation in Arizona is that a significant number of immigrants seem to have left the state. Thus immigrant job losses did not result in a massive increase in immigrant unemployment. Among natives in the state, it seems their unemployment rate and number unemployed went up because new arrivals in the state or those graduating or aging into the labor force have had a very difficult time finding work. But the number working does not seem to have declined.
9 If we look at immigrants in the third quarter of 2007 with at least a college degree we find that 6.9 percent worked in the hard hit occupations of building cleaning and maintenance, farming, fishing and forestry, construction and production occupations. For natives it is 3.4 percent. On the other hand, 12.9 of immigrants with a college degree versus 9.5 percent of natives with a college degree work in the two health care related occupational categories, which generally do well in recession.
10 The Pew Hispanic Center’s newest estimate is that in March 2008 there were 8.3 million illegal immigrant workers, see Figure 4 at http://pewhispanic.org/files/reports/107.pdf. However, that number is for the March file of the Current Population Survey, which includes a supplement that oversamples minorities. The 8.3 million figure also includes a 10 percent undercount adjustment. If we reduced the Pew estimate to reflect the supplement, the 10 percent undercount adjustment, and the decline in the illegal population since March of 2008, we estimate that there are about seven million illegal workers included in the February 2009 CPS.
11 In Unauthorized Migrants: Numbers and Characteristics, the Pew Hispanic Center estimated that 3 percent of illegal immigrants work in agriculture (figure on page 26). In the Center for Immigration Studies report Dropping Out: Immigrant Entry and Native Exit From the Labor Market, we estimated that 4 percent of illegal aliens work in agriculture (Table 10). However, both studies are based on the March Current Population Survey (CPS). Agricultural employment is very low in March, particularly for laborers involved in harvesting, and the CPS is not particularly good at capturing agricultural workers. During the course of the year, more than just 3 or 4 percent of illegal immigrants work in agriculture. Nonetheless the two studies indicate that the vast majority of illegal immigrants do not work in agriculture. The Pew study can be found at http://pewhispanic.org/files/reports/46.pdf and the Center for Immigration Studies report can be found at: http://www.cis.org/sites/cis.org/files/articles/2006/back206.pdf. The Department of Homeland Security estimates can be found at http://www.dhs.gov/xlibrary/assets/statistics/publications/ois_ill_pe_20....
12 The Department of Homeland Security estimates a 10 percent undercount in Census Bureau data. See Table 2 in Estimates of the Unauthorized Immigrant Population Residing in the United States: January 2007 which can be found at http://www.dhs.gov/xlibrary/assets/statistics/publications/ois_ill_pe_20.... For the number of illegal workers in the Current Population Survey see Table 21 in Immigrants in the United States 2007: A Profile of America’s Foreign-born Population at http://www.cis.org/immigrants_profile_2007. The report also estimates the education level of illegal immigrants (page 31) with 81 percent having a high school education or less. For a distribution of illegal immigrants across occupations see Table 10 in the Center for Immigration Studies publication, Dropping Out: Immigrant Entry and Native Exit From the Labor Market. The Pew Hispanic Center also has estimated the education level and occupational distribution of illegals, with similar results to the Center for Immigration Studies. See The Size and Characteristics of the Unauthorized Migrant Population in the U.S. at http://pewhispanic.org/files/reports/61.pdf and Unauthorized Migrants: Numbers and Characteristics at http://pewhispanic.org/files/reports/46.pdf.