Download a PDF of this Backgrounder
Steven A. Camarota is the director of research and Karen Zeigler a demographer at the Center for Immigration Studies.
Last week, the Census Bureau released some data from the 2014 American Community Survey (ACS). It shows that the nation's immigrant population (legal and illegal) grew by 2.4 million people since 2010 and is up one million from 2013 to 2014. Last month, the Center for Immigration Studies reported on monthly Census Bureau data from the Current Population Survey, which also showed a substantial increase in immigrants.1 The CPS is released on a timelier basis, but is a smaller survey that does not cover the immigrant population as completely as the ACS. The new data from the ACS allows for more detailed analysis by country of origin and state of residence. Both data sources show that growth in the immigrant population has rebounded after increasing more slowly from 2010 to 2013 following the Great Recession.
Among the findings in the new data:
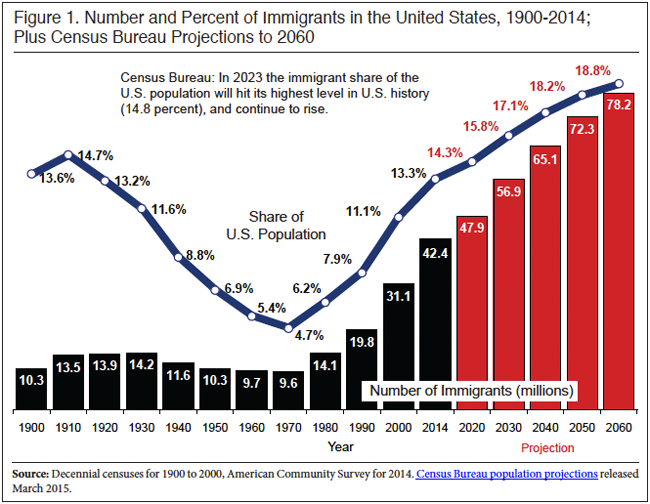
- The nation's immigrant population (legal and illegal) hit a record 42.4 million in July 2014, an increase of 2.4 million since July 2010. The Census Bureau refers to all immigrants as foreign-born.
- The new data indicates that growth in the immigrant population is accelerating. Between 2010 and 2012, growth averaged 430,000 people a year, but between 2012 and 2013 the immigrant population grew by 520,000; it grew by 1.04 million from 2013 to 2014.
- As a share of the population, immigrants (legal and illegal) comprised 13.3 percent or about one out of eight U.S. residents in 2014, the highest percentage in 104 years. As recently as 1980, just 6.2 percent of the country was comprised of immigrants.
- In addition to immigrants, there were 16.2 million U.S.-born minor (<18) children with at least one immigrant parent in 2014, for a total of 58.6 million immigrants and their children.2 Immigrants and their minor children now account for more than one in six U.S. residents.
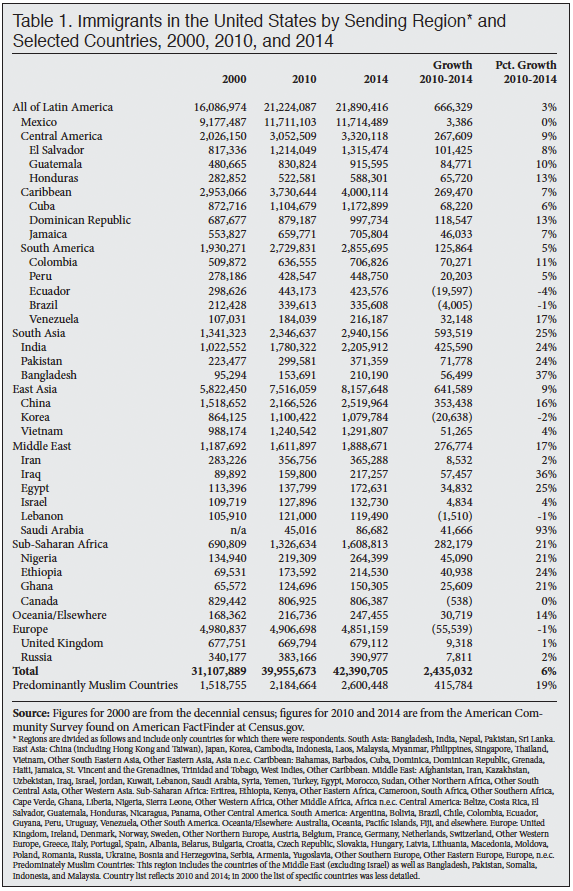
- The sending regions with the largest numerical increases in the number of immigrants living in the United States since 2010 were East Asia (up 642,000), South Asia (up 594,000), Sub-Saharan Africa (up 282,000), the Middle East (up 277,000), the Caribbean (up 269,000), and Central America (up 268,000).
- The sending countries with the largest numerical increases in the number of immigrants living in the United States since 2010 were India (up 426,000), China (up 353,000), the Dominican Republic (up 119,000), El Salvador (up 101,000), Guatemala (up 85,000), Pakistan (up 72,000), Colombia (up 70,000), Cuba (up 68,000), Honduras (up 66,000), Iraq (up 57,000), and Bangladesh (up 56,000).
- The sending countries with the largest percentage increases in the number of immigrants living in the United States since 2010 were Saudi Arabia (up 93 percent); Bangladesh (up 37 percent); Iraq (up 36 percent); Egypt (up 25 percent); Pakistan, India, and Ethiopia (all up 24 percent); Nigeria and Ghana (both up 21 percent); Venezuela (up 17 percent); and China (up 16 percent).
- Between 2010 and 2014, 5.2 million new immigrants settled in the United States. Since the Great Recession began in 2007, at least 8.7 million new immigrants have settled in the country.3 New arrivals are offset by those who return to their home countries each year and by mortality. As a result, growth in the immigrant population is less than the number who enter.
- Mexico had by far the largest immigrant population in the country, with 11.7 million legal and illegal Mexican immigrants living in the United States in 2014. After declining from 2010 to 2013, the number of Mexican immigrants in the United States grew by 130,000 from 2013 to 2014.
- In contrast to most sending regions and countries, the number of immigrants from Europe and Canada declined slightly between 2010 and 2014.
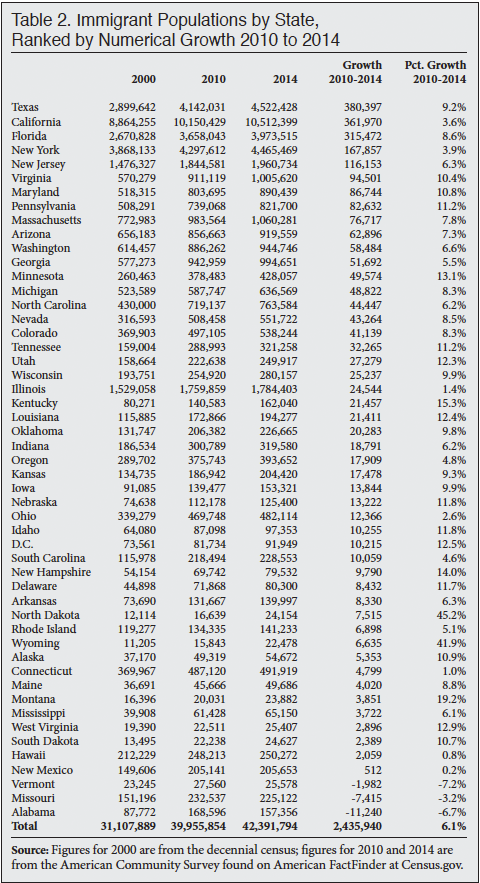
- The states with the largest numerical increases in the number of immigrants from 2010 to 2014 were Texas (up 380,000), California (up 362,000), Florida (up 315,000), New York (up 168,000), New Jersey (up 116,000), Virginia (up 95,000), Maryland (up 87,000), Pennsylvania (up 83,000), Massachusetts (up 77,000), Arizona (up 63,000), Washington (up 59,000), Georgia (up 52,000), and Minnesota (up 50,000).
- The states with the largest percentage increases in the number of immigrants 2010 to 2014 were North Dakota (up 45 percent); Wyoming (up 42 percent); Montana (up 19 percent); Kentucky (up 15 percent); New Hampshire (up 14 percent); Minnesota (up 13 percent); West Virginia (up 13 percent); Louisiana, Utah, Nebraska, Idaho, and Delaware (all up 12 percent); and Pennsylvania (up 11 percent).
Data Source. On September 17, 2015, the Census Bureau released some of the data from the 2014 American Community Survey (ACS). The survey reflects the U.S. population as of July 1, 2014. The ACS is by far the largest survey taken by the federal government each year and includes over two million households.4 The Census Bureau has posted some of the results from the ACS to its American FactFinder website.5 It has not released the public-use version of the ACS for researchers to download and analyze. However, a good deal of information can be found at FactFinder. Unless otherwise indicated, the information in this analysis comes directly from FactFinder.
The immigrant population, referred to as the foreign-born by the Census Bureau, is comprised of those individuals who were not U.S. citizens at birth. It includes naturalized citizens, legal permanent residents (green card holders), temporary workers, and foreign students. It does not include those born to immigrants in the United States, including to illegal immigrant parents, or those born in outlying U.S. territories, such as Puerto Rico. Prior research by the Department of Homeland Security and others indicates that some 90 percent of illegal immigrants respond to the ACS.6 Thus all the figures reported above are for both legal and illegal immigrants.

End Notes
1 See Steven A. Camarota and Karen Zeigler, "Immigrant Population Hits Record 42.1 Million in Second Quarter of 2015", Center for Immigration Studies, August 2015. The monthly data on which our August analysis was based shows a foreign population of 42.1 million in the second quarter of 2015. The ACS data is released more slowly by the Census Bureau and the 42.4 million figure is for July 2014. In recent years, the monthly CPS has shown an immigrant population in the second quarter of each year that is about 5 percent less than what the ACS shows for the same year. If this pattern holds, the 2015 ACS will show at least 44 million immigrants in the country as of July 2015.
2 The figure for immigrants is from the 2014 ACS. The figure for children is from the public-use file of the 2014 Current Population Survey Annual Social and Economic Supplement (CPS ASEC) and includes those under age 18 born in the United States with either a mother or father born outside of the United States. The ACS does not include a question about parents' birthplaces, but the CPS ASEC does ask all respondents about their parents' places of birth.
3 The 2014 ACS shows 5.2 million immigrants living in the United States in July 2014 who indicated that they arrived in the United States in 2010 or later. (Unlike the public-use data, FactFinder does not report immigrants' detailed year of arrival; instead, results are grouped by decade.) The 2010 public-use file of the ACS showed 3.5 million immigrants in the country who arrived in 2007, 2008, or 2009. (We exclude those who indicated they came between January and July 2010.) Therefore, in total 8.7 million immigrants arrived from 2007 to 2013. The actual total is higher because the 8.7 million figure does not include those who arrived after 2007, but died or went home by 2013.
4 Detailed information on the American Community Survey methodology, questions, and other topics on the can be found here.
5 Much of the data for the foreign-born used in this analysis can be found on FactFinder.
6 The Department of Homeland Security uses the ACS as the basis for its estimates of illegal immigrants. See its most recent estimate of the unauthorized immigrant population: "Estimates of the Unauthorized Immigrant Population Residing in the United States: January 2012".