Download a copy of this Backgrounder
Steven A. Camarota is the Director of Research at the Center for Immigration Studies.

The number of working-age (16 to 65) native-born Americans who are not working — unemployed or out of the labor market — stood at 57.5 million in the second quarter of 2013, a figure that has barely budged in the last three years. Partly on the grounds that there are not enough workers in the United States, the Gang of Eight Immigration bill (S.744) that recently passed the Senate would double future legal immigration. Yet the more than 57 million working-age natives not working is 17 million larger than in the second quarter of 2000. The large increases in future legal immigration in S.744 seem out touch with the realities of the U.S. labor market.
Among the findings:
- The total number of native-born Americans of working-age not working has barely budged in the last three years. The more than 57 million natives not working is 10 million larger than in the second quarter of 2007 and 17 million larger than in the same quarter of 2000.
- Even excluding younger teens aged 16 and 17, the total number of adult natives (18 to 65) not working in the second quarter of this year was 50.6 million.
- The number of adult natives not working is spread throughout the labor market, including 25 million with no more than a high school education, 16 million with some education beyond high school, and nine million with at least a bachelor's degree.
- The increase in the share and number of working-age natives not working is a long-term trend and began well before the current economic downturn.
- Turning to the broad measure of unemployment, referred to as U-6 unemployment, also shows an enormous supply of potential workers. The U-6 measure includes those forced to work part-time and those who want to work, but have not looked recently.
- U-6 unemployment stood at 13.7 percent for natives in the second quarter of 2013 compared to 8 percent in the second quarter of 2007 and 6.8 percent in the second quarter of 2000.
- The number of native-born Americans who are U-6 unemployed in the second quarter of this year was 18.2 million. Adding U-6 unemployed immigrants raises the total to nearly 22 million.
- Supporters of the large increases in legal immigration in S.744 argued that the aging of American society means there are not enough workers to support government or the economy. This argument ignores the enormous increase in the number of working-age Americans not working.
- Drawing the existing population of natives and legal immigrants currently not employed into jobs would have a far more positive impact on improving the ratio of workers to non-workers.
- Immigrants arrive at all ages and many do not work. Therefore it is not surprising that immigration adds to both the working population and those who are non-working. Of the more than five million immigrants who arrived in the country in the last five years only 48 percent had a job in 2013. For recent immigrants who are working age (16 to 65), 59 percent held a job.
- In contrast, moving the existing population of natives and legal immigrants not working into jobs would directly and immediately improve the ratio of workers to non-workers.
Data and Methods
The two primary employment surveys collected by the United States government are referred to as the "household survey" (also called The Current Population Survey or CPS) and the "establishment survey". The establishment survey asks employers about the numbers of workers they have. In contrast, the CPS asks people at their place of residence if they are working. While the two surveys show the same general trends, the figures from the two surveys do differ to some extent.
Because it asks actual workers about their employment situation, only the CPS provides information about who is working, who is looking for work, and who is not working or looking for work. Moreover, only the CPS asks respondents about their socio-demographic characteristics such as their education, age, citizenship, and year of arrival in the United States. Thus, only the CPS can be used to compare employment growth among immigrants and the native-born. For these reasons this analysis uses the public-use files of the CPS to examine employment in the United States by quarter. (For each quarter the three CPS surveys combined include roughly 355,000 natives and 44,000 immigrants. The survey is then weighted to reflect the actual size of the U.S. population.)
The data for the tables and figures in this report come from the public-use files of the April, May, and June 2000, 2007, and 2013 Current Population Surveys, which are collected monthly by the Census Bureau for the Bureau of Labor Statistics (BLS). Only Table 7 has data for the second quarter from 2000 to the present.
Each individual CPS includes about 131,000 respondents, roughly half of whom are in the labor force. The tables presented here are reported by quarter. Quarterly data are more statistically robust, especially for smaller populations like immigrants and minorities, due to the inclusion of three months of data. Persons in institutions like prisons or nursing homes are not included in the CPS. The CPS is the nation's primary source for unemployment and other labor force statistics. Like all government surveys, the data are weighted to reflect the actual size and demographic makeup of the U.S. population.
The government publishes employment statistics that are both seasonally adjusted and unadjusted from the survey. The figures in this analysis are seasonally unadjusted. Unadjusted figures are computationally simpler and easier for other researchers to replicate. In general, BLS does not provide separate estimates for the foreign-born (immigrants) and the U.S.-born broken down by characteristics like education, race, and age. However, all CPS respondents are asked these questions. The Census Bureau defines the foreign-born as persons who are not U.S. citizens at birth, which includes naturalized citizens, legal immigrants who are not citizens (green card holders), temporary visitors and workers, and illegal immigrants. All figures for the total U.S. population (ages 16-plus) at the top of Tables 2 and 4 match seasonally unadjusted figures from the BLS.
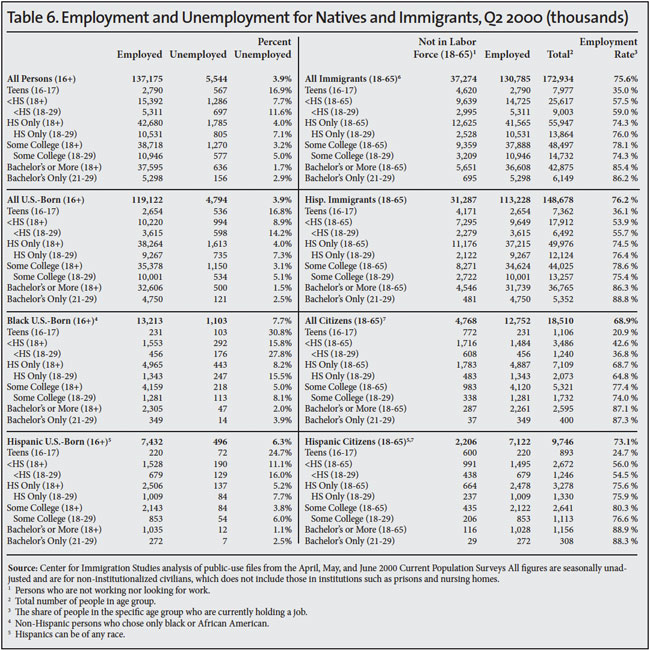
Defining Unemployment. The standard measure of unemployment, referred to as U-3, takes the number of people who report that they are not working and have looked for a job in the last four weeks and divides it by the number actually working plus those looking for work. The left sides of Tables 2, 4, and 6 report U-3 unemployment for natives and immigrants by education and age for the second quarter of 2013, 2007, and 2000. The right sides of Tables 2, 4, and 6 report the share of each group working and not working. We focus on 2007 and 2000 because they represent the peaks years of the last two economic expansions.
Those not actively looking for a job are not included in either the numerator or denominator when calculating the standard unemployment rate for U-3. The broader measure of unemployment, referred to as U-6, is calculated differently. It divides the sum of the unemployed population, involuntary part-time workers, and marginally attached people (discouraged and other) by the civilian labor force (employed and unemployed) plus marginally attached workers. The column headings in Tables 1, 3, and 5 show this calculation for the second quarter of 2000, 2007, and 2013; the last column in the tables reports the U-6 unemployment rate. The following individuals are included in U-6 unemployed: 1) Those who do not currently hold a job, but are available to work and have looked for a job in the previous four weeks — standard U-3 unemployed; 2) marginally attached workers who indicate that they want and are available for jobs, and they have looked for work in the past 12 months, but not in the last four weeks; and 3) involuntary part-time workers who report that they are working part-time for economic reasons. They want and are available for full-time work, but must instead settle for part-time hours. Because the total U-6 measure includes the U-3 unemployed, those working involuntarily part-time, and those marginally attached to the labor market (discouraged and other), it provides a broad measure of problems in the U.S. work force.