Related Publications: Video, Transcript
This study uses Census Bureau data to project how different levels of immigration impact population size and the aging of American society. The findings show that the current level of net immigration (1.25 million a year) will add 105 million to the nation’s population by 2060. While immigration makes the population larger, it has a small effect on the aging of society.
Among the findings:
-
Currently, 1.6 million legal and illegal immigrants settle in the country each year; 350,000 immigrants leave each year, resulting in net immigration of 1.25 million.
-
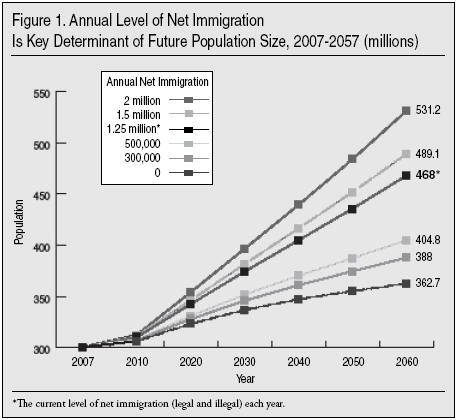
If immigration continues at current levels, the nation’s population will increase from 301 million today to 468 million in 2060 — a 167 million (56 percent) increase. Immigrants plus their descendents will account for 105 million (63 percent) of the increase.
-
The total projected growth of 167 million is equal to the combined populations of Great Britain, France, and Spain. The 105 million from immigration by itself is equal to 13 additional New York Cities.
-
If the annual level of net immigration was reduced to 300,000, future immigration would add 25 million people to the population by 2060, 80 million fewer than the current level of immigration would add.
-
The above projection follows exactly the Census Bureau’s assumptions about future birth and death rates, including a decline in the birth rate for Hispanics, who comprise the largest share of immigrants.
-
Net immigration has been increasing for five decades; if immigration continues to increase, it will add more than the projected 105 million by 2060 that will be added if immigration levels stay the same.
-
While immigration has a very large impact on the size of the nation’s population, it has only a small effect on slowing the aging of American society.
-
At the current level of net immigration (1.25 million a year), 61 percent of the nation’s population will be of working age (15-66) in 2060, compared to 60 percent if net immigration were reduced to 300,000 a year.
-
If net immigration was doubled to 2.5 million a year it would raise the working-age share of the population by one additional percentage point, to 62 percent, by 2060. But at that level of immigration,
the U.S. population would reach 573 million, double its size in the 2000 Census.
The nation’s ongoing debate over immigration generally has not focused on the effect it has on U.S. population size. Yet, increasing the nation’s total population is one of immigration’s clearest and most direct effects. Supporters of low immigration point to the congestion, sprawl, traffic, pollution, loss of open spaces, and greenhouse gas emissions that could be impacted by population growth. Supporters of high immigration argue that population growth may create more opportunities for businesses, workers, and consumers. Whatever one thinks of population growth, the projected 167 million growth in the nation’s population in the next 53 years is very large. It is larger than the entire U.S. population in 1950, and it is more than the combined total populations of California, Texas, New York, Florida, Illinois, Pennsylvania, Ohio, Michigan, Georgia, and New Jersey. Even the impact of immigration by itself is enormous. The 105 million immigration will add to the population by 2060 is more than all of the population growth that occurred in the United States in the first 130 years of the nation’s history after independence. Our findings are consistent with projections done by the U.S. Census Bureau and others. Since we have used Bureau projections of death and birth rates by race and simply varied the immigration component, this is to be expected. The Methodology Appendix at the end of the report explains in detail how the projections were created. We provide many alternative levels of immigration, leaving the reader free to judge how different immigration levels impact population size and the age structure. This report makes clear that immigration has a very large impact on the nation’s population. The question is not whether immigration levels are a key determinant of population increase — they are. The question is what costs and benefits will the increase bring. How we answer these questions will to a significant extent determine which immigration policy we pursue.
Research Purpose
The goal of this study is to see how immigration by itself impacts the nation’s total population size, as well as its age structure. The distinguishing feature of this report is that it uses the Census Bureau’s assumptions about births and deaths from its most recent projections and then varies the immigration component. When the Census Bureau released its projection in March of 2004 it incorporated only one immigration scenario into the projection, so immigration’s impact was unclear. Moreover, the 2004 projections, like those done in January of 2000 by the Bureau, assume that immigration levels will vary significantly over time.1 While these older projections have value, they make it very difficult for policy makers to evaluate the impact of immigration policy. If, for example, elected officials would like to know how 200,000 immigrants a year versus two million immigrants a year might affect population size over, say, a 20-, 40-, or 60-year time period, there are currently no projections that provide that information. Also there are no projections showing how different levels of immigration impact the share of workers in the population. Our primary goal is to provide this information for policy makers and the public.
It is our hope that this study is only the first in a series of projections the Center for Immigration Studies will undertake. In later projections we hope to build on this work and correct some of the problems we find in the Census Bureau’s assumptions. The purpose of this study is to match the Census Bureau’s assumptions as closely as possible and then vary the immigration component.2
Impact on Population Size
Table 1 reports our overall findings. The first column shows the number of new immigrants who would arrive under each immigration scenario. The second column shows the level of net immigration for each immigration level. The two columns under each year after 2007 report the nation’s total population and the number of people added to the nation’s total population by immigration alone under each scenario. So, for example, the table shows that 1.28 million new immigrants a year would result in net immigration of one million. This level of net immigration would result in a total population of 338.8 million in 2020, 366.8 million in 2030, and so on. Net immigration of one million a year would also mean that the nation’s total population would be 15.4 million larger in 2020, 29.8 million larger in 2030, and 84.2 million larger in 2060 than it would have been had immigration been zero. Because it assumes a constant rate of immigration, the projections in Table 1 are linear, so the impact of 500,000 immigrants is half the impact of one million immigrants, and two million immigrants have twice the effect as one million. To find the impact of different levels of immigration, simply pick the level of net immigration you wish to study and look across the table to see its effect on population size by year. If you think the level of future net immigration will be higher or lower than the current level of 1.25 million, the table provides 27 alternative projections.
Figure 1 is a graphical representation of Table 1. Table 2 provides information about the impact of immigration on population size by number of years rather than calendar year. Thus, in Table 2 the values under the 10-year column are the additions to the U.S. population that will occur by 2017, those for 20 years are for 2027 and so on. For some readings, Table 2 may be an easier way to think about immigration and population projections. Table 3 reports the total number of immigrants (legal and illegal) who would arrive between now and 2060 and the impact on population size under different immigration scenarios. Table 4 reports population projections assuming some or all of the illegal immigrants in the country leave.
Immigration Is a Determinant Factor in Population Growth. Table 1 shows that the level of immigration has a very significant impact on the future size of the U.S. population. At present, the level of legal and illegal immigration is 1.6 million new arrivals (1.25 million net). For those wishing a detailed explanation on how we calculated the level of net immigration, it can be found in the Methodology Appendix at the end of this report. If the current level were to continue, it would add 105.3 million to the population by 2060. Or, put a different way, the United States is on track to allow a total of 85 million immigrants (66 million net) into the country by 2060, and as a result the population will be 105 million larger than it would be otherwise. Table 1 also shows that the population will grow by a total of 167 million. This means that immigration will account for 63 percent of total population growth between now and 2060. It also means that without any future immigration the population would grow by 61.8 million.
Unlike almost all other industrialized countries, the United States’ population is growing rapidly. The 167.1 million that the nation’s population will grow in the next 53 years is equal to the entire populations of France, Britain, and Spain combined. And it is larger than the entire U.S. population in 1950. The impact of immigration by itself is enormous. The 105 million people immigration will add is larger than the entire U.S. population in 1920, or 13 New York Cities. It is very important to understand that the extra 105.3 million is from immigrants who have yet to come but who will come, if the current level continues, plus their descendents. Of course the table only shows what will happen if the current level of immigration continues. If the level of immigration was changed, it would have a large impact on future population size. Since it is unlikely that net immigration would ever be zero, it may make more sense to compare the current level with an alternative net immigration level of 300,000 per year. Table 1 shows that if net immigration was 300,000 a year the nation’s population would be 388 million in 2060, or 80 million fewer than the 468 million it would be if the current level continues.
Immigration’s Impact Increases Over Time. Table 1 shows that immigration accounts for a larger share of population growth as we move further along in the projections. This can be seen graphically by looking at Figure 1. The line at the bottom of the figure shows the effect of zero immigration. Under a zero-immigration scenario, population growth is much slower, especially after about 2030. But with the current level of immigration (the third line from the top in the figure) the population growth remains significant through 2060. If net immigration continues at 1.25 million, the population would grow 10 percent in the teens, 9 percent in the 2020s, and 7 to 8 percent thereafter. If net immigration was zero, the population would grow 6 percent in the teens, 4 percent in the 2020s, and by about 2 percent per decade thereafter.
These projections tell us two things: First, with no immigration the population would still increase significantly, but by much less. Second, the impact of immigration grows over time. The main reason for this is that native-born Americans have only about two children on average, the number needed to stabilize the population. With good reason, the Census Bureau assumes that fertility rates will fall over time for Hispanics, the largest immigration group. (Our model follows the Census Bureau assumptions.) Thus the U.S. population would slowly stabilize in size over time if there were no more immigration. Of course, even though the effect of immigration grows over time, in the short term immigration’s effect still is significant. If the current level continues, future immigration will account for 46 percent of population growth between now and 2020.
Cumulative Effect of Immigration. Table 3 shows how many immigrants in total would come to America between now and 2060 under different levels of immigration. The current level would, as we have seen, add 105 million to the population by 2060 if it continues, a very significant effect on population size. The extra people include original immigrants and their descendents. Table 3 shows that even if we exclude descendents, the effect is so large partly because of the cumulative effect of immigration. If 1.6 million come over the next 53 years, it would mean 85 million new arrivals by 2060, more than twice the total size of the current immigrant population (legal and illegal). Turning to net immigration, if the current level continues, the total number who would come and stay in the country would be more than 66 million by 2060. Table 3 shows that the effects of immigration add up not just because the immigrants have children.
Recent Immigration and Current Population Growth. It is worth noting that recent immigration accounts for a large share of current population growth because a large share of births each year are to immigrants. The Census Bureau’s best estimates are that the U.S. population is currently growing by about three million people annually. There are about 4.2 million births in the United States each year and 2.4 million deaths. This means that 1.8 million, or the majority of population growth, is from "natural increase," the rest is net immigration. However, this kind of analysis is somewhat misleading because, according to National Center for Health Statistics data, some 950,000 births a year are to immigrant or foreign-born women.3 Almost all of these women have arrived in the last three decades. In fact, my own research indicates that 10 percent of all births in the country and 42 percent of all births to immigrants are to illegal immigrant mothers.4 Thus, births to all immigrants plus net immigration equals about three-fourths of U.S. population growth. The impact of recent immigration on current population growth can be seen as even larger if one uses the current level of new immigration (1.6 million) and adds it to births. New arrivals plus births to immigrants equals 2.4 million, or more than 80 percent of annual population growth. While natural increase technically does account for most U.S. population growth, it may be more accurate to say that immigration and births to immigrants account for most of current growth in the U.S. population.
These Results Match Census Bureau’s. Our overall results match very closely those of the Census Bureau. Its March 2004 projections, which assume net immigration of about one million a year (with variation over time), show a total U.S. population of 419.9 million in 2050.5 This is almost exactly the same as the 419.6 million we show in 2050 (Table 1) if net immigration was held constant at one million. But what the Bureau’s March 2004 projections do not provide is any alternative projections showing population size if the level of immigration was different. Thus, policy makers and the public are unable to make any judgments about immigration policy based on its impact on future population growth. The other advantage of our projections is that we use a net immigration level of 1.25 million, which reflects the actual level of current immigration based on the most up-to-date data. The immigration assumptions in the Census Bureau’s March 2004 projections are based on data collected in the 1990s prior to the 2000 Census. One final advantage of our new projections is that we provide estimates through to 2060; the Census Bureau’s March 2004 projection goes only to 2050.
Legal vs. Illegal Immigration. The above projections treat legal and illegal immigration together. But it is possible to think about them separately. At present, net illegal immigration is about 450,000 a year and net legal immigration is about 800,000 a year.6 Table 1 can provide a rough idea of the separate impact of legal and illegal immigration by looking at the appropriate level of immigration. As already indicated, the relationship between immigration levels and population growth is linear, so if one wishes to know the separate effect of net illegal immigration of 450,000, then this would be the value at the mid-point between net immigration of 400,000 and 500,000 a year. So for example, assuming net illegal immigration continues at 450,000 a year, Table 1 indicates that it would add 13.4 million to the population by 2030 and 37.9 million by 2060. For legal immigration, one can use the net figure of 800,000 found in the table. Legal immigration of 800,000 a year will add 23.9 and 67.4 million to the population by 2030 and 2060, respectively. Of course, the racial composition of legal and illegal immigration differs somewhat and this matters because birth and death rates vary by race. Thus, dividing up legal and illegal immigration in this way can provide only a rough indication of the impact of the two types of immigration.
There is of course the question of illegal immigrants already in the country. Table 4 provides projections of population size assuming illegal immigrants leave the country, but the U.S.-born children they have already given birth to remain. The top portion of Table 4 is drawn directly from Table 1, the middle portion of Table 4 assumes that half of illegal immigrants leave the country and the bottom of the table assumes that all illegal immigrants leave the country. Based on prior research, we estimate that 11 million illegal immigrants were included in the 2007 population estimates that are the baseline for our projections.7 To see the full impact of illegal immigrants already here one can compare the zero net immigration figures at the top of the Table 4 with the zero net immigration figures assuming all illegal immigrants leave the country. The top of Table 4 shows that if future immigration was zero, and all illegals remained, the total population would be 362.7 million in 2060. (This is the same value shown at the top of Table 1.) If immigration was zero and all illegal immigrants left, the total population would be 340.9 million in 2060. This means that allowing illegal immigrants to stay in the country would add 21.8 million people to the population by 2060. Or put a different way, about one-third of the 61.8 million population increase that would occur without any future immigration is due to illegal immigrants already in the country plus their descendents. Again we assume the children already born to illegal immigrants would remain in the country.8
Impact on Aging of Society
This section of the report examines the impact of immigration levels on the age structure of American society. Because of gains in life expectancy coupled with the decline in fertility, American, like all modern societies, is growing older. Many observers worry that there will not be enough workers to support the government and economy in the future. It is often suggested that immigration can offset the aging of America society by adding young workers. When studying this issue, demographers often examine the share of the population that is of working age relative to the share of the population that is too young or too old to work. This is referred to as the "dependence ratio." It is calculated by taking the number of people not of working age and dividing it into the number who are of working age. This can be a little confusing to non-demographers, so instead in this report we report the percentage of the population that is of working age. We also examine the ratio of workers relative to retirees, leaving out children too young to work. Tables 5, 6, 7, and 8 and Figure 2 examine the impact of different immigration levels on the aging of society.
Impact on the Working-Age Share. Table 5 reports the percentage of the population that is of working age, assuming different levels of immigration, with the working-age defined as either those 15-64 or 15-66 years of age. Eligibility for full Social Security benefits is set to rise to 67 years of age, so it may make more sense to use 15 to 66 as the working age population in the later years of the projection. Thus, we provide the working-age share of the population assuming 15-64 and 15-66 as the working-age population. Figure 2 graphically represents some of the information in Table 4. Table 5 and Figure 2 show that immigration has a positive effect on the share of the population that is of working age, but the effect is small. If there was no immigration between now and 2060, 59.2 percent of the population would be of working age, using 15-66 as the working age population. This represents a 9.6-percentage-point decline from the current level of 68.8 percent. At the current level of net immigration (1.25 million) a year, 60.7 percent of the nation’s population will of working age, a 8.1 percentage point decline from the current level. Thus 85 percent (8.1 ÷ 9.6) of the decline in the working-age share would take place even with the current level of immigration.
Since it is unlikely that net immigration would ever be zero, it makes more sense to compare immigration of 300,000 a year as a baseline. If net immigration was 300,000, the working-age share (15-66) of the population would be 59.6 percent in 2060. Thus, Table 5 shows that the difference between net immigration of 300,000 versus 1.25 million is about one percentage point. It is worth noting that, as Table 1 showed, net immigration of 1.25 million would add 80 million more people to the population by 2060 than would 300,000 a year. Yet it changes the working-age share by roughly one percentage point. Table 1 also shows that if legal and illegal immigration were doubled to 2.5 million net immigrants a year it would raise the working-age share of the population by one additional percentage point, to 61.6 percent. This level of immigration would add 211 million people to the population, creating a total population of 573 million people in 2060, or double the population in the 2000 Census. Even so, if the working-age share is 61.6 percent, 74 percent of the decline in the working-age share that would have taken place will still occur.
Table 5 shows that even impractically high levels of immigration still do not stop the aging of society. Net immigration of 10 million a year (12.8 million new entries) would result in a total U.S. population of 1.2 billion in 2060, but the working age share would still be 63.9 percent, which means that immigration would prevent only about half the decline in the working age share from taking place.
It must be remembered that as more immigrants are added to the country in the early years of the projection it makes it more difficult to change the age structure in the latter years of the projection. This is because most of the immigrants who enter in the next 20 years will have retired by 2060. Thus there are diminishing returns to the positive effect of immigration on the aging of society. This can be seen most clearly by comparing the effect of each additional million immigrants. Net immigration of one million improves the working-age share by 1.3 percentage points in 2060 compared to zero net immigration, but net immigration of two million changes the working-age share by just .9 percentage points compared to one million, and net immigration of three million improves the working-age share by .6 percentage points compared to two million. Mathematically, it’s very hard for immigration to have a large impact on the working-age share of the population because the U.S. population is already so large.
The Impact of the Retirement Age. Table 6 shows that changes to the retirement age tend to have a larger impact on the problem of a declining working-age population than does the level of immigration. The change in the retirement age from 65 to 68 increases the working-age share from 57.2 to 60.2 percent in 2060 — three percentage points. This is equal to net immigration of three million a year. Table 6 shows that for each year added to the retirement age, the share of the population that is working-age in 2060 increases by about one percentage point. Thus, if the retirement age is set at 70, it would have the same effect as adding 10 million immigrants a year for 53 years and a retirement age of 65. If there are concerns about not having enough workers, Tables 6 makes clear that changing the retirement age has a much larger effect than does any realistic level of immigration.
Ratio of Workers to Retirees. Because children, like retirees, have to be supported by the work of others, it probably makes more sense to look at the results in Tables 5 and 6 when examining the effect of immigration on this problem. Nonetheless, in Table 7 (page 10) we report the ratio of working-age persons 15-64 or 15-66 relative to those ages 65 and older or 67 and older. This is different from Tables 5 and 6 because children under age 15 are not included. Assuming that 15-66 constitutes the working-age population, the table shows that without any immigration the number of workers per retiree will decline by 3.5 workers by 2060 — 6.2 to 2.7. If net immigration is 1.25 million a year it will decline by 3.1 workers — 6.2 to 3.1. This means that 88 percent (3.1 ÷ 3.5) of the decline in workers relative to retirees will still occur with the current level of immigration.9 That is, without immigration the decline is 3.1 workers per retire, which is equal to 88 percent of the 3.5 decline that would occur by 2060 if there was no immigration.
As already discussed, zero net immigration is very unlikely. If we compare the net of 1.25 million immigrants a year to net immigration of 300,000 a year, the difference with current immigration is even smaller. Table 7 also shows that if immigration was doubled to 3.2 million (2.5 million net), the number of workers per retiree would be 3.4 in 2060. This means that even with net immigration of 2.5 million, 79 percent of the decline would still occur. And net immigration of 2.5 million a year would result in a U.S. population of 573 million in 2060, double the population in the 2000 Census. It makes little sense to argue that immigration is the key to dealing with the problem of an aging society when doubling immigration to a level that is politically unlikely in the extreme still leaves four-fifths of the problem in place.
Changing the Retirement Age. As already shown in Table 5, changing the retirement age has a large positive impact on the working-age share of the population. The same is also true when considering workers relative to only retirees. Table 8 shows how different retirement ages impact the ratio of workers to retirees. Roughly, each one-year increase in the retirement age above the current age of 65 increases the ratio of working-age persons to retired persons in 2060 by .2. Thus, raising the retirement age to 70 increases the ratio of working-age persons to 3.3 workers in 2060. This is equal to immigration of 5.12 million a year (four million net) assuming that the retirement age remains 65. This is a very large effect. That level of immigration would result in a total population of 700 million in 2060. It seems clear that the most effective way to deal with the decline in workers relative to the elderly is to increase the retirement age. Immigration can have only a very modest impact on the problem.
Immigration’s Small Effect on Aging of Society. The findings in Tables 5 through 8 are not surprising to demographers. It is mainly non-demographers who argue that immigration will have a transformative impact on the nation’s age structure. Immigration adds to both the working-age share of the population and to the population too young or too old to work. Newly arrived immigrants (legal and illegal) are somewhat younger on average than natives. In 2006, the average age of a newly arrived immigrant was 28, versus 36 for natives. But immigrants grow older just like everyone else. Immigrants allowed into the country today become tomorrow’s retirees, adding to the future population of retirees. It may surprise some that the average age of all immigrants in 2006 (not just the newly arrived) was 40, compared to 36 for natives.10 This fact reminds us that immigrants grow older. And while immigrants also tend to have larger families than natives, the differences are not large enough to have much effect on the overall trend of an aging of society.
Comparison with Census Projections of Aging. In our discussion of the impact of immigration on population growth, we pointed out that our projections closely match those of the Census Bureau. The similarities between our projections and those of the Census Bureau also exist when we examine the aging of society. Unfortunately, the Bureau’s March 2004 projections do not provide a dependency ratio, the number of working-age persons relative to retirees and children. Moreover their projections only extend out to 2050. The only real comparison we can make is with their projection of the 65-and-older population, which they do provide. Our projections show that if net immigration is one million a year, 21.4 percent of the population will be 65 or older in 2050. In their March 2004 projections, the Census Bureau projects it would be 20.7 percent. Of course, the Bureau does not assume a constant level of immigration of one million a year in its projections, but instead assumes that the level will vary over time, with the average being very roughly one million a year. Moreover the Bureau is using a different starting year than our projections. Nonetheless, the overall results from our projections are very similar to those of the Census Bureau.
The Bureau’s March 2000 projections do provide more detailed information on the impact of immigration on the aging of society. In its zero net immigration projections, the Bureau finds that the working age (15-64) share of the population would be 58.8 percent in 2060, similar to our zero immigration projection, which finds it would be 57.2 percent. The difference is that their starting year is 2000 and is based on the 1990 Census carried forward. Our projections begin in 2007 and are based on the 2000 Census carried forward. Also, we are using the adjusted middle-range fertility assumptions that the Bureau developed for its March 2004 projections, not the original middle-range assumptions from the January 2000 projections. Even so, the differences are not large. Also, we project that the working-age share of the population, when defined as those 15-64, would be 58.5 percent in 2060 if net immigration was one million a year. The Bureau projects it would be 59.5 percent in their middle-range projections, which assume a varying level of net immigration of very roughly one million. In their January 2000 projections, the Census Bureau states that immigration is a "highly inefficient" means of reducing the ratio of retirees to working-age share of the population in the long term.11 Our results confirm this finding.12 Of course, the similarity between our results and those of the Census Bureau is to be expected because we base our estimates on their projections of birth and death rates and simply vary the immigration component.13
Conclusion
Consistent with Census Bureau projections, we find that future immigration levels have a very large impact on population growth. Also consistent with Census projections, we find that immigration has only a small positive effect on the aging of American society. At present, 1.6 million immigrants settle in the United States annually, and 350,000 leave, for a net level of 1.25 million a year. If that level of net immigration continues, the nation’s total population will grow by 167 million, to 468 million, by 2060. Immigrants who have yet to arrive, but who do so by 2060, plus their descendents, will account for 105 million — or 63 percent — of this future increase. If the annual level of net immigration were 300,000 a year in the future, the population would be 80 million smaller in 2060 than if immigration continues at the current level.
While immigration has a large effect on population size, it has only a small effect on the aging of society. At the current level of net immigration, 61 percent of the nation’s population will be of working age (15-66) in 2060, compared to 60 percent if net immigration were 300,000 a year. If immigration was doubled to 3.2 million a year (2.5 million net), it would only raise the working-age share of the population one additional percentage point, to 62 percent of the population in 2060. However, at that level, the nation’s total population would be 572 million, 272 million larger than it is today. Immigrants do tend to arrive in America relatively young, but they grow older just like native-born Americans. Immigrants admitted today become tomorrow’s retirees. And although they tend to have somewhat larger families than natives, the differences are not large enough to significantly change the nation’s age structure. As a result, immigration makes for a much larger population and more densely settled country, but can have only a small effect on the aging of society.
The debate over immigration should not be whether it makes for a much larger population — without question it does. The debate over immigration should also not be whether it has a large impact on the aging of society — without question it does not. The central question this study raises and that Americans must answer is what costs and benefits come with having a much larger population and a more densely settled country. Some foresee a deteriorating quality of life with a larger population, including its impact on such things as pollution, congestion, loss of open spaces, and sprawl. Others may feel that a much larger population will create more opportunities for businesses, workers, and consumers. These projections do not resolve those questions. What the projections do tell us is where we are headed as a country. The question for the nation is: Do we wish to go there?
Methodology Appendix
Race and Age. To create the projections, we employ what is commonly referred to as a cohort-component model by individual year of age 0-100+ running through 2060. This means that the nation’s population is divided into five race/ethnic categories that are then projected forward using Census Bureau assumptions about births and deaths. The five categories are Hispanics, non-Hispanic Whites, non-Hispanic Blacks, Non-Hispanic American Indians/Alaska Natives, and Non-Hispanic Asians/Pacific Islanders. In this report we refer to these five categories as the five "races" even though the Census Bureau considers Hispanics to be an ethnic group, whose members can belong to any race. However, in its projections the Bureau treats Hispanics as a separate group for both births and deaths without regard to the racial category they fall into. This means that Hispanics are, in effect, a separate category or "race" for Census Bureau projection purposes. This report follows the Bureau’s example and treats Hispanics as a separate group.
The starting point of the projections is the Census Bureau’s January 1, 2006, national residential population estimates by six racial categories, Hispanic ethnicity, age, and sex, transformed into our four Non-Hispanic race categories and Hispanics.14 These estimates are then projected forward to January 1, 2007, as the base year for our projections. The Census Bureau’s six racial categories are White Alone, Black Alone, American Indian or Alaskan Native Alone, Asian Alone, Pacific Islander Alone, and Multiracial. For the Hispanic population, this posed no problem, as we used the total Hispanic population. The Non-Hispanic population required collapsing the Census Bureau’s six races into our four, to be consistent with Census Bureau’s 2001 and 2004 population projections. This is necessary because the Census Bureau provides estimates of the current population divided into six races plus Hispanics, but they have yet to release birth and death rate projections for these populations. We summed the Asian Alone and Pacific Islander Alone populations to form the Asian Alone or Pacific Islander Alone population. Finally, we allocated the Multiracial population to each of our four race categories by multiplying the population by its race-specific allocation factor.15
Births and Deaths. Births for each race are calculated as the sum of the products of the fertile female populations and their corresponding birth rates (rate per 1,000 divided by 1,000). The key assumption here is that babies have the same race as their mothers. Thus, the results of interracial unions are assumed away. This does not have a significant impact on the overall projections because only a small fraction of the population chooses more than one race.16 Deaths for ages 0-100+ are simply the products of the corresponding population’s mortality rates. Put simply, each racial group is divided by sex and by single year of age. We then apply age/race/sex specific death rates to each group each year moving out to 2060. Birth rates are applied only to women who are in their reproductive years. Children born in the United States enter the model as individuals zero years of age. Each year these children move up one year in age and are subject to age/race/sex-specific mortality rates.17
Net Immigration. Following the example of almost all prior population projections, we employ the concept of "net immigration" in this study. Net immigration can be defined as the difference between the number of immigrants arriving each year and the number leaving. It includes both legal and illegal immigrants. Our best estimate for the current level of net immigration is 1.25 million a year. But in the study we report the impact of many different levels of net immigration.
We base our estimate of current net immigration on the following: The March 2005 Current Population Survey (CPS) found that 7.93 million immigrants arrived from January 2000 to the first two months of 2005. (Note: this is new in-migration and not net immigration.) This means new arrivals averaged 1.52 million immigrants over the first the five years of this decade. Of course, the actual level of new immigration was slightly higher because some immigrants who arrived in 2000 or later had died or returned home by 2005, though that number is small. Over this same five-year time period the CPS showed that growth in the size of the foreign-born population was 5.2 million or about one million a year. We estimate that annual deaths among the foreign-born population averaged about 250,000 over this time period given the population’s age, race, and sex — the number varied from 230,000 in 2000 to 263,000 by 2005. For the population to grow by one million a year, it means that out-migration averaged about 250,000. Put simply, the CPS shows that 1.5 million new immigrants arrived, while 250,000 left and 250,000 died for a net increase in the foreign-born population of one million. However, the CPS has some undercount of the foreign-born, particularly new arrivals. Prior research suggests that the undercount in the CPS is 5 percent.18 If we assume a 5 percent undercount for newly arrived immigrants, then new arrivals averaged 1.6 million and out-migration was 350,000, or equal to 22 percent over this time period. For all of our immigration estimates we assume that out-migration equals 22 percent of new immigration.19 While the current level of net immigration is 1.25 million, we provide estimates for many different levels of net immigration. There is, of course, some debate about the level of new immigration, especially illegal immigration. There is also debate about the scale of out-migration, but there is little debate about deaths. Our assumption that out-migration equals about 22 percent of new immigration is based on the most recent data. However, immigration levels can change. In general, the long-term trend since the end of World War II has been for new immigration and net immigration to steadily increase.
In terms of the composition of new arrivals, we use the Census Bureau’s middle series distribution of immigrants by race, sex, and age in 2006.20 The immigrants are then placed into their respective racial categories by age and sex. Age-specific birth and death rates are applied to them on an annual basis. In this report we vary the number of new immigrants arriving, but keep the age/race/sex proportions of the arriving immigrants consistent with Bureau estimates. As already indicated, we follow Census Bureau projections about the future course of mortality and birth rates, including the Bureau’s assumption about how fertility and death rates will change over time. The only real change from Census Bureau projections is net immigration.
Endnotes
1 Both sets of projections can be found at www.census.gov/population/www/projections/popproj.html
2 It is important to note that these projections follow the Census Bureau’s estimates as closely as possible, even though several of the Bureau’s assumptions may be mistaken. One issue with the Census Bureau projections is that they assume that the Hispanic share of new immigrants is only 44 percent, when in fact it has been more than 50 percent in recent years. A second issue is that fertility declines among each racial/ethnic group do not change with the level of immigration, even though foreign-born Hispanics and blacks tend to have higher fertility than their native-born counterparts. We also feel that the Bureau’s assumption about the future fertility rates may be too high. Although these issue have some impact on the model, their effect on the overall results are modest. We intend to incorporate these and other changes into our next set of projections. For these projections, we follow the Census Bureau’s formulation exactly, except that we change the immigration component.
3 National Center for Health Statistics birth records show 947,000 births to foreign-born or immigrant women in 2003.
4 See Steven A. Camarota, "Births to Immigrants in America 1970 to 2002," Center for Immigration Studies Backgrounder, July 2005, which can be found at www.cis.org/sites/cis.org/files/articles/2005/back805.html
5 The Census Bureau’s January 2004 projections can be found at www.census.gov/ipc/www/usinterimproj. See Table 1 for population totals.
6 In estimates released in January 2005, the Department of Homeland Security (DHS) estimated a net growth in the illegal population of 408,000 a year between January 2000 and January 2005. This figure includes deaths among the illegal immigrant population, so it is not a
true net immigration figure. The January 2005 DHS study does not give a specific death rate for the illegal immigrant population. However, in estimates done by the INS in January 2003 they estimated a death rate of 4.2 per 1,000 for illegals. This would result in 42,000 to 52,000 deaths a year if the base population is 10 to 12 million illegal immigrants. This is perfectly consistent with our estimate of net illegal immigration of 450,000 a year. The January 2005 DHS estimates for the illegal population can be found at www.dhs.gov/xlibrary/assets/statistics/publications/ILL_PE_2005.pdf. The INS estimates from January 2003 can be found at www.dhs.gov/xlibrary/assets/statistics/publications/Ill_Report_1211.pdf
7 Research done by the Department of Homeland Security (DHS) and the Pew Hispanic Center and our own research indicate that there are about 11 million illegal immigrants in the population estimates that we use in our projections. The remaining illegals are missed by the Census Bureau. Based on DHS, Pew, and our own research, we assume that the illegal population is 77 percent Hispanic, 12 percent Asian, 7 percent white and 4 percent black. For age, we find that 2 percent of the illegal population is ages 1-4, 14 percent is ages 5-17, 80 percent is ages 18-40, and 4 percent is over age 40. For gender, among adults 18 years of age and older we use a gender breakdown of 55 percent male and 45 percent female. For children, we assume an even sex division. We apply this race/age/sex profile to our 11 million estimate and then remove illegals from the 2007 base population.
8 It worth noting that our assumption that the U.S.-born children of illegal immigrants would remain in the country may tend to understate the actual impact of illegal immigrants on population growth because many of these children would likely return to their parents’ country if the law was enforced, making for a smaller current and future population. On the other hand, we assume that all illegals would leave at once, when in fact it would take time for some or all of the illegal immigrants to leave. The main value of Table 4 is that it provides an estimate of the impact of illegals already here rather than providing a precisely detailed projection of the effect of enforcing the law and causing illegal immigrants to leave the country.
9 There is rounding error in this calculation. The 88 percent represents the actual change caused by the current level of immigration.
10 These figures are from the March 2006 Current Population Survey conducted by the Census Bureau.
11 See page 21 of the report at: www.census.gov/population/www/documentation/twps0038.pdf.
12 As explained in more detail in the Methodology Appendix, the birth rates we used for our projections come directly from the Census Bureau’s March 2004 projections. For the March 2004 projections, the Census Bureau slightly modified the middle-range fertility assumptions from the January 2000 projections. This likely accounts for some of the differences between the working-age share for 2060 in our projections and those done in January 2000 by the Census Bureau.
13 As explained in the Methodology Appendix, our projections use the Census Bureau’s middle-range fertility assumptions originally from their January 2000 projections and adjusted slightly for their March 2004 projections. Those projections assume that the Total Fertility Rate for the three largest groups would be as follows: For Hispanics it would decline from 2.85 children per women in 2007 to 2.48 by 2060. For non-Hispanic whites, fertility would rise slightly from 1.88 to 2.02 over this period. And for blacks the rate would stay the same at 2.08 over the next 53 years. The Census also has a low-range set of fertility assumptions. These assume that fertility for Hispanics would decline form 2.73 to 2.02 by 2060, for blacks the rate would decline from 2.0 to 1.70, and for whites it would decline from 1.80 to 1.65. Although we use the adjusted middle-range assumptions throughout this report, projections using the low-range fertility assumptions reveal similar results to using the middle-range fertility assumptions in most important respects.
Assuming the current level of net immigration of 1.25 million, the total population in 2060 would be 417.5 million using the low fertility assumptions, compared to 468 million using the middle-range fertility assumptions. While the low fertility assumptions produce an overall population that is about 50 million smaller than the middle-range fertility assumptions, the immigration effect is similar. We find that under the low fertility scenario the current level of net immigration results in a total population in 2060 that is 96.7 million larger than if immigration was zero. This is not that different from the 105.3 million the current level of immigration adds, assuming the adjusted middle-range fertility assumptions.
There is also the question of aging. We find that under a zero net immigration projection the working age share of the population, defined as those ages 15-66, would be 59.9 percent using the low fertility assumptions. Under the current level of net immigration (1.25 million) and assuming low fertility, it would be 61.8 percent. This is very similar to the immigration effect found in Table 5, which uses the adjusted middle-range fertility assumptions. Table 5 shows a working-age population of 60.2 percent in 2060 if there is no immigration and 61.6 percent if net immigration is 1.25 million a year.
Overall, the low fertility projections indicate that changing the fertility assumptions does have some effect on overall population size, especially under a zero immigration scenario. But the effect of immigration on population size is similar regardless of the fertility rate used. We also find that the share of the population that is of working age is not very sensitive to whether the middle-range fertility assumptions or the low-range assumptions are used. Although the adjusted middle-range fertility series prepared by the Census Bureau is assumed to be the most likely, the low-range fertility assumptions allow us to see how sensitive these projections are to fertility levels. The results indicate that, in terms of the effect of immigration, the projections
are not that sensitive to fertility assumptions.
Hispanic and white fertility rates have been relatively stable for a number of years, while black fertility has declined since the early 1990s. At present, fertility in the United States is much higher than in other Western countries. One of the most interesting things about U.S. fertility is that American whites have much higher fertility than their European counterparts and foreign-born Hispanics in the United States, especially those from Mexico, have much higher fertility than people in their home countries. There is no reason to think this will not continue. Nonetheless, it is very possible that fertility will fall in the United States as it has elsewhere. The low-range fertility series indicates that it will not fundamentally change the fact that future immigration levels are the key determinant of population growth. It also does not change the fact that immigration can have only a small effect on the working-age share of the population.
14 "National Population Estimates For the 2000s: Monthly Postcensal Resident Population, By Single Year of Age, Sex, Race, And Hispanic Origin," U.S. Census Bureau, 2006. http://www.census.gov/popest/national/asrh/files/NC-EST2006-ALLDATA-R-File13.dat.
15 These allocation factors were based on the distributions of Non-Hispanic population by race in the December 2002 and January 2003 Current Population Surveys (CPS). We use those two years because between 2002 and 2003 the Bureau added the additional races and the multi-race categories to the CPS, so by comparing those years we can see how the new racial categories impacted responses to the race question.
16 In the 2000 Census only 1.4 percent of the population identified as more than one race. And while this population probably will grow in the future, the Census Bureau has not published data on the death and birth rates of multi-racial individuals that allows for projecting their population size into the future. Thus there is no way to include them as a separate category.
17 All original birth and death rates are from "Component Assumptions of the Resident Population by Age, Sex, Race, and Hispanic Origin: Lowest, Middle, and Highest Series, 1999 to 2100," Tables NP-D5, U.S. Census Bureau, 2000, http://www.census.gov/population/www/projections/natdet-D5.html. The death rates used are from the middle series life tables. The birth rates we used are 0.921 * middle series birth rates + 0.079 * low series fertility rates, consistent with the March 2004 interim projection assumptions in "Interim Projections of the U.S. Population by Age, Sex, Race, and Hispanic Origin: Summary Methodology and Assumptions", U.S. Census Bureau, 2004, http://www.census.gov/ipc/www/usinterimproj/idbsummeth.html. This means that our projections follow exactly the fertility assumptions of the Census Bureau projections from March 2004 projections.
18 The Pew Hispanic Center assumes a 5.2 percent undercount of the total foreign-born population in the 2005 CPS. See Figure 3, page 4 in their March 2006 estimate of the illegal population, http://pewhispanic.org/files/reports/61.pdf. Pew bases its 5.2 percent estimate on work done by Passel, Van Hook, and Bean. Their paper is entitled "Narrative Profile with Adjoining Tables of Unauthorized Migrants and Other Immigrants, Based on Census 2000: Characteristics and Methods" which was done for Sabre Systems as part of a contract with the Census Bureau.
19 The Census Bureau in its projections released in January of 2000 assumed out-migration would equal between 23 and 31 percent of new immigration for the 2000 to 2030 period, though the Bureau does not lay out a clear argument in its documentation for why out-migration relative to in-migration would vary in this way over time. The January 2000 projections were based on the 1990 decennial census carried forward and assume that net immigration will be about one million at first, fall after 2010, and then increase after 2025 to around one million a year. The Bureau does not provide much justification for this change in net immigration. The methods statement for the projections done in January 2000 can be found at: www.census.gov/population/www/documentation/twps0038.pdf. Table E in the study reports middle-range migration assumptions.
In March 2004 the Bureau issued "interim projections" using the findings from the 2000 Census for its initial population on which to base its projections. Because the 2004 projections were based on the 2000 Census, the starting point for the estimates is larger than had been the case for the January 2000 projections. (The 2000 Census showed a much larger overall population, especially among Hispanics, than the Bureau had estimated for 2000 before the Census had been done.) Other than the initial population on which to base the projections, the March 2004 projections are essentially the same as the January 2000 projections. The March 2004 projections state that "the components of population change (fertility, mortality, and international migration) are based on those developed for the last full set of projections released in January 2000." The 2004 interim projections were released without a detailed methodology statement. The interim projections can be found at: www.census.gov/ipc/www/usinterimproj.
The Social Security Administration (SSA) also does its own projections. In its most recent report to its board of trustees, published in 2007, the SSA estimated that current net immigration (legal and illegal) averaged 1.2 million between 2000 and 2006, which is almost exactly the same as our estimate of 1.25 million. In fact, SSA estimates that net immigration was 1.24 in 2005. In what they call their "intermediate" projections, which are roughly comparable to the middle-range projections of the Census Bureau, SSA assumes that net immigration will fall by 2010 to one million a year and stay at 900,000 for 75 years. They do not provide a justification on why immigration will be lower for the next century then the current level. For legal immigration, the SSA estimates that out-migration equals 25 percent of new in-migration. The immigration assumptions for SSA 2007 projects can be found in Table V.A1 in the 2007 report at
www.socialsecurity.gov/OACT/TR/TR07/V_demographic.html#wp79519.
20 The projected net migration levels can be found at http://www.census.gov/population/projections/nation/detail/pmigdet.a, Part C of the Tables NP-5 (Census, 2000). The levels were converted into shares by simply dividing each race/age/sex cell by the total. As we vary the immigration component in our projections we keep the race/sex/age proportions of the newly arriving immigrants the same as those used by the Census Bureau.
Steven A. Camarota is the Director of Research at the Center for Immigration Studies. The Center would like to thank Charles Coleman for his efforts in helping us develop these projections.