Related Publications: Reply to Critics
Download a pdf of this Memorandum
Steven A. Camarota is the Director of Research and Ashley Monique Webster a demographer at the Center for Immigration Studies.
Governor Rick Perry (R-Texas) has pointed to job growth in Texas during the current economic downturn as one of his main accomplishments. But analysis of Current Population Survey (CPS) data collected by the Census Bureau show that immigrants (legal and illegal) have been the primary beneficiaries of this growth since 2007, not native-born workers. This is true even though the native-born accounted for the vast majority of growth in the working-age population (age 16 to 65) in Texas. Thus, they should have received the lion’s share of the increase in employment. As a result, the share of working-age natives in Texas holding a job has declined in a manner very similar to the nation a whole.
Among the findings:
- Of jobs created in Texas since 2007, 81 percent were taken by newly arrived immigrant workers (legal and illegal).
- In terms of numbers, between the second quarter of 2007, right before the recession began, and the second quarter of 2011, total employment in Texas increased by 279,000. Of this, 225,000 jobs went to immigrants (legal and illegal) who arrived in the United States in 2007 or later.
- Of newly arrived immigrants who took a job in Texas, 93 percent were not U.S. citizens. Thus government data show that more than three-fourths of net job growth in Texas were taken by newly arrived non-citizens (legal and illegal).
- The large share of job growth that went to immigrants is surprising because the native-born accounted for 69 percent of the growth in Texas’ working-age population (16 to 65). Thus, even though natives made up most of the growth in potential workers, most of the job growth went to immigrants.
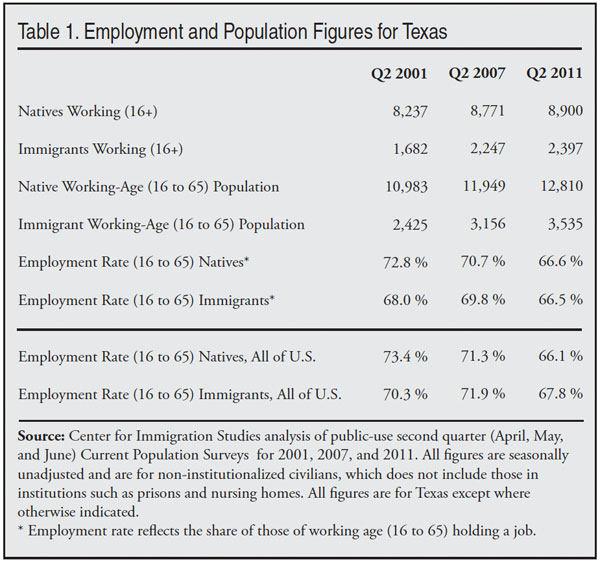
- The share of working-age natives holding a job in Texas declined significantly, from 71 percent in 2007 to 67 percent in 2011. This decline is very similar to the decline for natives in the United States as a whole and is an indication that the situation for native-born workers in Texas is very similar to the overall situation in the country despite the state’s job growth.
- Of newly arrived immigrants who took jobs in Texas since 2007, we estimate that 50 percent (113,000) were illegal immigrants. Thus, about 40 percent of all the job growth in Texas since 2007 went to newly arrived illegal immigrants and 40 percent went to newly arrived legal immigrants.
- Immigrants took jobs across the educational distribution. More than one out three (97,000) of newly arrived immigrants who took a job had at least some college.
- These numbers raise the question of whether it makes sense to continue the current high level of legal immigration and also whether to continue to tolerate illegal immigration.
Introduction
One of the most important issues in the unfolding presidential election is the nation’s lack of job growth. The U.S. labor market has been afflicted with high unemployment and low employment rates for more than three years. As Republicans go through the process of selecting the party’s nominee, job growth in Texas during the current economic downturn has been the subject of much discussion. GOP frontrunner Rick Perry has argued that he has a proven record of job creation in his state, even during the current economic downturn. Most of the debate over the state’s job growth has focused on what types of jobs have been created. The extent to which foreign-born or immigrant workers vs. native-born workers benefited from increased employment in the state has received little attention. This Memorandum examines job growth in Texas. The findings indicate that most of the increase in jobs in Texas since 2007 went to foreign-born (immigrant) workers, both legal and illegal, not U.S.-born workers.
Data and Methods
The two primary employment surveys collected by the United States government are referred to as the “household survey” (also called the Current Population Survey or CPS) and the “establishment survey.” The establishment survey asks employers about the number of workers they have. In contrast, the CPS asks people at their place of residence if they are working. While the two surveys shows the same general trends, the figures from the two surveys do differ to some extent. Because the CPS asks actual workers about their employment situation, only it provides information about who is working, who is looking for work, and who is not working or looking for work. Moreover, only the CPS asks respondents about their socio-demographic characteristics such as race, education level, age, citizenship, and year of arrival in the United States. Thus the CPS can be used not only to compare job growth among immigrants and the native-born, it can also be used to examine the share of different groups who are employed or unemployed or to make comparisons about any other measure of labor force attachment. For these reasons, this report uses the public-use files of the CPS to examine employment in Texas by quarter.1
Findings
Growth in Employment. There are two ways to examine the share of employment growth that went to immigrants vs. natives in Texas during the economic downturn. One way is to compare the increase in total employment to the number of newly arrived immigrants holding a job. The second way is to compare the increase in employment to net growth in the number of immigrants holding a job. While there are differences in these two comparisons, no matter which method is used, the data show that a disproportionate share of job growth went to immigrant workers.
The Impact of Newly Arrived Immigrants. The left bar in Figure 1 shows the share of population growth among the working age (16 to 65) accounted for by newly arrived immigrants in Texas between the second quarter of 2007, before the recession began, and the second quarter of 2011, which is the most recent quarter for which data are available.2 Newly arrived immigrants (legal and illegal) are defined as those who indicated in the CPS that they came to the United States in the second quarter of 2007 or after.3 The population growth of 28.9 percent is for those of working age (16 to 65). There were 358,000 working-age (16 to 65) immigrants in 2011 who indicated that they had arrived in the United States in 2007 or later. This equals 28.9 percent of the 1.24 million overall increase in the size of the working-age population in Texas between the second quarter of 2007 and the second quarter of 2011. The second bar in Figure 1 shows employment relative to the number of newly arrived immigrants holding a job. There were 225,000 immigrants holding a job in 2011 who indicated that they had arrived in the United States in 2007 or later. This equals 80.6 percent of the 279,000 overall increase in employment in Texas between 2007 and 2011. Of new arrivals, 93 percent indicated they were not U.S. citizens.4 The newly arrived can be described as new foreign workers.
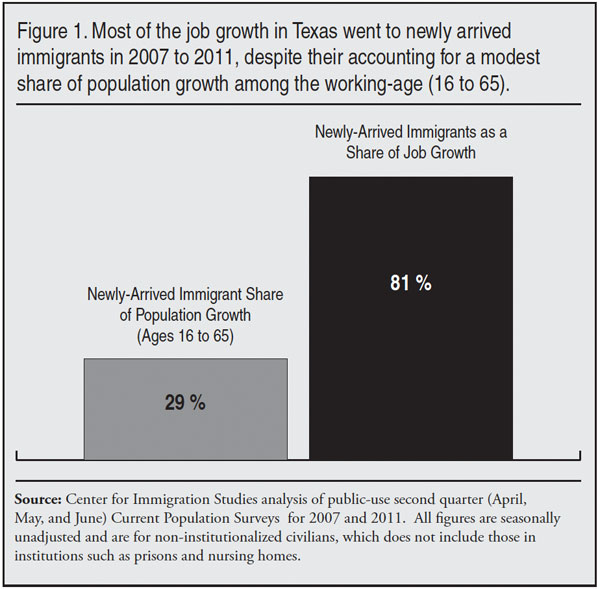
The above analysis shows that newly arrived immigrants took most of the net increase in jobs in Texas. This is the case even though new immigrants accounted for a modest share of population growth among the working age (16 to 65). Put a different way, since natives accounted for the overwhelming share of the growth in the number of working-age people in the state, it would be expected that they would receive roughly the same share of the net increase in jobs, but this was not the case. We report figures for the working-age population because about 96 percent of all workers in America fall into this age group, making this population the pool of potential workers from which employers draw.
Legal vs. Illegal Immigration. It is well established that illegal aliens do respond to government surveys such as the decennial Census and the Current Population Survey. While the CPS does not ask immigrants if they are legal residents of the United States, the Urban Institute, the Department of Homeland Security (DHS), the former INS, the Pew Hispanic Center, and the Census Bureau all have used socio-demographic characteristics in the data to estimate the size of the illegal-alien population. We follow this same approach.5 Our best estimate is that, of Texas immigrants holding a job in 2011 who indicated that they arrived in the country between 2007 and 2011, half are illegal immigrants. It should be noted that no estimate of illegal immigration is exact. It is possible that somewhat fewer or somewhat more of the newly arrived are illegal immigrants. If our estimate is too high, then more are legal immigrants; if our estimate is too low, then more are illegal immigrants. Assuming our estimates are correct, of recently arrived working-age immigrants in the state, 113,000 are in the country illegally.6 The other half of the recently arrived immigrants (112,000) are legally in the country. Compared to the overall increase jobs in Texas from 2007 to 2011, 40 percent went to new illegal immigrants and 40 percent went to new legal immigrants. This means that in Texas — one of the few states that experienced job growth after 2007 — native-born workers benefited little from this growth. These numbers raise the question of whether it makes sense to continue to allow so many legal immigrants into the country and also whether it makes sense to continue tolerating illegal immigration. Certainly both policies have consequences for the labor market.
Net Changes in Number of Immigrants. Figure 2 uses a different method to examine the share of job growth that went to new immigrants in Texas. Rather than looking at new arrivals, Figure 2 compares overall job growth in the CPS to the net increase in immigrant employment. The left bar shows that the net increase in the number of working-age immigrants accounted for 30.6 percent of the net increase in the overall size of the working-age (16 to 65) population in Texas from the second quarter of 2007 to the same quarter in 2011. The net increase in working-age immigrants was 379,000 and this was equal to 30.6 percent of the 1.24 million increase in the total working-age population in Texas over this time period. This, of course, means that the net increase in the number of native-born Texans accounted for 69.4 percent of population growth among 16 to 65 year olds over this period. The bar on the right side of Figure 2 reports the share of net employment growth accounted for by the net increase in immigrants working. The net increase in immigrant workers was 150,000 and this equaled 53.6 percent of the 279,000 overall growth in employment from 2007 to 2011.
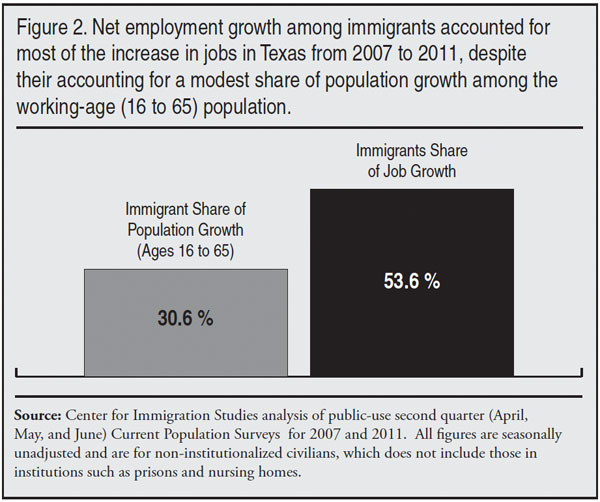
The immigrant share of employment growth is less than when we examine new arrivals (Figure 1). But it is still the case that immigrants accounted for less than one-third of population growth from 2007 to 2011, but more than half of all the job growth in Texas. Thus, whether we calculate the impact of immigration in Texas by looking at the share of jobs taken by newly arrived immigrants (Figure 1) or by looking at the net increase in immigrant workers (Figure 2), in both cases a disproportionate share of job growth in Texas went to immigrants.
It is worth noting that the net increase in immigrants is different from the number of new arrivals because net figures are impacted by immigrants leaving the state each year as well as the movement of immigrants into Texas. Net figures also reflect the small fraction of immigrants who die each year. Moreover, we are looking at those 16 to 65 or those who are employed, who are generally in this same age group. Therefore, some people enter these populations by reaching working age each year, while others age out of these populations. Still others who are of working age are no longer working. Thus, net figures reflect many factors, while the number of new arrivals simply shows those coming into the United States and settling in Texas. What is important about these results is that, in Texas, we can say that although natives accounted for the overwhelming majority of growth in the number of potential workers — persons 16 to 65 — most of the increase in jobs went to immigrants.
In terms of evaluating the nation’s immigration system, looking at new arrivals may be more relevant than net changes because those arriving in the country directly reflect both those admitted legally as well as the level of new illegal immigration. In contrast, net changes reflect many factors such as deaths or a decision to leave the country.
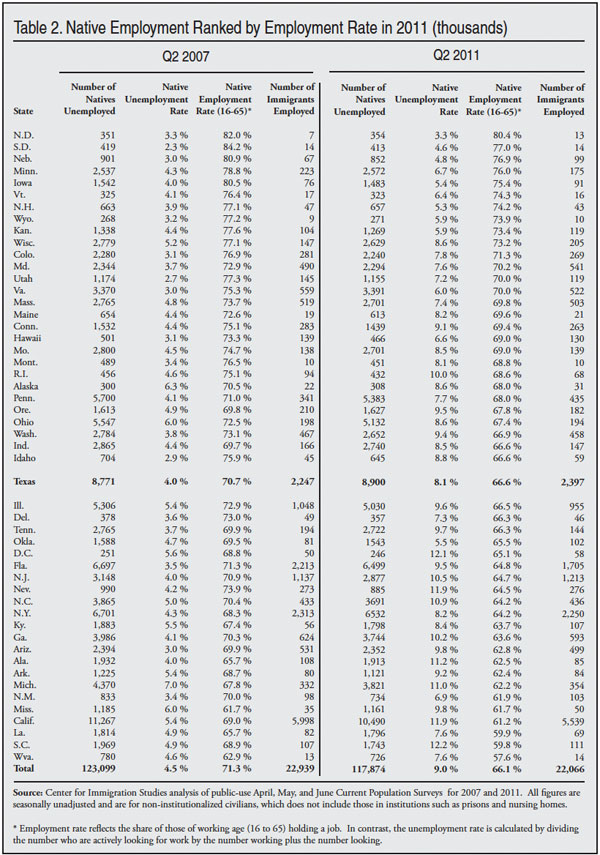
The Unemployment and Employment Rate. In addition to looking at job growth, there are other ways to examine the labor market. Table 2 reports a variety of employment figures by state for the second quarters of 2007 and 2011. But no matter what measure is used, it is difficult to find evidence to support the argument that things are very different in Texas than in the rest of the country for the native-born population. In the second quarter of 2011, the unemployment rate in Texas was 8.1 percent for natives, ranking the state 22nd out of 50 states in terms of the lowest rate. If we compare the growth in unemployment from 2007 to 2011, the rate roughly doubled in Texas, which is very similar to what happened in the country as a whole. The share of working-age natives holding a job in Texas was 66.6 percent in 2011, ranking Texas 29th in the nation. Both the unemployment rate and the employment rate represent a significant deterioration for natives since 2007. A deterioration that roughly parallels what took place in the rest of the nation.
What Types of Jobs? Some commentators have expressed concern that most of the job growth in Texas is for low-wage jobs requiring relatively little education. While that issue is outside of the scope of this analysis, the CPS does show that immigrants gained jobs across the educational distribution. For example, overall 55.2 percent (154,000) of the net increase in jobs since 2007 in Texas went to workers (immigrant and native-born) who had no more than a high school education. That is, they either did not graduate high school or did graduate, but had no additional schooling. Of the net increase in jobs for these less-educated workers, 63 percent went to immigrant workers even though they accounted for only 44.2 percent of population growth among those of working-age who have no more than a high school education. Of the net increase in jobs for workers with education beyond high school, 42.1 percent went to immigrants. This compares to their 21.8 percent share of population growth among working-age individuals with more than a high school education. When examined in this way, immigrants made gains across the educational distribution out of proportion to their population shares.
Some may still feel that less-educated immigrants who work at the bottom of the labor market do not really compete with natives. There is a long debate among economists on this topic. It is true that 56.8 percent of newly arrived immigrants had no more than a high school education. However, there are more than three million native-born Texans working in the state who have no more than an high school education. Moreover, between 2007 and 2011 the number of native-born Texans with a high school degree or less who were not working increased by 259,000 over this time period. The unemployment rate for these less-educated, U.S.-born Texans rose substantially after 2007 and stood at 11.2 percent in the second quarter of 2011. There are a very large number of natives who work in lower-skilled occupations. And less-educated natives who generally work at such jobs have done very poorly in Texas, as they have throughout the country. It would be very difficult to find evidence that less-educated workers were in short supply in the state.
It must also be remembered that many immigrants are more educated. When we look at the number of newly-arrived immigrants in Texas, we find that 43.2 percent (97,000) of those that took a job in Texas had at least some college. If we look at the net gain in employment among more educated immigrants, rather than new arrivals, the growth was 53,000, which means that more-educated workers accounted for one-third of the net growth in immigrant employment. Thus it would a mistake to assume that immigrants are only competing for jobs at the bottom end of the labor market.
Conclusion
This analysis shows that job growth was significant in Texas. But, depending on how one calculates the impact of immigration, between 2007, before the recession began, and 2011 more than three-quarters or more than half of that growth went to immigrants. This is the case even though the native-born accounted for more than two-thirds of the growth in the working-age population. Some may argue that it was because so many immigrants arrived in Texas that there was job growth in the state. But if immigration does stimulate job growth for natives, the numbers in Texas would be expected to look very different. The unemployment rate and the employment rate show a dramatic deterioration in the Texas for the native-born that was similar to the rest of the country. Moreover, if immigration does stimulate job growth for natives, why have states that received so many new immigrants done so poorly in recent years? (See Table 2.) For example, unemployment in the top-10 immigrant-receiving states in 2011 averaged 8.7 percent, compared to 8.1 percent in the other 40 states. Moreover, unemployment is 7.2 percent on average in the 10 states where the fewest immigrants arrived since 2007. These figures do not settle the debate over the economics of immigration. What they do show is that high immigration can go hand in hand with very negative labor market outcomes for the native-born. And conversely the native-born can do relatively well in areas of lower immigration.
There is a long and complex debate among economists about whether the native-born population benefits economically from immigration, which cannot be settled here. There is also significant debate about whether the impact of immigration can be measured by comparing different parts of the country that have varying levels of immigration. What we can say about Texas is that there has been significant job growth in the state since 2007, and that immigrants (particularly newly arrived non-citizens) were the primary beneficiaries of this growth. This is an important finding and should be part of any discussion of the performance of the Texas economy.
End Notes
1 For each quarter the CPS includes about 18,000 native-born Americans and 3,600 immigrants in Texas.
2 Comparing the same quarter is important because it controls for seasonal factors that may impact employment. All figures in this report are seasonally unadjusted because they are computationally simpler and easier for other researchers to replicate.
3 The Census Bureau groups year-of-arrival data in order to preserve the anonymity of survey participants. This makes it more difficult to look at post-2007 arrivals in the 2011 data because those who indicated they came to the country in 2008 to 2011 are coded as one group, and those who indicated they arrived in 2006 to 2007 are coded as another group. To calculate recently arrived immigrants in 2011, we look at those who arrived in 2008 to 2011 and add 37.5 percent of those who indicated they arrived in 2006 and 2007. By taking only 37.5 percent of the 2006-2007 arrival cohort we are counting just three of the eight quarters between 2006 to 2007. So, for example, the data for 2011 show 169,000 employed immigrants who said they arrived in the country in 2008 to 2011. The 2011 data also show 150,000 immigrants who said they arrived in 2006 and 2007. We add 37.5 percent (56,000) of 150,000 to 169,000 for a total of 225,000 immigrants in 2011 who said they arrived between 2007 and 2011. It is worth noting that even if we use only the 169,000 immigrant workers who indicated that they arrived in 2008 to 2011, and exclude the three quarters in 2007, this would still equal 76 percent of overall job growth in Texas. Thus, including the 2006-2007 cohort of immigrants makes little difference to the overall results. To calculate the impact of newly arrived immigrants on the overall working-age population (16 to 65) in Texas we employ the same basic approach.
4 The 7 percent who are naturalized citizens are those who are re-entering the country or who naturalized very quickly after arriving because they married American citizens or otherwise were able to expedite their naturalization, such as those in the military.
5 To distinguish legal from illegal immigrants in the survey this report uses citizenship status, year of arrival in the United States, age, country of birth, educational attainment, sex, and marital status. We use these variables to assign probabilities to each respondent. Those individuals who have a cumulative probability of 1 or higher are assumed to be illegal aliens. The probabilities are assigned so that both the total number of illegal aliens and the characteristics of the illegal population closely match other research in the field, particularly the estimates developed by the Department of Homeland Security/legacy INS, the Urban Institute, and the Pew Hispanic Center. This method is based on some very well established facts about the characteristics of the illegal population. For example, it is well known that illegal aliens are disproportionately young, male, unmarried, under age 40, have few years of schooling, etc. Thus, we assign probabilities to these and other factors in order to select the likely illegal population. In some cases, we assume that there is no probability that an individual is an illegal alien.
6 The Department of Homeland Security (DHS) estimates that the illegal immigrant population grew by 90,000 in Texas between January 2008 and January 2010. Texas is one of the only states in the country where the size of the illegal population increased over this period. The DHS estimate is similar to our estimate of 112,000 new illegal immigrant workers arriving from abroad and settling in the state from 2007 to 2011. The DHS estimates are only through January 2010, while our figures go through the second quarter of 2011. Moreover, DHS numbers are a net increase, which tends to be lower than new arrivals. See Table 4 in “Estimates of the Unauthorized Immigrant Population Residing in the United States: January 2010”, at http://www.dhs.gov/xlibrary/assets/statistics/publications/ois_ill_pe_20....