Download a pdf of this Backgrounder
Related Publications: Video, Transcript
Steven A. Camarota is the Director of Research at the Center for Immigration Studies.
Thirteen years after welfare reform, the share of immigrant-headed households (legal and illegal) with a child (under age 18) using at least one welfare program continues to be very high. This is partly due to the large share of immigrants with low levels of education and their resulting low incomes — not their legal status or an unwillingness to work. The major welfare programs examined in this report include cash assistance, food assistance, Medicaid, and public and subsidized housing.
Among the findings:
- In 2009 (based on data collected in 2010), 57 percent of households headed by an immigrant (legal and illegal) with children (under 18) used at least one welfare program, compared to 39 percent for native households with children.
- Immigrant households’ use of welfare tends to be much higher than natives for food assistance programs and Medicaid. Their use of cash and housing programs tends to be similar to native households.
- A large share of the welfare used by immigrant households with children is received on behalf of their U.S.-born children, who are American citizens. But even households with children comprised entirely of immigrants (no U.S.-born children) still had a welfare use rate of 56 percent in 2009.
- Immigrant households with children used welfare programs at consistently higher rates than natives, even before the current recession. In 2001, 50 percent of all immigrant households with children used at least one welfare program, compared to 32 percent for natives.
- Households with children with the highest welfare use rates are those headed by immigrants from the Dominican Republic (82 percent), Mexico and Guatemala (75 percent), and Ecuador (70 percent). Those with the lowest use rates are from the United Kingdom (7 percent), India (19 percent), Canada (23 percent), and Korea (25 percent).
- The states where immigrant households with children have the highest welfare use rates are Arizona (62 percent); Texas, California, and New York (61 percent); Pennsylvania (59 percent); Minnesota and Oregon (56 percent); and Colorado (55 percent).
- We estimate that 52 percent of households with children headed by legal immigrants used at least one welfare program in 2009, compared to 71 percent for illegal immigrant households with children. Illegal immigrants generally receive benefits on behalf of their U.S.-born children.
- Illegal immigrant households with children primarily use food assistance and Medicaid, making almost no use of cash or housing assistance. In contrast, legal immigrant households tend to have relatively high use rates for every type of program.
- High welfare use by immigrant-headed households with children is partly explained by the low education level of many immigrants. Of households headed by an immigrant who has not graduated high school, 80 percent access the welfare system, compared to 25 percent for those headed by an immigrant who has at least a bachelor’s degree.
- An unwillingness to work is not the reason immigrant welfare use is high. The vast majority (95 percent) of immigrant households with children had at least one worker in 2009. But their low education levels mean that more than half of these working immigrant households with children still accessed the welfare system during 2009.
- If we exclude the primary refugee-sending countries, the share of immigrant households with children using at least one welfare program is still 57 percent.
- Welfare use tends to be high for both new arrivals and established residents. In 2009, 60 percent of households with children headed by an immigrant who arrived in 2000 or later used at least one welfare program; for households headed by immigrants who arrived before 2000 it was 55 percent.
- For all households (those with and without children), the use rates were 37 percent for households headed by immigrants and 22 percent for those headed by natives.
- Although most new legal immigrants are barred from using some welfare for the first five years, this provision has only a modest impact on household use rates because most immigrants have been in the United States for longer than five years; the ban only applies to some programs; some states provide welfare to new immigrants with their own money; by becoming citizens immigrants become eligible for all welfare programs; and perhaps most importantly, the U.S.-born children of immigrants (including those born to illegal immigrants) are automatically awarded American citizenship and are therefore eligible for all welfare programs at birth.
- The eight major welfare programs examined in this report are SSI (Supplemental Security Income for low income elderly and disabled), TANF (Temporary Assistance to Needy Families), WIC (Women, Infants, and Children food program), free/reduced school lunch, food stamps (Supplemental Nutrition Assistance Program), Medicaid (health insurance for those with low incomes), public housing, and rent subsidies.
Introduction
Concern that immigrants may become a burden on society has been a long-standing issue in the United States. As far back as colonial times there were restrictions on the arrival of people who might become a burden on the community. This report analyzes survey data collected by the Census Bureau from 2002 to 2009 to examine use of welfare programs by immigrant and native households, particularly those with children. The Current Population Survey (CPS) asks respondents about their use of welfare programs in the year prior to the survey,1 so we are examining self-reported welfare use rates from 2001 to 2009. The findings show that more than half of immigrant-headed households with children use at least one major welfare program, compared to about one-third of native-headed households. The primary reason immigrant households with children tend to have higher overall rates is their much higher use of food assistance programs and Medicaid; use of cash assistance and housing programs tends to be very similar to native households.
Why Study Immigrant Welfare Use?
Use of welfare programs by immigrants is important for two primary reasons. First, it is one measure of their impact on American society. If immigrants have high use rates it could be an indication that they are creating a net fiscal burden for the country. Welfare programs comprise a significant share of federal, and even state, expenditures. Total costs for the programs examined in this study were $517 billion in fiscal year 2008.2 Moreover, those who receive welfare tend to pay little or no income tax. If use of welfare programs is considered a problem and if immigrant use of those programs is thought to be high, then it is an indication that immigration or immigrant policy needs to be a adjusted. Immigration policy is concerned with the number of immigrants allowed into the country and the selection criteria used for admission. It is also concerned with the level of resources devoted to controlling illegal immigration. Immigrant policy, on the other hand, is concerned with how we treat immigrants who are legally admitted to the country, such as welfare eligibility, citizenship requirements, and assimilation efforts.
The second reason to examine welfare use is that it can provide insight into how immigrants are doing in the United States. Accessing welfare programs can be seen as an indication that immigrants are having a difficult time in the United States. Or perhaps that some immigrants are assimilating into the welfare system. Thus, welfare use is both a good way of measuring immigration’s impact on American society and immigrants’ adaptation to life in the United States.
Methodology
The information for this Backgrounder is drawn from the public-use files of the CPS. We use the CPS beginning in 2002 because in that year the survey was redesigned and re-weighted by the Census Bureau, including additional questions about use of welfare programs. The survey identifies what the Census Bureau describes as the native-born and foreign-born populations. The foreign-born are defined as persons living in the United States who were not U.S. citizens at birth. In this report we use the terms foreign-born and immigrant synonymously. Immigrants or the foreign-born include naturalized American citizens, legal permanent residents (green card holders), illegal immigrants, and people on long-term temporary visas such as students or guest workers. It does not include those born abroad of American parents or those born in outlying territories of the United States, such as Puerto Rico, who are considered U.S.-born or native-born. We also use the terms native, native-born, and U.S.-born synonymously. Prior research indicates that Census Bureau data like the CPS capture the overwhelming majority of both legal and illegal immigrants. The Department of Homeland Security (DHS) Office of Immigration Statistics estimates that the undercount of immigrants in Census Bureau data is about 5.5 percent. Most of this undercount is of the illegal immigrant population. The undercount of illegal immigrants specifically is thought by DHS to be 10 percent.3
The CPS collected in March of each year oversamples minorities and is considered one of the best sources of information on immigrants. The March CPS is also referred to as the Annual Social and Economic Supplement of the Current Population Survey (ASES). The ASES includes questions on use of major welfare programs and is one of the only sources of information available on differences in immigrant and native use of welfare programs. When we examine use rates by state we combine two years of data (e.g., 2009 and 2010) to get more statistically robust estimates for smaller states.
The eight major welfare programs examined in this report are SSI (Supplemental Security Income for low income elderly and disabled), TANF (Temporary Assistance to Needy Families), WIC (Women, Infants, and Children food program), free/reduced school lunch, food stamps (now called Supplemental Nutrition Assistance Program), Medicaid (health insurance for those with low incomes), public housing, and rent subsidies.4 These programs constitute the core of the nation’s welfare system.
Why Welfare Use by Households with Children? We concentrate on welfare use for households with children because the nation’s welfare programs are designed specifically to provide assistance to low-income households with children. However, we also provide statistics for all households and for those without children. Examining welfare use by household means that we are primarily comparing welfare use by immigrants and their young children to welfare use by natives and their young children. Some advocates for expansive immigration argue that this type of analysis understates the benefits of immigration because some day the children who receive welfare may pay back that money as taxpaying adults. But, they argue, this payback is not counted because once these U.S.-born children reach adulthood they are counted as natives. There are a number problems with this argument. First, as we will see, households comprised of only immigrants, with no U.S.-born children, have similarly high use rates. Thus, the presence of U.S.-born children does not explain the high overall welfare use of immigrant households.
Second, a large body of prior research has examined the fiscal impacts of immigration, including their use of public services by household. Perhaps the largest study of its kind was done by the National Research Council in 1997. The NRC states, “Since the household is the primary unit through which public services are consumed and taxes paid, it is the most appropriate unit as a general rule and is recommended for static analysis.”5 Because this report is focused on the static, or current, use of welfare, it makes sense to report use by household. In their study of New Jersey, Deborah Garvey and Thomas Espenshade also used households as the unit of analysis because “households come closer to approximating a functioning socioeconomic unit of mutual exchange and support.”6 Borjas and Hilton, in their 1996 examination of welfare use by immigrants and natives in the Quarterly Journal of Economics, also relied on a household-level analysis of immigrant and native welfare use.7 The Census Bureau has itself reported welfare use for immigrant and native households.8 A more recent study from the Heritage Foundation, “The Fiscal Cost of Low-Skill Households to the U.S. Taxpayer,” also reported use of welfare programs by households.9
The primary reason researchers have looked at households is that eligibility for such programs is based on the income of all family or household members. Or, as the aforementioned NRC study observed, “the household is the primary unit through which public services are consumed.” Thus, a child can only be enrolled in Medicaid or free/reduced school lunch if the total income of his or her family or household is below the eligibility threshold. Moreover, most welfare benefits can be consumed by all members of the household. Food purchased using WIC or food stamps is available to anyone in the household as a practical matter. Likewise, public housing subsidies benefit everyone who lives in the housing unit. Again, this is part of the reason the total income of all those who reside in the household is used to determine eligibility.
Though obvious, it is also important to remember that money is fungible. If the government provides food or health insurance to children, then their parents will not have to spend money on these things, allowing them to spend it on other items. This is a clear benefit to parents. Finally, the CPS is collected by household. Like almost all other government surveys, the CPS is a “survey by proxy.” This means that one person in the household responds to all the questions about each individual in the household. Thus the primary unit of analysis in the CPS is the household. It is the basis on which data is collected.
It must also be remembered that the comparisons in this report are between native and immigrant households with children. As such, we are comparing welfare used by immigrants and their children with welfare used by natives and their children. The findings show that a much larger share of immigrants are unable to support their children and turn to the nation’s welfare system to support themselves or their children. This would seem to be an important finding in itself because it is an indication that our immigration system is allowing in immigrants who are not able to support their own children.
It is also worth noting that any hoped-for tax benefit from the U.S.-born children of immigrants when they reach adulthood is a long way off. Therefore, even if this benefit does exist, it does nothing to offset the fiscal costs created by their welfare use at the current time. Finally, if receipt of welfare by the U.S.-born children of immigrants should not be considered because some day the children may pay the money back as taxpayers, then the same must also be true for welfare programs used by the children of the native-born. A large share of welfare costs (cash and non-cash) in this country is for children. If welfare received by children should not be counted as a cost because someday the child may pay it back, then many of the costs of the welfare system should not be counted. Of course this makes no sense. Taxpayers and public coffers are out the money spent on children and the costs are real. Arguing that the child of an immigrant, or a native for that matter, may possibly pay the money back some time in the future does not change this fact. Given the reasons listed above, most researchers who have examined welfare use have done so by household. We follow this generally accepted practice in this report.
Unreported Welfare Use. Although almost all other researchers in this field have relied on self-reporting in the CPS or some other government survey, one limitation of this approach is that it understates welfare use. It is well established that respondents to the CPS tend to understate their use of social services. One reason for this seems to be the survey by proxy methodology used to collect the data, which is discussed in the methods section of this report. While the methodology is practical and generally produces reliable information, it has its problems. One problem seems to be that the person responding to the CPS may not be aware of all of the programs or the size of the payments that are received by every individual in the household.
The problem of under-reporting of welfare is well known by the Census Bureau and has been studied for some time.10 For example, a comparison of administrative data on Medicaid to the results in the CPS shows that the survey reports at least 10 million fewer persons on the program than there actually are.11 Use of cash and food programs is also under-reported in the CPS. This problem, however, should not prevent comparisons between immigrants and natives because there is no clear evidence that immigrant or natives are more likely to under-report welfare use.12 So the undercount should be similar for both groups, making comparisons possible. What this does mean is that the welfare use reported in this analysis is too low, and the actual use rates for immigrants and natives alike are higher.
Findings
Overall Use Rates. Figure 1 shows the share of immigrant- and native-headed households with children (under age 18) using at least one major welfare program from 2002 to 2009. Overall, the figure shows that immigrant households with children have used welfare programs at consistently higher levels than natives for most of the last decade. In 2001, 50 percent of all immigrant households with children used at least one welfare program, compared to 32 percent for native households. By 2009, that had grown to 57 and 39 percent, respectively. Figure 1 also shows that the rate for Hispanic immigrant households with children is much higher than that for native households and immigrants generally.
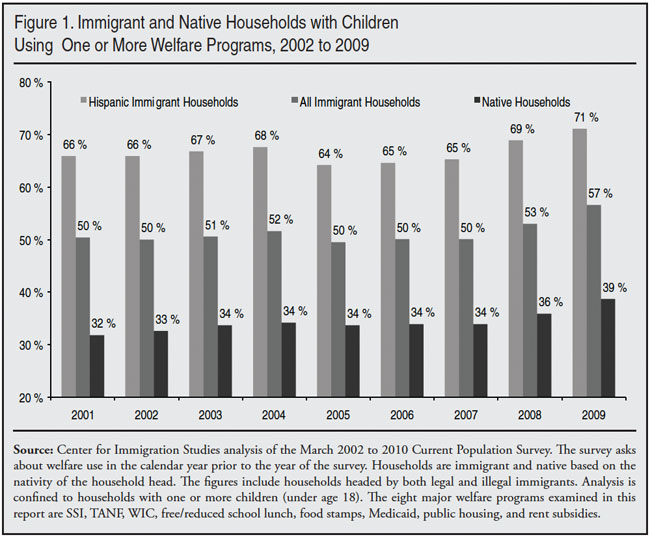
Figure 2 provides a detailed breakdown by type of welfare program. The figure shows that immigrant households with children use welfare at much higher rates than natives for food assistance programs and Medicaid. Use of cash and housing programs tends to be very similar to natives. Table 1 shows a detailed breakdown of the same information for all years, 2002 to 2009. The table shows that the pattern of higher immigrant use of food assistance and Medicaid has existed since 2002.


Households Comprised Only of Immigrants. As already discussed, by examining welfare use by household we are primarily comparing immigrants and their children to natives and their children. But we can also examine immigrant households with children in which all persons in the household are foreign-born. The top of Table 2 reports the use rates for households comprised entirely of immigrants. The table shows that these immigrant-only households have use rates similar to all immigrant-headed households — 56 percent. Use of cash assistance is a little lower for immigrant-only households, while use of public housing is a little higher. The difference in use of food assistance programs is somewhat higher for immigrant-only households than for all immigrant-headed households. The difference for Medicaid is significantly lower for immigrant-only households than for all households headed by immigrants with children, though it is still higher than that of native households. This indicates that, at least for that program, the presence of U.S.-born children makes a significant difference.

Working Households. Table 2 also reports welfare use for households with at least one individual who worked during the year. The table shows that for both immigrant and native households with children, the presence of a worker does not make much difference in terms of welfare use. It is also important to note that the nation’s welfare system is designed to assist low-income workers with children. The vast majority (95.1 percent) of immigrant households with children had at least one worker in 2009. As a result, almost all of the welfare used by immigrant households is used by households with at least one worker. Work and welfare, particularly non-cash programs, do go together. The stereotype of someone not working and accessing a welfare program is simply mistaken.
Welfare Use by Household Size. Immigrant households with children tend to have somewhat more children than native households. The average native-headed household with children has 1.85 children, compared to 1.96 children for immigrant-headed households. So having somewhat larger families could account for some of the observed difference in welfare use. When we control for the number of children in a household, however, the large difference in welfare use remains. Table 2 reports use of welfare programs based on the number of children (under age 18) in the household.
As we have seen, the overall difference in welfare use for immigrant and native households with children is 17.9 percentage points. Table 2 shows that for households with only one child, the gap between immigrant and native household use is 11.3 percentage points. So it might be the case that some of the reason for the higher welfare use rate among immigrant households with children is larger families. However, the percentage-point gap for those with two children is 19.6 percentage points; 24.9 for those with three children; and 21.4 for those with four or more children. Thus the gap does not narrow even when we control for the difference in the number of children.
Refugee and Non-Refugee-Sending Countries. A longstanding part of U.S. immigration policy has been to admit persons for humanitarian reasons. As these individuals are fleeing persecution, they are likely to be the immigrants least prepared for a new life in this country. Moreover, refugees have somewhat more generous welfare eligibility than other legal immigrants.13 Thus, those admitted on humanitarian grounds would be expected to have the highest welfare use rates. Table 2 shows welfare use for households with children headed by an immigrant from a major refugee-sending country.14
Overall, Table 2 shows that households with children headed by immigrants from refugee-sending countries actually have somewhat lower welfare use rates than those from non-refugee-sending countries. However, a closer look at the programs reveals a more complex pattern. Refugee-sending countries tend to have higher use of cash and housing programs than non-refugee households. In contrast, use of food assistance is actually higher for non-refugee immigrant households and Medicaid use tends to be very similar for both groups. What we can say from the table is that the overall use rates for immigrant households with children are not significantly higher than those of native households because of refugees. If we exclude the primary refugee-sending countries, the share of immigrant households with children using at least one welfare program is still 57 percent.
Welfare Use by Year of Entry. The CPS asks immigrants when they came to the United States. Using responses to that question in 2010, Table 2 reports welfare use based on when the household head said he or she came to the United States. The table reports the figures by decade. Figure 3 reports the same information by more detailed year of arrival.15 Taken together, the year of arrival data in Table 2 and Figure 3 show that welfare use for immigrant households with children remains higher than for natives even after they have been in the country for many years. Figure 3 shows that welfare use tends to rise over time, hitting a peak when immigrants have been in the country for about 15 years. It seems that many immigrants assimilate into the welfare system.

Welfare Use by Education Level. Table 3 reports welfare use by the education level of the household head. Not surprisingly, the table shows huge differences in welfare use by educational attainment. Those with higher education tend to have lower welfare use, while those with the lowest education tend to have higher use of welfare programs. Among immigrant households with children headed by a person with less than a high school education, 80.4 percent accessed at least one welfare program. The figures for the least-educated native households with children are correspondingly high at 76.3 percent — a 4.1 percentage point gap. This is dramatically smaller than the 17.9 percentage-point gap that exists for all immigrant- and native-headed households with children. A much larger share of immigrant households with children are headed by someone who has not completed high school. The 2010 CPS shows that 31.9 percent of immigrant households with children are headed by someone who has not graduated high school, compared to 8.9 percent for native households with children. This is an indication that the lower average educational attainment of immigrants explains a good deal of their higher welfare use.

However, the difference between immigrant and native households with children in the more educated categories is still quite wide. For example, 65.3 percent of immigrant households with children headed by a person with at least a high school education use at least one welfare program. This compares to 52.1 percent for native households with children headed by a person with the same level of education. This is a 13.2 percentage-point gap. The gap for those with some college is 10 percentage points and the gap for those with at least a college degree is 12 percentage points. Thus, even when we control for education, immigrant welfare use is still a good deal higher for the three educational categories above high school.
One way to compare the differences between immigrant and native households with children is to assume that households headed by immigrants have the same education level on average as those headed by natives, but retain their welfare use rates by education. In this way we can at least measure the impact of educational attainment by itself. If immigrant households with children had the same education level as those headed by natives (but retained their education-specific welfare use rates,) then 50.5 percent would access at least one welfare program. This is less than the 56.6 percent that actually do access these programs, but is still a good deal higher than the 38.7 percent for natives. Put more precisely, if the heads of immigrant households had the same educational attainment as native households, two-thirds of the gap with natives in welfare use would still remain. Thus, the lower education level of immigrant households only explains about one-third of the difference in welfare use for immigrant and native households with children. These results indicate that, while education does matter, other factors matter even more.
Tax Payments. The focus of this report is use of major welfare programs by households with children. However, the CPS also provides estimates of tax liability. Federal income tax liability is reported in Figure 4. The data show that 50 percent of immigrant households with children have no federal income tax liability, compared to 33 percent of native households with children.16 The Census Bureau bases tax liability on income, number of dependents, and other factors as reported in the CPS, but not legal status. It is simply an estimate of what would be paid if the law is followed — having tax liability does not necessarily mean the household actually paid any federal income tax. If we look at only those households with tax liability, it shows that the average for immigrant households with children was $11,666; for native households with children it was $12,347. This is not a huge difference, but it does mean that not only are immigrant households with children less likely to pay any federal income taxes, when they do pay such taxes their average payment is less than that of native-headed households. Welfare programs are primarily funded by the federal government through income tax contributions. High tax contributions would be one way immigrants could offset the high welfare use rates, but that appears not to be the case, at least for households with children.

The Earned Income Tax Credit. The Census Bureau calculates whether workers qualify for the Earned Income Tax Credit (EITC) based on income and number of dependents.17 Those without valid Social Security numbers (SSNs) are not eligible for the program, so illegal immigrants should not receive it, unless they are using a stolen or otherwise acquired SSN. Figure 4 does not directly measure use of the program. This is in contrast to the welfare programs reported earlier in this report, which are based on self-reporting in the CPS.
The EITC is the nation’s largest cash assistance program for low-income workers, particularly those with children. The total costs of the program will exceed $40 billion for 2010. Those receiving the EITC pay no federal income tax and instead receive a check from the federal government. The payment can be quite large. For example, in 2010 a family with three children earning $16,000 a year would receive a top payment of nearly $5,700. Figure 4 shows that a much larger share of immigrant-headed households with children are eligible for the EITC than are native-headed households.
The EITC can be seen as a welfare program, but we did not include it as such in this report. What is important to understand is that the low income of so many immigrants coupled with the presence of children means that a very large share of immigrant households qualify for this program based on income. It is important to point out that to receive the EITC one has to work. The high rate of EITC eligibility reported in Figure 4 for immigrant households with children reflects in part the very large share of immigrant households with at least one worker. So unwillingness to work is not the reason for the results in Figure 4. Although it may defy popular perception, low-income workers, particularly those with children, can create very large costs for taxpayers despite being employed.
Average Payments. In addition to receipt of welfare programs, the Current Population Survey provides a limited amount of information on how much each household or individual receives in services or payments for welfare programs. In most years, the food stamp program, TANF, SSI, and Medicaid are the only programs for which payment or cost information is provided. There is no information in the survey for the costs of providing free/reduced school lunch, WIC, rent subsidies, and public housing. Moreover, the 2010 data do not yet have any information on the size of the payments for food stamps or the cost of Medicaid, as these have to be calculated and added to the data by the Census Bureau after the survey is collected. At some point, the Census Bureau should add this information to the public-use file of the March 2010 CPS, but at the time of this analysis the information was not available.
Compared to under-reporting whether a welfare program is used, under-reporting of payment size seems to be even more pronounced in the CPS. For example, the total payout (not including administrative costs) under the food stamps program is roughly $39 billion, but the total value of food stamp use reported in the CPS (2009 data) is only about $23 billion. Similar problems exist in the data for cash payments received. Under-reporting of payments is partly due to the fact that the CPS is a survey by proxy. It seems that the individual filling out the CPS for the rest of the household is more likely to know if a program is being used than the actual size of the payment received.
It is still possible to look at average payments in the CPS data, but doing so means we have to ignore the substantial problems with the payment information. The 2010 CPS shows that the average payment received for immigrant households with children using a cash program is almost identical — $6,253 a year for immigrant households and $6,297 for natives. To find an average payment for food stamps and Medicaid, the 2009 CPS must be used. The 2009 data for food stamp payments show that for households with children using food stamps, the average payment is very similar for immigrants and natives — $3,250 and $3,275. For Medicaid, the 2009 estimated costs for immigrant-headed households with children using the program are significantly lower than for native-headed households with children — $6,303 and $7,404, respectively. This means that although immigrant households with children are more likely to have someone in the household using Medicaid, the average cost of the program is lower for immigrant households.18 No payment information is available in the CPS for free/reduced school lunch, WIC, rent subsidizes, or public housing.
Welfare Use by Country of Birth. Table 4 and Figure 5 report welfare use for households with children based on the country of birth of the household head. Table 4 also includes data for regions of the world. Both Table 4 and Figure 5 show very large differences in use rates. Immigrant households with children with the highest use rates are those from the Dominican Republic (82 percent), Mexico and Guatemala (75 percent), and Ecuador (70 percent). Those with the lowest use rates are from the United Kingdom (7 percent), India (19 percent), Canada (23 percent), and Korea (25 percent). These figures remind us that although the overall use rates for immigrant households with children are quite high, this is not the case for all immigrant-sending countries and regions.


Welfare Use by State. Table 5 reports welfare use by state. Two years of data (2009 and 2010) are averaged together in the table in order to provide more statistically robust estimates. Figure 6 shows overall welfare use for immigrant- and native-headed households with children by state. The states with the highest use rates are Arizona (62 percent); Texas, California, and New York (61 percent); Pennsylvania (59 percent); Minnesota (56 percent); Oregon (56 percent); and Colorado (55 percent). These states also tend to be the ones where the gap between immigrant and native welfare use tends to be the largest. In these same states, immigrant households with children have an average 24 percentage-point gap with their native-born counterparts. In fact, for almost every top immigrant-receiving state, Table 5 and Figure 6 show that use rates for immigrant households with children are much higher than use rates for natives.


Welfare Use by Legal Status. So far this report has examined welfare use for the entire foreign-born population. But it is possible to estimate welfare use for households based on the legal status of the household head. It is well established that illegal aliens do respond to government surveys such as the Current Population Survey. While the CPS does not ask the foreign-born if they are legal residents of the United States, the Urban Institute, the Department of Homeland Security (DHS), the former INS, the Pew Hispanic Center, and the Census Bureau have all used socio-demographic characteristics in the data to estimate the size of the illegal-alien population. We follow this same approach. Our best estimate is that the March 2010 CPS included 9 to 9.5 million illegal aliens.19 By design, this estimate is consistent with those prepared by the Department of Homeland Security and others.20 It must be remembered that this estimate only includes illegal aliens captured by the March CPS, not those missed by the survey. The Department of Homeland Security assumes an undercount of 10 percent in Census Bureau data.21
Table 6 reports welfare use based on the legal status of the household head. The estimates show that 51.8 percent of households with children headed by legal immigrants used at least one major welfare program in 2009. For households with children headed by an illegal immigrant, 71 percent are estimated to use at least one program. One important thing to note about these estimates is that immigrant households can only be placed into one of two categories — legal or illegal. This means that if the methodology for assigning legal status has resulted in an overestimation of welfare use for one category, it must be the case that it has underestimated welfare use for the other. To understand this, it may be helpful to remember that the welfare use rate for all immigrant-headed households with children of 56.6 percent represents the average for immigrant households headed by legal and illegal immigrants together. This means that anyone arguing that the welfare use rate in Table 6 is too high for one category, must also believe that the welfare use rate is too low for the other category.

Table 6 shows that the overall high welfare use rate for immigrant households with children is not simply due to legal status. Both legal and illegal immigrants tend to make use of the welfare system. Illegal immigrant households with children primarily use food assistance and Medicaid, making almost no use of cash and housing programs. In contrast, legal immigrant households with children tend to have relatively high use for every type of program. In addition to legal status, Table 6 also reports welfare use for different types of legal and illegal households. The Department of Homeland Security estimates that more than half of all illegal immigrants come from Mexico.22 The table shows that households with children headed by Mexican illegal immigrants tend to have somewhat higher welfare use rates than do illegal immigrant households with children from all countries. As for legal immigrants, Table 6 shows that the inclusion of refugee-sending countries in the data does not make much difference to overall welfare use rates for legal immigrant households with children. Use rates for households headed by legal immigrants from non-refugee-sending countries are very similar to those for legal immigrant households when refugees are included. Refugee-sending countries are a small share of the total and, as we have seen, their use rates are not different enough from non-refugees to impact the overall results in a meaningful way.
Less-Educated Legal Immigrants. One of the most important findings in Table 6 is the use rates for less-educated legal immigrant households. Less-educated is defined in the table as having no more than a high school education. As we saw in Table 3, welfare use varies significantly by the education level of the household head. Table 6 shows that households with children headed by a legal immigrant with no more than a high school education have extremely high overall welfare use rates — 71.8 percent. This is important because it shows that legal status is no guarantee of avoiding welfare use. The table also shows that households with children headed by legal immigrants from Mexico have a similarly high welfare use rate. This partly reflects the relatively lower education levels of legal Mexican immigrants. The high rate of welfare use by less-educated legal immigrant households with children indicates that legalizing illegal immigrants would likely increase their welfare use. While Table 6 shows that the overall use rate for any welfare program is very similar for less-educated legal and illegal immigrant households (71 percent vs. 71.8 percent), the rate for cash and housing programs is much higher for less-educated legal immigrants. For example, use of cash programs for illegal immigrant households with children is only about 1 percent, but for less-educated legal immigrants it is roughly 11 percent. Thus, use of cash programs can be expected to rise significantly with legalization. A similar situation exists for housing programs.
At present, the bar on illegal immigrants directly using welfare programs likely reduces their use of some programs, making some illegal immigrants reluctant to apply for welfare programs, even when their U.S.-born children are eligible. However, upon legalization some of this reluctance would almost certainly be reduced. Moreover, while the terms of any amnesty legislation will likely bar the newly legalized from directly accessing programs themselves for at least a few years after legalization, it can be expected that eventually the newly legalized will be eligible for more programs. Thus, legalization would likely increase welfare use. This is because a very large share of legalized illegal immigrants would, in effect, become less-educated legal immigrants. For 2010, we estimate that 80 percent of adult illegal immigrants have not completed high school or have only a high school education. Other research has found similar results.23 As Table 6 shows, less-educated legal immigrant households with children have extremely high rates of welfare use. And legalization would create a very large number of new less-educated legal immigrants.
It bears repeating that the figures in Table 6 are not the result of less-educated legal immigrants’ unwillingness to work. The overwhelming majority of all types of immigrant households with children have at least one worker. The results in Table 6 reflect in part the lower education level of many immigrants with children. There is no single better predictor of income in the modern American economy than education levels. Low incomes, coupled with the presence of children under age 18 are the reason for the results shown.
Illegal Immigrant Welfare Use by State. Table 7 averages two years of data to estimate welfare use for illegal, legal-, and native-headed households with children. Using two years of data at the state level provides more statistically robust estimates, particularly for small states. It should be noted that the national figures (at the bottom of Table 7) for illegal and legal immigrant households do not exactly match those in Table 6 because that table uses only one year of data, while Table 7 averages 2009 and 2010 together.

Overall, households with children headed by legal and illegal immigrants have higher use rates than their native-born counterparts in most states. However illegal immigrants across the county tend to have very low use rates for cash assistance programs. On the other hand, households with children headed by illegal immigrants tend to have much higher use rates for food assistance and Medicaid than natives. For legal immigrant households, use of cash assistance is more varied, but in general it tends to be higher than for natives. Use of food assistance and Medicaid for legal immigrant households tends to be significantly higher than for natives in almost every state.
The variations across states in welfare use in part reflect differences in welfare eligibility at the state level, as well as differences in the characteristics of the immigrant populations by state. In addition to the impact on public coffers, variations in immigrant welfare use from state to state likely have significant political implications. In states like Arizona where immigrant use of welfare is typically much higher than for natives, immigration is likely to be a much more salient political issue than in a state like Virginia where immigrant welfare use tends to be similar to that of the native-born.
Policy Implications
Throughout this report we have compared immigrant households with children to native households with children. But it is not at all clear that native use of welfare is the proper yardstick by which to measure immigrants. It can be reasonably argued that because immigration is supposed to benefit the United States, our admission criteria should, with the exception of refugees, select only those immigrants who are self-sufficient. In this view, immigrant welfare use should be dramatically lower than that of natives for every program. Of course, this is not the case.
Barring Immigrants from Welfare. In terms of policy, we can say that efforts to reduce welfare use associated with immigrants are not likely to be successful when it comes to non-cash programs, particularly food assistance programs and Medicaid. The 1996 reform of the welfare system barred most new legal immigrants from using many welfare programs for the first five years. Moreover, illegal immigrants were already barred from using welfare programs. But this has not prevented a large share of immigrant households from accessing welfare programs for a number of reasons: First, most legal immigrants have been in the United States for more than five years. Second, the ban only applies to some programs. Third, some state governments provide welfare to new immigrants with their own money. Fourth, by becoming citizens immigrants are eligible for all welfare programs. Fifth, and perhaps most important, the U.S.-born children of immigrants (including those born to illegal immigrants) are automatically awarded American citizenship and are therefore eligible for all welfare programs at birth. If we wish to reduce welfare use for immigrants and their young children, then we would need to select immigrants in the future who are less likely to need the assistance of such programs. Trying to bar them from using programs after they have arrived is not likely to work.
Selecting immigrants based on their education levels would seem to be one of the easiest ways to reduce immigrant welfare use in the future. In 2009, 80.4 percent of households with children headed by an immigrant who had not graduated high school accessed at least one welfare program. The corresponding figure for households headed by immigrants with a bachelor’s degree was 25.4 percent. While education level is not the only predictor of welfare use, limiting non-refugee admission to, say, those with a bachelor’s degree is an administratively feasible way of reducing welfare use among future immigrants. But it must be remembered that there are many competing goals when it comes to U.S. immigration policy. The potential cost to taxpayers due to the use of welfare programs is only one of many issues to consider when setting legal immigration policy. Such factors as a desire to admit the relatives of U.S.-citizens, humanitarian considerations, or honoring America’s history as an immigrant-receiving nation may, in the view of some, take precedence over concerns about welfare use.
Illegal Immigrants. If welfare costs are to be avoided for illegal immigrants, then enforcement of the law and encouraging them to return to their home countries would make the most sense. Given the low educational attainment of so many illegal immigrants, allowing them to stay in the country means that welfare costs will remain high as well. Legalizing illegal immigrants would likely be the most costly policy option. Research indicates that half or more of illegal immigrants have not graduated high school and another 25 to 30 percent have only a high school education. Less-educated immigrants in the country legally have very high welfare use rates. Since legalization would in effect create millions of new less-educated legal immigrants, it seems clear that use of welfare programs would rise accordingly.
Of course, any amnesty would likely be accompanied by some restrictions on welfare for amnesty beneficiaries. However, these restrictions would almost certainly be limited in time; moreover they would not apply once a legalized immigrant becomes a citizen. Most importantly, any limitation on welfare use would have no impact on the eligibility of immigrants’ U.S.-born children. As we have seen, the presence of U.S.-born children has enormous implications for welfare use among immigrant households. Those that support legalization have to at least acknowledge the low education levels of illegal immigrants and what it means for use of the welfare system.
Conclusion
This report has followed the standard practice of examining welfare use by household, focusing on Medicaid, cash, food, and housing programs. The findings show that a large share of immigrant households with children access at least one major welfare program. Based on data collected in 2010, which asked about use of welfare in the prior calendar year, 57 percent of households headed by an immigrant (legal or illegal) with children (under age 18) used at least one welfare program, compared to 39 percent for native households with children. Immigrant use of welfare by household tends to be much higher than natives for food assistance programs and Medicaid. Use of cash and housing programs tends to be very similar to native use. A large share of the welfare used by immigrant households is received on behalf of U.S.-born children, who are American citizens. But even households with children comprised entirely of immigrants (no U.S.-born children) still had a welfare use rate of 56 percent in 2009. Thus the presence of U.S.-born children does not entirely explain the high overall use rate associated with immigrants.
The vast majority (95.1 percent) of immigrant households with children had at least one worker in 2009. In fact, immigrant households with children are slightly more likely to have at least one worker than native-headed households with children (93.3 percent). But the relatively low education level of a large share of immigrants means that more than half of working immigrant households with children still accessed at least one major welfare program in 2009. Of immigrant households with children, 31.9 percent are headed by an immigrant who has not completed high school. In contrast, 8.9 percent of native-headed households with children are headed by high school dropouts. This very large difference in education levels is an important reason for the findings.
One way to describe what happens in regard to welfare is to recognize that most immigrants come to America to work, and most find jobs. However, many of those who have children earn very low wages because of their education levels. As a result, many immigrants with children qualify for welfare programs, primarily food assistance and Medicaid. Put a different way, the nation’s welfare system is designed in part to assist low-income workers with children. A very large share of immigrants who have entered the country both legally and illegally are low-income workers with children. This has a predictable impact on the nation’s welfare system.
Based on socio-demographic characteristics, we estimate that 51.8 percent of households with children headed by a legal immigrant used at least one welfare program in 2009, compared to 71 percent for illegal immigrant households. Illegal immigrants generally receive benefits on behalf of their U.S.-born children. Illegal immigrant households primarily use only food assistance and Medicaid, making almost no use of cash and housing assistance. In contrast, legal immigrant households tend to have relatively high use rates for every type of program. The relatively high overall welfare use rates for both legal and illegal immigrants with children indicates that the inclusion of illegal immigrants in government data does not explain the high overall welfare use rate of immigrants. Rather, both legal and illegal immigrant households with children have high overall welfare use rates.
The issue of immigrant use of means-tested programs is not likely to go away anytime soon. The discussion of what to do about this problem should be conducted with the recognition of its complexity. On the one hand, it is not enough to say that welfare use by immigrants is not a problem because illegal immigrants and newly arrived legal immigrants are barred from using most welfare. While advocates of expansive immigration often make this argument, it does not reflect the way the welfare system actually works. Moreover, it is not enough to point out that most immigrants work. Work and welfare often go together as our welfare system, particularly non-cash programs, is specifically designed to help low-income workers with children. On the other hand, it is a mistake to see high use of non-cash welfare programs by immigrant households as some kind of moral defect. It is also a mistake to compare today’s immigrants with those that arrived 100 years ago during the prior great wave of immigration. Welfare simply did not exist in the same way in 1910. Thus prior immigration is not relevant to the issue of current welfare use.
When thinking about this issue, it makes more sense to acknowledge that spending on welfare programs is a part of every advanced industrial democracy, including ours. Moreover, we have to recognize that less-educated workers will earn modest wages in the modern American economy. Therefore, our immigration policies simply need to reflect these realities.
End Notes
1 While administrative data exist for use of welfare programs, information on whether welfare recipients are immigrants or native-born is generally not part of the administrative record. The CPS, on the other hand, not only provides information about welfare use for immigrants and natives, it also provides a host of other socio-demographic information. For this reason the survey is one of the best sources for comparing immigrants to natives.
2 See the Heritage Foundation analysis of welfare spending in Appendix C of “Obama to Spend $10.3 Trillion on Welfare: Uncovering the Full Cost of Means-Tested Welfare or Aid to the Poor,” at http://www.heritage.org/Research/Reports/2009/09/Obama-to-Spend-103-Tril....
3 See Table 2 in “Estimates of the Unauthorized Immigrant Population Residing in the United States: January 2009,” at http://www.dhs.gov/xlibrary/assets/statistics/publications/ois_ill_pe_20.... DHS uses the American Community Survey for its estimate of illegal immigrants. Like the Current Population Survey used in this report, the American Community Survey is collected by the Census Bureau and weighted in a similar fashion so the results of both surveys are similar. In their estimates of the illegal population the Pew Hispanic Center uses the Current Population Survey and assumes the same level of undercount as the government.
4 Because of the way the CPS collects data, the SCHIP Program (State Supplemental Health Insurance Program) is included with Medicaid. Also, the total for TANF includes a small number of individuals who received state-sponsored general assistance programs, and two additional smaller programs for low-income veterans and Native Americans.
5 James P. Smith and Barry Edmonston, eds., The New Americans: Economic, Demographic, and Fiscal Effects of Immigration, National Research Council report, 1997, pp. 255-256.
6 “State and Local Fiscal Impacts of New Jersey,” in Keys to Successful Immigration: Implications of the New Jersey Experience, Thomas J. Espenshade, ed., Washington, DC: Urban Institute Press, p. 143.
7 George J. Borjas and Lynette Hilton, “Immigration and the Welfare State: Immigrant Participation in Means-Tested Entitlement Programs,” Quarterly Journal of Economics, May 1996.
8 The Census Bureau reports welfare use by household based on the nativity of the household head. See, for example, Figures 20-1, 20-2 and 21-3 in “Profile of the Foreign-Born Population: 2000,” pp. 23-206, U.S. Census Bureau, December 2001. http://www.census.gov/prod/2002pubs/p23-206.pdf.
9 Robert Rector , Christine Kim and Shanea Watkins, The Fiscal Cost of Low-Skill Households to the U.S. Taxpayer, Washington, DC: The Heritage Foundation, 2007.
10 See Appendix F in Measuring the Effect of Benefits and Taxes on Income and Poverty: 1992, U.S. Census Bureau, for a discussion of under-reporting of income and receipt of redistribution programs.
11 In 2009 62.9 million individuals enrolled in the program at some point. However, the CPS shows 47.8 million — a 15.1 million difference. Some of this difference is because the CPS does not include people in institutions such as nursing homes, which likely accounts for several million of the difference. The fact remains that the CPS significantly undercounts this program. See p. iv from the “2010 Actuarial Report on the Financial Outlook for Medicaid,” Centers for Medicare & Medicaid Services, at http://www.cms.gov/ActuarialStudies/downloads/MedicaidReport2010.pdf.
12 Steven A. Camarota, “Assessing the Accuracy of Data on the Foreign-Born from The American Community Survey: Task 4.,” February 2001. This report was prepared for the Census Bureau under contract and has not yet been released to the public. The report details results of extensive focus groups with Census Bureau employees who conduct survey interviews, almost all of whom worked on the CPS as well as the American Community Survey. The interviewer felt strongly that the foreign-born were not more reluctant to provide information about welfare use.
13 See “Refugees and the U.S. Child Welfare System: Background Information for Service Providers,” United States Conference of Catholic Bishops, Migration and Refugee Services, 2006, at http://www.brycs.org/publications/upload/CWToolkit.pdf.
14 The countries that have sent the most refugees and can be identified in the CPS are Afghanistan, Albania, Cambodia, Cuba, Eritrea, Ethiopia, Iraq, Laos, Liberia, Nicaragua, Sierra Leone, Somalia, Sudan, and Vietnam plus the countries of the former Yugoslavia and USSR.
15 The public-use file of the CPS groups the responses to the year of arrival question in multiple year cohorts. This is done by the Census Bureau in order to preserve the anonymity of respondents. The results shown in Figure 4 are the most detailed possible from the public-use file.
16 Tax liability comes from the 2009 CPS because this information had not yet been released with the public-use file of the March 2010 CPS at of the time of this analysis.
17 EITC eligibility comes from the 2009 CPS because this information had not yet been released with the public-use file of the March 2010 CPS at of the time of this analysis.
18 In immigrant households it is more likely that just the children are accessing the program. In contrast, for native households with children, both adults and children are accessing the program.
19 To distinguish legal from illegal immigrants in the survey, this report uses citizenship status, year of arrival in the United States, age, country of birth, educational attainment, sex, receipt of welfare programs, receipt of Social Security, veteran status, and marital status. We use these variables to assign probabilities to each respondent. Those individuals who have a cumulative probability of 1 or higher are assumed to be illegal aliens. The probabilities are assigned so that both the total number of illegal aliens and the characteristics of the illegal population closely match other research in the field, particularly the estimates developed by the Department of Homeland Security/legacy INS, the Urban Institute, and the Pew Hispanic Center. This method is based on some very well established facts about the characteristics of the illegal population. For example, it is well known that illegal aliens are disproportionately young, male, unmarried, under age 40, have few years of schooling, etc. Thus, we assign probabilities to these and other factors in order to select the likely illegal population. In some cases, we assume that there is no probability that an individual is an illegal alien, such as a person who indicates that he or she is receiving Social Security payments or is a U.S. veteran. The total estimate of the illegal population in the CPS is a residual analysis that uses administrative data to estimate the size and characteristics of the legal immigrant population and then subtracts those individuals from the foreign-born population in the survey. We use estimates developed by the DHS Office of Immigration Statistics as a basis for creating the residential analysis for legal permanent residents (LPR). The most recent estimates for LPRs can be found at “Estimates of the Legal Permanent Resident Population in 2009,” http://www.dhs.gov/xlibrary/assets/statistics/publications/lpr_pe_2009.pdf.
20 See the Department of Homeland Security estimate of 10.8 million illegal immigrants in January 2009 at http://www.dhs.gov/xlibrary/assets/statistics/publications/ois_ill_pe_20.... DHS’s estimate includes an adjustment for those missed in Census Bureau data. The Pew Hispanic Center has estimated a populations of 11.2 million illegal immigrants as of March 2010 based on the CPS. Pew’s estimate also includes an adjustment for those missed by the survey. The Pew report can be found at http://pewhispanic.org/reports/report.php?ReportID=133. The Urban Institute has also made estimates by legal status. Urban estimates that, in March 2002, 8.3 million illegal aliens were counted in the CPS, with an additional one million being missed. See Urban’s estimates based on the March 2002 CPS at Older studies by the INS and Census Bureau are also available. The INS report that found seven million illegal aliens in 2000 and an annual increase of about 500,000 can be found at www.immigration.gov/graphics/aboutus/statistics/Ill_Report_1211.pdf. The Census Bureau estimate of eight million illegal immigrants in 2000 can be found at www.census.gov/dmd/www/ReportRec2.htm (Appendix A of Report 1 contains the estimates).
21 See p. 3, Table 2, in the DHS estimates of the illegal immigrant population for January 1, 2009, at http://www.dhs.gov/xlibrary/assets/statistics/publications/ois_ill_pe_20....
22 See p. 7 of their estimates for January 1, 2009, at ttp://www.dhs.gov/xlibrary/assets/statistics/publications/ois_ill_pe_2009.pdf.
23 Figure 16 (p. 11) of the April 14, 2009, Pew Hispanic Center report shows 78 percent of illegal immigrants have no more than a high school education. See http://pewhispanic.org/files/reports/107.pdf.