Download a PDF of this Backgrounder
Steven A. Camarota is the Director of Research and Karen Zeigler is a demographer at the Center for Immigration Studies.

The Census Bureau recently released some of the data from the 2013 American Community Survey (ACS). The data show that the nation’s immigrant population (legal and illegal) grew by 1.4 million from July 2010 to July 2013. The data also imply that 3.3 million new immigrants settled in the country in that same period.1 These new arrivals were offset by return migration and deaths among the existing population. The immigrant population, referred to as the foreign-born by the Census Bureau, includes all those who were not U.S. citizens at birth, including illegal immigrants.
Among the findings from the new data:
- The nation’s immigrant population (legal and illegal) hit a record 41.3 million in July 2013, an increase of 1.4 million since July 2010. Since 2000 the immigrant population is up 10.2 million.
- The 41.3 million immigrant population (legal and illegal) in 2013 was double the number in 1990, nearly triple the number in 1980, and quadruple that in 1970, when it stood at 9.6 million.
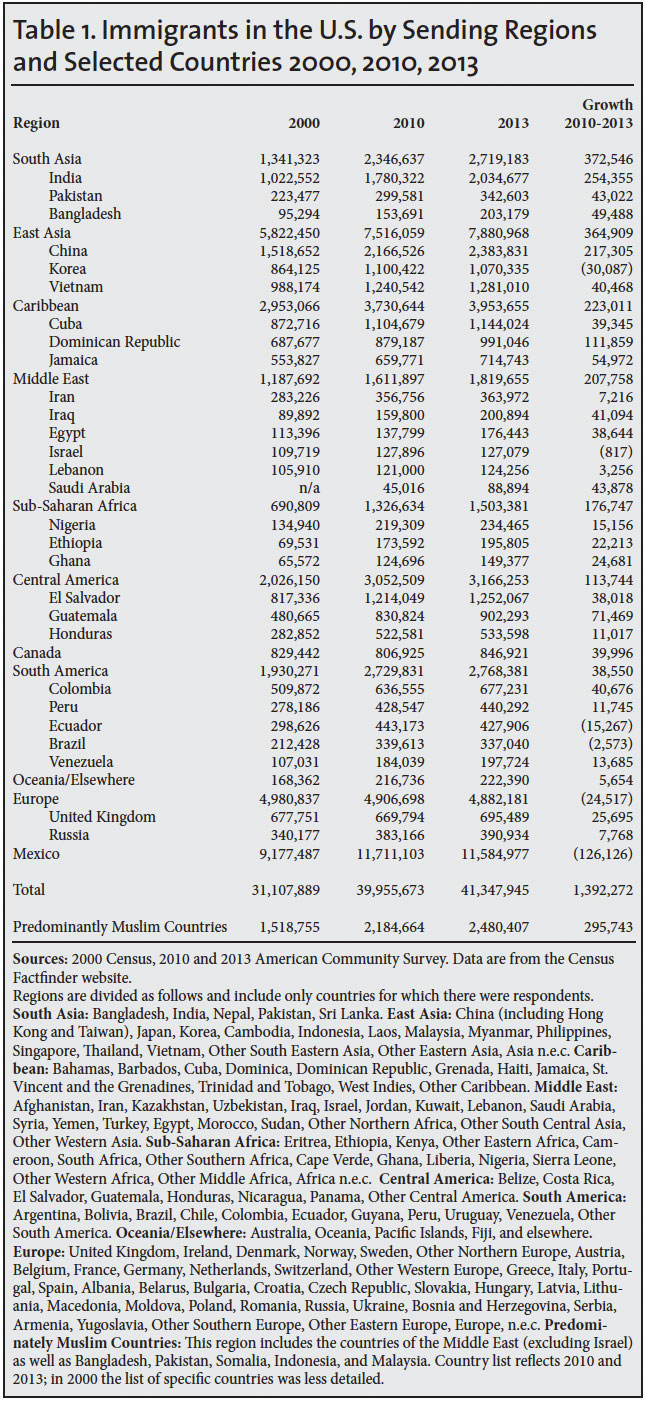
- The sending regions with the largest increases from 2010 to 2013 were South Asia (up 373,000, 16 percent growth); East Asia (up 365,000, 5 percent growth); the Caribbean (up 223,000, 6 percent growth), the Middle East (up 208,000, 13 percent growth); and sub-Saharan Africa (up 177,000, 13 percent growth).
- The sending countries with the largest increases 2010 to 2013 were India (up 254,000, 14 percent growth); China (up 217,000, 10 percent growth); the Dominican Republic (up 112,000, 13 percent growth); Guatemala (up 71,000, 9 percent growth); Jamaica (up 55,000, 8 percent growth); Bangladesh (up 49,000, 32 percent growth); Saudi Arabia (up 44,000, 97 percent growth); Pakistan (up 43,000, 14 percent growth); and Iraq (up 41,000, 26 percent growth).
- Between 2010 and 2013, four million new immigrants settled in the United States; and since 2007, when the Great Recession began, at least 7.5 million immigrants have settled in the country.2
- As a share of the population, immigrants (legal and illegal) comprised 13.1 percent of U.S. residents (about one out of every eight), the highest percentage in 93 years. As recently as 1980, 6.2 percent of the country was comprised of immigrants.
- Immigrants comprised 16 percent of the adult population (18-plus) in 2013, nearly one out of every six adults.
- Mexicans accounted for the largest immigrant population in the United States by far, with 11.6 million legal and illegal immigrants living in the United States in 2013. However, the number of Mexican immigrants in the country declined 1 percent from 2010 to 2013.
- The number of immigrants from Europe also declined.
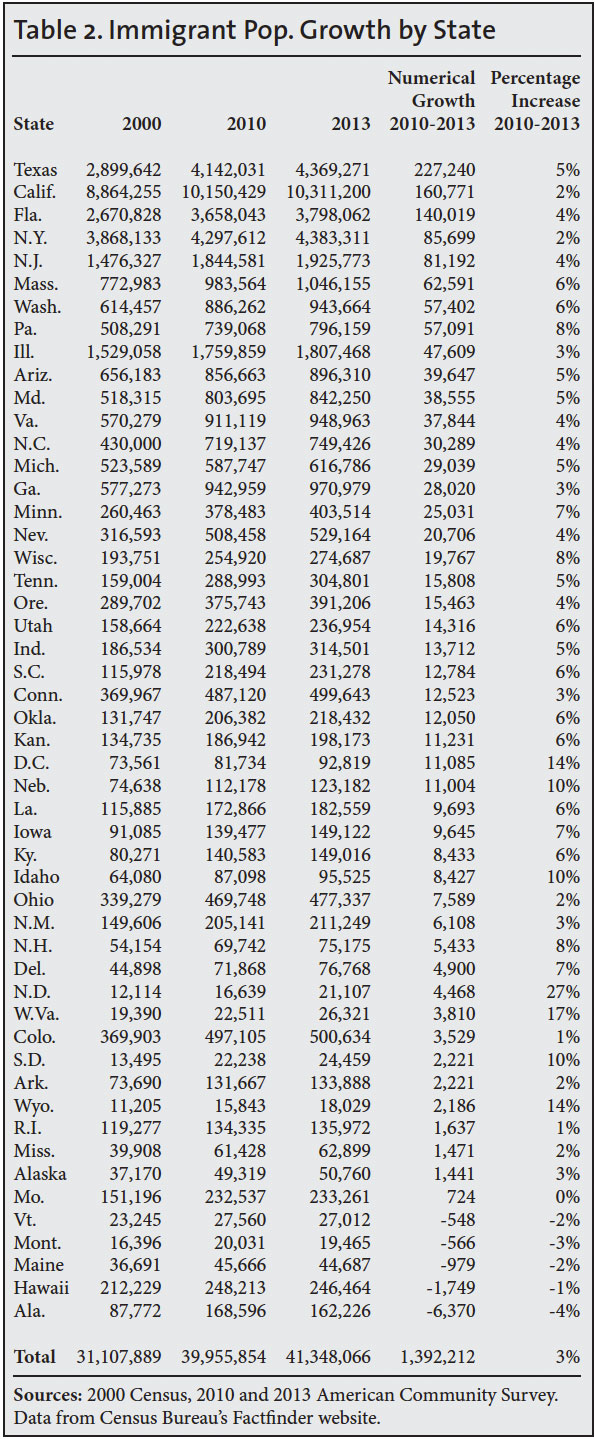
- States where the number of immigrants grew the most since 2010 were Texas (up 227,240); California (up 160,771); Florida (up 140,019); New York (up 85,699); New Jersey (up 81,192); Massachusetts (up 62,591); Washington (up 57,402); Pennsylvania (up 57,091); Illinois (up 47,609); Arizona (up 39,647); Maryland (up 38,555); Virginia (up 37,844); North Carolina (up 30,289); Michigan (up 29,039); and Georgia (up 28,020).
- States with the largest percentage increase since 2010 were North Dakota (up 27 percent); West Virginia (up 17 percent); and Wyoming (up 14 percent). In South Dakota, Nebraska, and Idaho the immigrant population increased 10 percent. It grew 8 percent in New Hampshire, Wisconsin, and Pennsylvania and 7 percent in Iowa, Delaware, and Minnesota.
Data Source
On September 18, the Census Bureau released some of the data from the 2013 American Community Survey (ACS). The survey reflects the U.S. population as of July 1, 2013. The ACS is by far the largest survey taken by the federal government each year and includes over two million households.3 The Census Bureau has posted some of the results from the ACS to American FactFinder.4 It has not released the public-use version of the ACS for researchers to download and analyze. However a good deal of information can be found at FactFinder. Unless otherwise indicated, the information in this analysis comes directly from FactFinder.
The immigrant population, referred to as the foreign-born by the Census Bureau, is comprised of those individuals who were not U.S. citizens at birth. It includes naturalized citizens, legal permanent residents (green card holders), temporary workers, and foreign students. It does not include those born to immigrants in the United States, including to illegal immigrant parents, nor does it include those born in outlying U.S. territories such as Puerto Rico. Prior research by the Department of Homeland Security and others indicates that some 90 percent of illegal immigrants respond to the ACS.5 Thus, all the figures reported above are for both legal and illegal immigrants.
End Notes
1 The 3.3 million arrivals number is necessarily an estimate because the growth number of 1.4 million measures July 2010 to July 2013. The arrival data in Factfinder, on the other hand, shows four million arrivals for January 2010 to July 2013. This is the only level of detail available in Factfinder for year of arrival. However, the 2010 public-use ACS is available and shows 700,000 immigrants in the country who arrived in the first half of 2010. Subtracting that from the four million implies that 3.3 million new immigrants arrived July 2010 to July 2013, the period in which the immigrant population grew 1.4 million.
2 The 2013 ACS shows four million immigrants living in the United States in July 2013 who indicated that they arrived in the United States in 2010 or later. (Unlike the public-use data, FactFinder does not report immigrants’ detailed years of arrival. Instead, results are grouped by decade.) The 2010 public-use file of the ACS showed 3.5 million immigrants in the country who arrived in 2007, 2008, or 2009. (We exclude those who indicated they came between January and July 2010.) Therefore, in total 7.5 million immigrants arrived 2007 to 2013. The actual total is higher because the 7.5 million figure does not include those who arrived after 2007, but died or went home by 2013.
3 Detailed information on the survey methodology, questions, and other information on the American Community can be found here.
4 FactFinder can be found here.
5 The Department of Homeland Security uses the ACS as the basis for its estimates of the illegal immigrant population. See the most recent iteration of the unauthorized immigrant population, “Estimates of the Unauthorized Immigrant Population Residing in the United States: January 2012”.