Download a PDF of this Backgrounder
Steven A. Camarota is the Director of Research and Karen Zeigler is a demographer at the Center for Immigration Studies.
In June 2013, former Florida Governor Jeb Bush said "Immigrants are more fertile." He and many others have argued for large-scale immigration on the grounds that America's aging society needs immigrants and their higher fertility to, in Bush's words, "rebuild the demographic pyramid." However, demographers have generally found that, although immigration can significantly increase the overall size of a nation's population, its impact on slowing the aging of American society is very limited. To the extent that immigration does impact aging, it is partly due to immigrants' higher fertility. However, immigrant fertility has declined significantly since its peak in 2008. As result, immigration's small impact on aging is becoming even smaller.
- The birth rate for women in their reproductive years (ages 15 to 50) declined more than twice as much for immigrants as natives between 2008 and 2013.
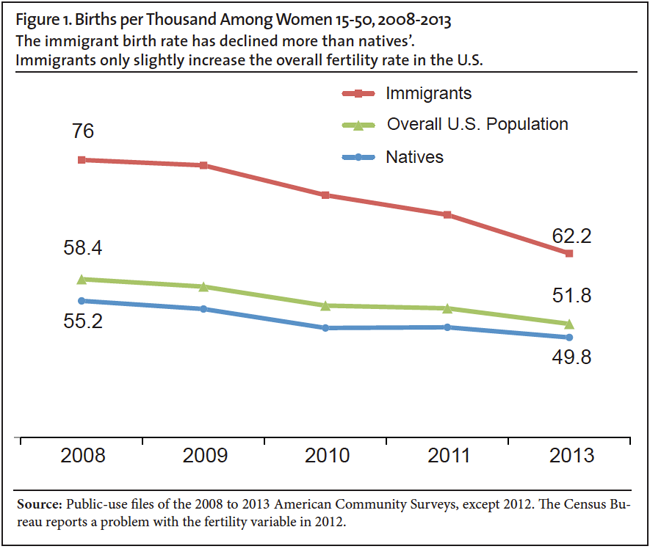
- The birth rate for immigrant women of reproductive age declined from 76 to 62 births per thousand from 2008 to 2013 — a decline of 14 births per thousand. In contrast, native fertility declined from 55 births per thousand to 50 births per thousand — a decline of five births per thousand.
- Although still higher than that of natives, immigrant fertility has only a small impact on the nation's overall birth rate. The presence of immigrants raises the birth rate for all women in their reproductive years by just two births per thousand (4 percent).
- Immigration has a small impact because the difference between immigrant and native fertility is too small to significantly change the nation's overall birth rate.
- Even if the number of immigrant women 15 to 50 doubled along with births to this population, it would still only raise the nation's overall birth rate by 3 percent.1
- In addition to births per thousand, fertility is often measured using the total fertility rate (TFR). The TFR reports the number of children a woman can be expected to have in her lifetime based on current patterns.
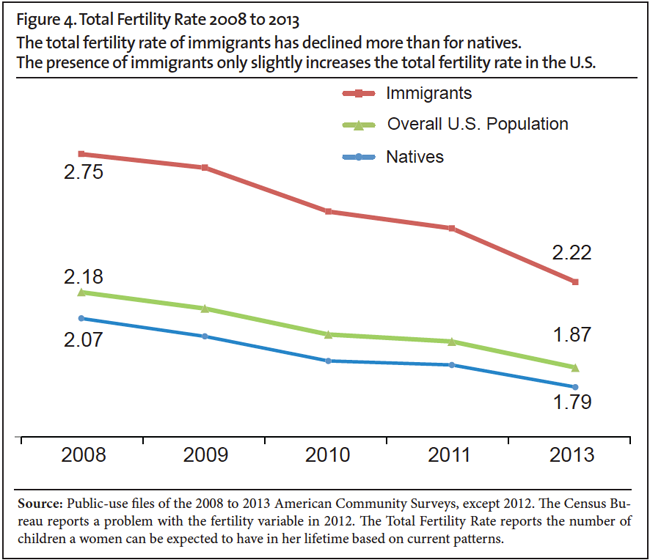
- Like the birth rate, the TFR of immigrants has declined more rapidly than the TFR for natives since 2008. In 2008, immigrant women had a TFR of 2.75 children; by 2013 it had fallen to 2.22 — a .53 child decline. For natives it declined from 2.07 to 1.79 — a .28 child decline.
- Like births per thousand, the presence of immigrants in the country has only a small impact on the nation's overall TFR. In 2013, im¬migrants only increased the nation's overall TFR by .08 children (4 percent).
- If present trends continue, the TFR of immigrants may drop below 2.1 in the next few years, the level necessary to replace the existing population. An immigrant TFR of less than 2.1 would mean that, in the long run, immigration would add to the aging of American society.
- Although immigration has only a small impact on overall fertility and aging, it has a significant impact on population size. For example, new immigrants and births to immigrants between 2000 and 2013 added 26.2 million people to the country — equal to 77 percent of U.S. population growth over this time period.
Discussion
There is no question that America is aging. Many advocates of immigration like Jeb Bush argue that immigrants can fundamentally change this fact, partly because of their higher fertility. It is true that immigrants have more children on average than natives. But the impact on the nation's overall fertility rate is quite modest no matter how fertility is measured. Therefore it would be incorrect to argue that the fertility of immigrants "rebuilds the demographic pyramid." Further, immigrant fertility is falling, so the impact of immigration on aging is falling as well.
Demographers, the people who study human populations, have long known that immigration has only a small impact on the aging of low-fertility countries like the United States. In an important 1992 article in Demography, the leading academic journal in the field, economist Carl Schmertmann, explained that, mathematically, "constant inflows of immigrants, even at relatively young ages, do not necessarily rejuvenate low-fertility populations. In fact, immigration may even contribute to population aging."2 The Census Bureau also concluded in projections done in 2000 that immigration is a "highly inefficient" means for increasing the percentage of the population that is of working-age in the long run.3 In a detailed paper presented at the annual meeting of the Population Association of American in 2012, Stephen Tordella and several coauthors showed that immigration has only a small impact on aging, but a large impact on the size of the U.S. population.4
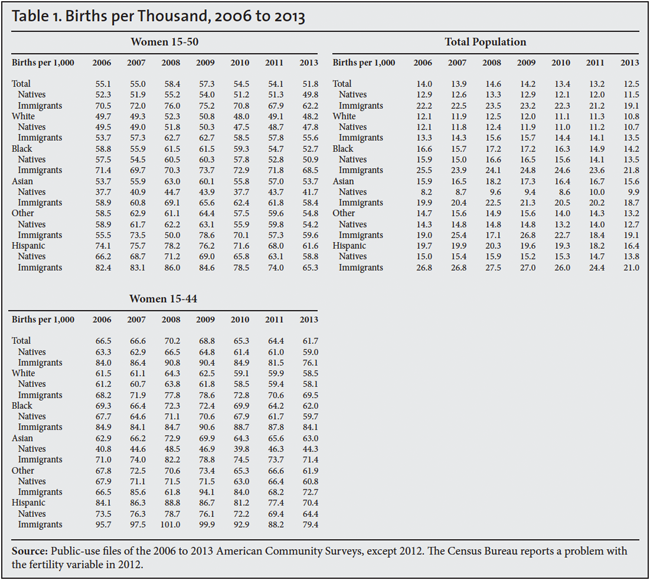
Births per Thousand, Ages 15-50. This analysis uses the public-use files of the 2006 to 2013 American Community Surveys (ACS) to measure fertility among immigrants and the native-born. Figures 1 through 3 report births per thousand for immigrants, natives, and the total population. (Table 1 reports more detailed information for birth rates.) Figure 1 reports births per thousand for women 15 to 50. More typically, demographers have examined fertility for women 15 to 44 and we do so in the next section of this report. However, we follow the Census Bureau's example in its recent analysis of the ACS report on births for women 15 to 50 in Figure 1.5 Doing so provides a more complete picture of fertility in modern America, as there are a significant number of births to women over age 44 — nearly 59,000 in 2013.
Figure 1 shows that the birth rate for immigrant women 15 to 50 has declined more significantly than the rate for natives. The birth rate for all immigrant women (15 to 50) declined by 13.8 births (18.2 percent) from 2008 to 2013, while the birth rate declined by 5.4 births (9.8 percent) for native women. We can also calculate immigration's impact on the overall birth rate for women 15 to 50 simply by comparing births per thousand for the entire population, which was 51.8 in 2013, to the rate for natives, which was 49.8. Thus the presence of immigrants in the United States increased the overall birth rate by just two births per thousand (4 percent). Because immigrant fertility has declined more steeply than native fertility, the impact of immigrants on the nation's fertility has also declined. In 2008, the presence of immigrants increased fertility for all women (15 to 50) by 3.2 births per thousand or 5.8 percent. So what had been a small impact has become even smaller.6 As for different groups of immigrants, the largest declines have been for Hispanics. Among natives, Hispanics have also experienced the biggest decline. (See Table 2).
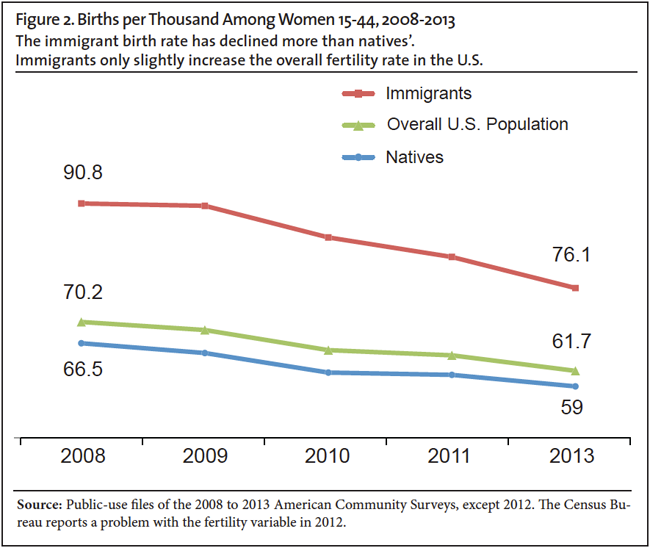
Births per Thousand, Ages 15-44. Figure 2 reports births per thousand for women 15 to 44. The results are very similar to those shown in Figure 1, though the rates for both immigrants and natives are higher than in Figure 1, reflecting the exclusion of women over age 44, who have the lowest fertility rates. As in Figure 1, immigrant fertility declined more than native fertility. Figure 2 also shows that the immigrant birth rate is higher than the rate for natives, but that immigrants only slightly raise the overall fertility rate for women 15 to 44. In 2013, the fertility of all women (immigrant and native) in the United States in this age group was 61.7 births per thousand. If immigrants are not counted, the rate would be 59 births per thousand — the rate for natives. Thus immigrants increased the fertility of all women in the United States (15 to 44) by only 2.7 births per thousand (4.6 percent) in 2013.
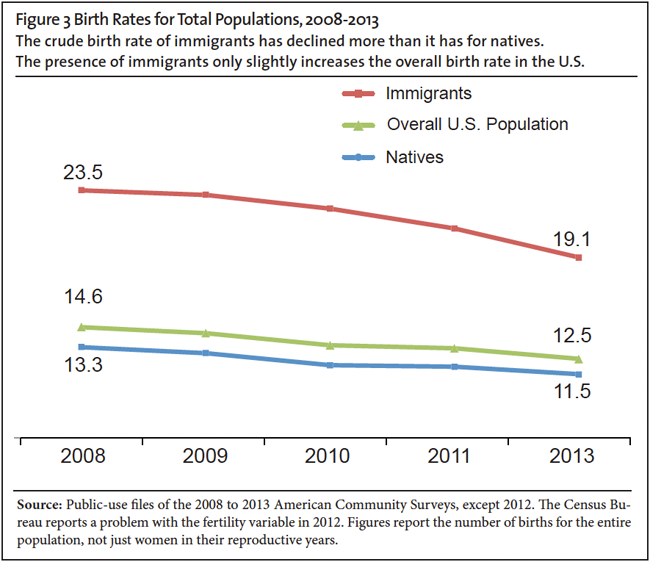
Births per Thousand for the Entire Population. While birth rates are often reported for women in their reproductive years, it is also possible to report births relative to the entire population. This is often referred to as the crude birth rate. This is expressed as births per thousand relative to the country's total population or for a sub-population. This measure of fertility tends to show a larger impact on the nation's fertility from immigration than looking at women in their reproductive years because the crude birth rate reflects both the higher fertility of immigrants and the larger share in their reproductive years compared to natives. Figure 3 shows, however, that even when the nation's fertility is measured as a crude birth rate, the impact of immigration remains small. The rate for the nation as whole is 12.5 births per thousand. Without immigrants it would be 11.5 births per thousand — the rate for natives. The one birth per thousand immigration added to the crude birth rate means that the 41.3 million immigrants in the country in 2013 increased fertility by just 8.7 percent.
Like Figures 1 and 2, Figure 3 also indicates that the fertility of immigrants is falling faster than that of natives. Between 2008 and 2013, the fertility of natives fell by 1.8 births per thousand, compared to 4.4 for immigrants. The decline in fertility for immigrants means their impact on the overall fertility rate of the nation has also become smaller. In 2008, immigrants increased the nation's overall crude birth rate by 9.8 percent, compared to 8.7 percent in 2013.
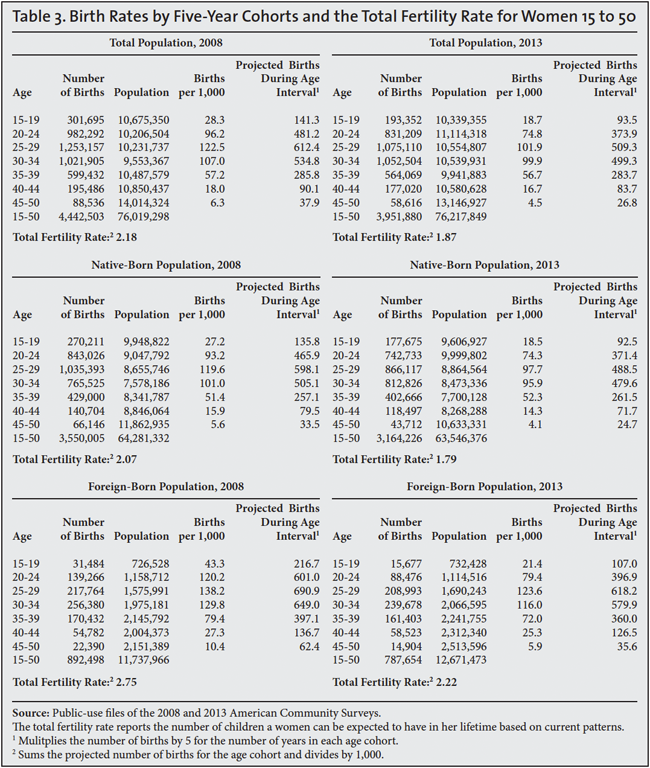
Total Fertility Rate. In addition to births per thousand, demographers often use the total fertility rate (TFR) to measure fertility. The Census Bureau defines TFR as "the average number of children that would be born per woman if all women lived to the end of their childbearing years and bore children according to a given set of age-specific fertility rates."7 One way to think about the TFR is that it assumes that when women who are currently 20 to 24 age into the 25 to 29 age group, they will have the same fertility as women in that age group do today. In other words, the TFR uses current fertility rates by age to estimate the fertility of today's women during their lifetime. (Table 3 at the end of this report shows the calculations used to generate a TFR).
The assumption that younger women will have the same fertility as the current cohort of older women may, of course, turn out to be wrong. But the primary reason the TFR is used so often in population studies is that it provides a shorthand way of looking at the fertility of all women in their reproductive year now and a way to attempt to predict future fertility. As a general rule it can be said that a TFR of less than 2.1 children per women means that, in the long run, putting aside people entering or leaving a country, the population will not replace itself and must eventually begin to fall.8 To be sure, a smaller population and a less densely settled country may be a desirable situation, especially given concerns about congestion, preservation of open spaces, and the environment.
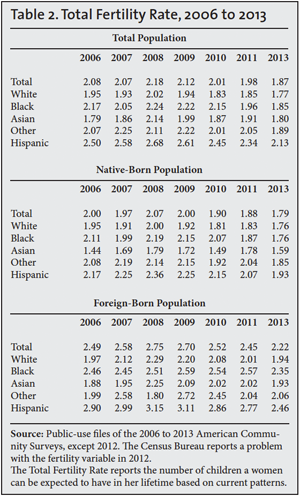
Figure 4 reports the TFR of immigrants and natives. Like birth rates, the TFR for immigrants has declined more rapidly than the TFR for natives since 2008. In 2008, the TFR was 2.75 children, by 2013 it had fallen to 2.22 children — a .53 child decline. For natives it declined from 2.07 to 1.79 — a .28 child decline. Just as immigrants have a small impact on birth rates, immigrants have only a small impact on the nation's overall TFR. In 2013, immigrants only increased the nation's overall TFR by .08 children (4.49 percent). If present trends continue, the TFR of immigrants may drop below the 2.1 replacement rate in the next few years. If that happens it would mean that, in the long run, the arrival of immigrants would contribute to the aging of American society as it will be adding people who do not replace themselves. Among both immigrants and natives the largest fall in TFR was among Hispanics (See Table 2).
A Changing Age Profile. Could the well documented fall-off in new immigration in recent years have reduced the number of immigrants in their primary reproductive years as fewer young immigrants arrived and those already in the country aged? This might explain the decline in immigrant fertility relative to natives. Table 3 reports births for immigrants and natives in 2008 and 2013 by five-year age groups and the resulting TFRs. The table shows that birth rates for both immigrant and na¬tive women fell significantly for almost every age group, particularly those under age 30.9 Equally important, the birth rate for immigrants declined more than for natives for every five-year age group between 15 and 50, except those 25 to 29. Therefore, the decline in fertility for both groups would have occurred regardless of changes in the distribution of women across age groups. Further, the fact that for almost all age groups immigrant fertility fell faster than native fertility means the difference between the two groups would have narrowed as well.10
Conclusion
The idea that immigration can prevent the aging of society and "rebuild the demographic pyramid" because they are "more fertile" has an intrinsic appeal. It is tempting partly because it seems like a quick fix to problems like funding Social Security and Medicare and avoiding politically painful choices like cutting benefits, raising taxes, or extending the retirement age. Prior research shows that the immigration-will-fix-aging argument is largely a mirage. As this analysis shows, immigrants' somewhat higher fertility has only a small impact on the overall fertility rate no matter how fertility is measured. In fact, even if the number of immigrant women (15 to 50) doubled, along with the number of births to this population, it would only raise the nation's overall birth rate for women 15 to 50 by 3 percent.
Further, the fertility of immigrants is declining. This decline in immigrant fertility means that the small impact immigration has on the overall fertility rate in the United States, and the resulting impact on the aging of the America's population, is becoming even smaller. Fertility is dropping around the world, including from all of the primary immigrant-sending regions. Thus it should come as no surprise that immigrants in the United States are also having fewer children. One can favor reduced or increased immigration for any number of reasons, but America will simply have to look for solutions other than immigration to deal with the challenges associated with an aging society.
Methods and Data Source
This report uses the public-use files of the 2006 to 2013 American Community Surveys (ACS), excluding 2012. Data from 2012 are not used because of a problem reported by the Census Bureau with this variable in that particular year.11 The ACS is ideally suited for studying immigrant and native fertility because the survey asks women 15 to 50 if they had a child in the last year and it also identifies both immigrants and natives.12 The TFRs of immigrants and natives in this report are calculated using the age range of 15 to 50 because the ACS reports data for that population, allowing for a more complete analysis of fertility. However, the TFR can also be calculated for the age group 15 to 44. The inclusion of those 45 to 50 has only a tiny impact on the results.13
End Notes
1 In 2013, the total population of women 15 to 50 in the United States was 76.218 million and there were 3.952 million births, making for 51.8 births per thousand. Of this population, there were 12.671 million immigrant women who had 787,654 births in that year. If the number of immigrant women was doubled to 25.343 million and the number of births to immigrant women also doubled to 1.575, million then the total female population would be 88.889 million and the total number of births would be 4.740 million, making for 53.3 births per thousand, or 3 percent above the current level of 51.85 births per thousand
2 "Immigrants' Ages and the Structure of Stationary Populations with Below-Replacement Fertility", Carl P. Schmertmann Demography, Vol. 29, No. 4, November 1992.
3 The 2000 Census Bureau population projections mentioned above can be found here.
4 Stephen Tordella, Steven Camarota, Tom Godfrey, and Nancy Wemmerus Rosene, "Evaluating the Role of Immigration in U.S. Population Projections", presented at the annual meeting of the Population Association of America, May 2012. Using the Census Bureau's projections as a baseline, the paper shows that immigration between 2010 and 2060 would add roughly 140 million residents to the U.S. population. However, immigration would only increase the share of the population in 2060 that was of working-age (16 to 65) from 58.5 percent of the population (without immigration) to 59.9 percent. (See Figures 4 and 5 in that report.)
5 Lindsay M. Monte and Renee R. Ellis, "Fertility of Women in the United States: 2012", U.S. Census Bureau, 2014.
6 In this and all subsequent sections values are first rounded and then percentages are calculated.
7 See the Census Bureau glossary of terms page.
8 The idea behind the 2.1 number is that each woman has to have two children to replace herself and one man in order for the population to reproduce itself. It has traditionally been assumed that 2.1 children rather than 2.0 children are necessary to sustain the population, partly because there are slightly more boys than girls born each year. It should also be added that if life expectancy is increasing (as it has for more than a century) it might be some time before the population actually declines even if fertility drops below 2.1.
9 The only exception to this broad decline is native-born women 35 to 39, who saw their fertility increase slightly.
10 It is the case that the share of immigrants in the younger age groups, which have higher fertility, did fall slightly between 2008 and 2013. Thus, the aging of immigrants played a small role in their fertility decline. If we take the fertility rates for immigrant women in each group in 2013, but adjust the population shares in each age group so they are what they were in 2008, almost all of the decline in immigrant fertility would still have occurred. Had there not been a slight shift of immigrants into the older age cohorts, immigrant fertility for women (15-50) would have declined to 63.8 births in 2013 — a 12.2 birth decline since 2008. As we have seen, births per thousand for the 15 to 50 age group declined from 76 to 62.2 births for immigrant women — a 13.8 birth decline. This means that 88 percent of the decline in immigrant fertility would have occurred regardless of their aging into cohorts with lower fertility.
The story for natives is somewhat different. Among natives, the share in the age groups with higher birth rates actually increased slightly. If we take the fertility rates for native women in each group in 2013, but adjust the population shares in each group so they are what they were in 2008, native fertility would have declined more than it actually did. As we have seen, births per thousand for the 15 to 50 age group declined from 55.2 to 49.8 births per thousand for native women — a decline of 5.4 births. Had there not been a slight shift of natives into the higher fertility cohorts, native fertility would have declined to 47.3 births per thousand in 2013 — a decline of 7.9 births. This means that because natives (15 to 50) became a little more youthful, the fertility for natives overall did not decline as much as it would have. Nonetheless, the decline for natives would still have been a good deal less than the 13.8 decline for immigrant women and the fertility rates of immigrants and natives would have still converged.
11 In its most recent source and accuracy statement for the 2012 ACS, the Census Bureau stated that, "the ACS PUMS [Public Use Micro Sample] file has suppressed variables in the 2012 year PUMS file for a limited number of geographies. This is due to nonsampling error or issues with interpreting the recode. ... The fertility variable (FER) was suppressed in 59 PUMAs [public-use microdata areas] within states (sic) Florida, Georgia, Kansas, Montana, North Carolina, Ohio, and Texas." This comes to 1.8 million (weighted) cases with missing values for the fertility question. Because it is not clear what biases the missing values introduced, we have chosen to exclude the 2012 ACS from this analysis. See p. 10 in "PUMS Accuracy of the Data (2012)".
12 The Census Bureau refers to immigrants as the foreign-born. The foreign-born are those who are not U.S. citizens at birth and include naturalized U.S. citizens, legal permanent residents (green card holders), and long-term visitors such as guestworkers and foreign students.
13 In 2013, the TFR for natives when those over 45 are included was 1.79, without them it was 1.77. For immigrants, it was 2.22 when women over 44 are included and 2.19 when they are excluded.