Prepared by the polling company™ for the Center for Immigration Studies
Download this Backgrounder as a pdf
I. Key Findings
A. Neutral Questions Prompt Strong Opinions.
In October 2006, a month before the November mid-term elections, the Center for Immigration Studies commissioned a poll of likely voters by the polling company. The findings show that when presented with hard facts about the number of immigrants (both legal and illegal) currently in America, voters made clear that there are currently too many immigrants crossing our borders. In addition, the public wants the U.S. government to intensify its efforts to enforce current immigration laws (with the intent of causing illegals to go home over time) and rejected any increase in legal immigration levels. The views espoused by most Americans were those encapsulated by the bill passed earlier this year by Republicans in the United States House of Representatives. This suggests that the losses House Republicans sustained this election season are not linked to their stance on immigration, which was actually quite popular with voters.
B. When Presented with the Facts, Voters Say they Want Less, Not More, Immigration.
When given details about the number of immigrants (both legal and illegal) already in America and the number entering each year, 68 percent of likely voters thought the number of immigrants (regardless of legal status) crossing our borders was "too high," while just 21 percent said it was "about right," and 2 percent believed it was "too low." It didn’t take fancy turns of phrase or inflated figures to lead them to this conclusion. This would seem to contradict those who argue that the only concern of voters with respect to immigration is illegality, rather than the sheer number of immigrants in the country.
C. Data Contradict Other Polls Showing Support for Legalization.
Several advocacy groups and even some media outlets have released polls showing support for legalizing current illegals. However, those polls often gave voters a very limited choice between large scale deportations or earned legalization. This survey also finds some support for earned legalization. However, when given the third choice of across-the-board enforcement with the goal of causing illegals to go home on their own (which is the basis of the bill passed by the U.S. House), the public strongly favored this "attrition strategy" over mass deportations or earned legalizations.
D. Very Little Support for Increasing Legal Immigration.
There appears to be minimal support for the kind of large increase in legal immigration found in the bill passed recently by the U.S. Senate (S2611). Across the political spectrum voters felt legal immigration levels were either too high or just right. When asked specifically about legal immigration, only 8 percent said it was too low.
In fact, 70 percent of voters said they would be less likely to vote for a candidate who supported doubling legal immigration, compared to just 21 percent who said they would be more likely to vote for such a candidate (a warning to Senators who support S2611 which would just that). And the intensity of opposition was overwhelming, with 48 percent saying they would be much less likely to vote for a candidate that wants to double immigration, compared to only 7 percent who said they would be much more likely to vote for such a candidate.
E. Immigration Plan Passed by the U.S. House by Far the Favorite.
Voters generally rejected the extremes of mass deportations or legalization of illegals. When asked to evaluate several proposed immigration policies, Americans rallied most forcefully around the House of Representatives plan. The House plan, which increases enforcement with the intent of causing illegals to go home, was the most popular when tested alone and when stacked up against other plans. Futhermore, when given three simple choices, across the board enforcement was the most popular: with 44 percent favoring the House’s attrition approach, 31 percent supporting an earned legalization, and just 20 percent in favor of large scale deportations. Enforcement without an earned legalization or an increase in legal immigration is clearly the public’s choice. No matter how the questions were asked, the results were virtually the same.
F. Voters Skeptical of the Need for Unskilled Immigrant Labor.
When presented with two competing views regarding the need for immigrants to supplement the low-wage, low-skill workforce, more than 70 percent of voters agreed that there were, "plenty of Americans to do low-wage jobs that require relatively little education, employers just need to pay higher wages and treat workers better to attract Americans." Less than one-third that many (21 percent) said the country needed immigrants because there are not enough Americans to do such jobs.
G. Lax Enforcement Partly to Blame for Illegal Immigration.
Nearly three-out-of-four voters said that the United States had done too little to enforce immigration laws. And three-quarters also agreed that the reason we have so many illegals in this country is that past enforcement efforts have before "grossly inadequate." Only 14 percent felt the government has made a "real effort" to enforce our laws and the reason we have so much illegal immigration is that we are not allowing in enough immigrants legally. This is a key argument posited by those who argue in favor of increased legal immigration and is a central tenet of the Senate plan.
H. Republican Most Strongly in Favor of Enforcement, but Independents and Many Democrats also Oppose Legalization.
While there were members of all three political persuasions (e.g. Republican, Democrat, and Independent) on both sides of the issue, overall Republicans were the most likely to believe that immigration was too high, and were most supportive of an enforcement approach. However, a majority of Democratic voters also felt overall immigration was too high and preferred either large scale deportations or an attrition strategy over earned legalization. There was little supporting for increasing legal immigration among adherents of any party.
I. Traditionally Democratic Voters – Including Minorities and Low-Wage, Low-Skill Workers – Split from Party on Many Aspects of Immigration.
Voters whose life and livelihoods are perhaps most apt to be directly affected by the presence of immigrants – those who are potentially being passed over for jobs in favor of immigrants who will accept lower wages and fewer benefits – split from their traditional Democratic roots and sided with Republicans. They were much more likely to believe the current number of immigrants in the country was too high and more favorable towards enforcement policies – including those that simply rounded up illegals and deported them.
II. Methodology
the polling company ™, inc. conducted a nationwide telephone survey of 1,000 Likely Voters in the November 2006 General Election1 on behalf of the Center for Immigration Studies.
Interviews were conducted September 18-24, 2006 at a Computer-Assisted Telephone Interviewing (CATI) facility using live callers. The sample was drawn utilizing a Random Digit Dialing (RDD) method where phone numbers were generated by a computer to ensure that every household in the nation had an equal chance to be called. Adults were then screened for voter registration and likelihood of participating in the November 7, 2006 general election. Only those who indicated they would "definitely" or "probably" vote were interviewed.
Sampling controls were used to ensure that a proportional and representative number of people were interviewed from such demographic groups as age, gender, race and ethnicity, and geographic region.
The original survey instrument contained 44 questions, including one open-ended question and 14 demographic inquiries, and was approved by an authorized representative of CIS prior to commencement of data collection.
- Rotational patterns were employed for all questions in which respondents were asked to select from two or more pre-given answer choices to ameliorate the bias sometimes associated with first and last answer options.
- After giving an initial response to many inquiries (e.g. "support" or "oppose"), respondents were probed as to the intensity of their answers and whether they felt so "strongly" or "somewhat." This allows for a more accurate gradation of opinion to be assessed.
- "Person 1/ Person 2" inquiries present voters with two competing viewpoints on an issue and ask them to choose the one they identify with most. These questions expose respondents to the "strongest" arguments for and against particular positions and action to avoid biasing them by presenting with only one viewpoint.
The four states studied were selected because they were home to Senate races that have all attracted significant national attention. The ten congressional districts were selected based on their geographic diversity and because they varied in terms of the incumbent party or if they were open seats. All the seats were classified by the Cook Political Report in August as either "leaning" or "tossup" districts. None were considered solid or even likely for one party or the other.
The margin of error for the survey is + 3.0 percent at a 95 percent confidence interval, meaning that the data obtained would not differ by any more than three percentage points in either direction had the entire population of likely voters in the United States been surveyed. Margins of error for subgroups are higher.
III. Analysis of Findings
A. November 2006 Elections
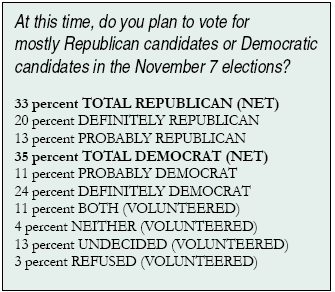
- Democrats Hold Slight Edge in National Generic Ballot Test; 2006 Elections Still Up for Grabs. With approximately six weeks to go until the 2006 mid-term elections, Americans were almost evenly split between supporting Republican (33 percent) and Democratic (35 percent) candidates.
While overall the parties were statistically tied, adults who planned to vote for Democrats were a bit more firm in their intentions than GOP voters, with those "definitely" casting a ballot for a Dem outnumbering the "probables" by a margin of more than 2-to-1 (24 percent-11).
Another 13 percent were firmly undecided, indicating a substantial portion of "persuadables" still remain.
- Immigration Tied with Healthcare as Most Important Priority for Elected Officials; Only the War and the Economy Judged Superior. When asked to select from a list of seven choices the single issue most critical for officials to focus on right now, voters were more concerned about matters occurring outside our borders than within them, or even directly "on" them. It was clear that the war in Iraq and terrorism should be the foremost concern with 26 percent. That topped the next most important issue – jobs and the economy – by a full 9-points (17 percent).
Social concerns, including healthcare (13 percent), immigration (13 percent), and education (12 percent), clustered in third place, and were the only other issues to garner double-digit mention. Moral issues such as abortion and marriage (7 percent) and taxes (5 percent) followed.
- Immigration was especially important to "Junior Seniors" (55-64 year olds), conservatives, self-ID Republicans (who were 2.5 times as likely as Democrats to select this issue - 20 percent-8 percent), those who intend to support mainly Republican candidates this fall, and retirees.
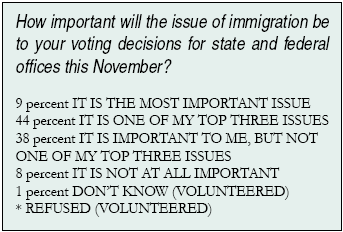
- A Majority of Voters Say Immigration Will Be a "Top Three" Issue in their Decision This November. One-in-ten (9 percent) revealed immigration would be the most important influence on their November 7 choices. Forty-four percent classified immigration as a "top three" concern and other 38 percent noted immigration as "important" but not one of their top three issues. Only 8 percent said it would be not be at all meaningful to their vote. In short, immigration is an issue that cannot be ignored in this election cycle by any candidate, and is poised to tip the balance in some tight races.
- Groups more likely than most to name immigration the top or one of the top issues that would impact their vote included those aged 55+, conservatives, self-ID Republicans, and those who plan to vote for Republican candidates in November.
B. General Awareness of and Opinions on Immigration
- Most Americans Have Paid At Least Some Attention to the Immigration Conversation. The political currency of immigration is further shown in the fact that three-quarters (75 percent) of likely voters surveyed reported following the national discussion on immigration "very" (31 percent) or somewhat" (44 percent) closely.
Another 19 percent revealed they have paid just a little bit of attention to the news on immigration and 6 percent admitted they were not at all engaged.
- Voters more apt than respondents overall to be tuned in the current musings on immigration included those over age 55, Hispanics, retirees, Western dwellers, and those who suggested it would be an important issue to their vote this fall.
- Too Many or Just Right? Americans Divided on the Current Level of Permissible Legal Immigration. After learning that one million immigrants are granted permanent residence in the U.S. each year and another million are allowed to come into the country on a long-term basis,2 42 percent of likely voters proclaimed this number "too high." An identical 42 percent responded to these same facts by saying the current level of legal immigration was "about right."
A mere 8 percent of voters felt the number of legal immigrants permitted to enter the country each year was "too low" – one-fifth the number who said it was too high. Americans may be split on whether we have too many immigrants, but they are certain we don’t have too few.
- Additional Facts Convince Strong Majority that Number of Immigrants in America is Too Large. After learning that "there are currently 37 million legal and illegal immigrants living in the United States and 1.5 million new legal and illegal immigrants settle in the country each year, not including those who are allowed in on a long-term temporary basis," 68 percent of voters declared the number of immigrants in America (regardless of legal status) "too high." This is three-times the number who felt the total number of immigrants was "about right" and an eye-popping 34-times the number who said it was "too low."
This query also introduced the concept of illegal immigration – a hot topic of current debate (the previous inquiry asked about legal immigrants only). While the addition of "illegal" appears to have enhanced percentage who said the number of immigrants in the U.S. is too high, the question specifically asked voters to put aside the question of legal status and the results certainly suggest the public is concerned by the total number of immigrants calling America home.
- Groups more likely than voters overall to be concerned that there were too many immigrants in this country (regardless of legal status) included 18-24 year olds, conservatives, self-ID Republicans, those who will vote for mainly GOP candidates this fall, Protestants (most notably those who were "Born-Again"), blue-collar and part-time workers, and residents of the South Central U.S.
- Those more apt than most to be satisfied with the current level of immigration were 25-34 year olds, liberals, those who plan to vote for Democratic candidates in November, college graduates, and professionals.
- Not a single group was significantly more likely to say the number of immigrants (legal or illegal) in America was too low, marking unusual tri-partisan agreement on a policy matter about which Americans of varying ages, races, incomes, and both genders concur.
- By Nearly 2-to-1, Americans Declare Immigrants Are Not Integrating. When asked to choose between two competing views on the relative success of "immigrant assimilation" and its effect on future immigration policy, a majority of voters (59 percent) said the best course for the country would be to reduce the current level of immigration so we might focus on assimilating the immigrants who are already here. This was nearly twice the number (31 percent) who dismissed the notion that immigrants were not part of the proverbial melting pot of American culture and felt the country should maintain its present course.
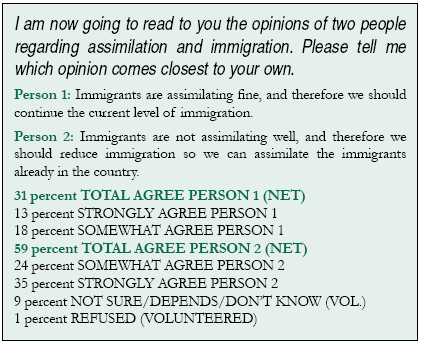
Furthermore, the intensity of the views held by voters who agreed that immigrants were not assimilating well was notable higher than those who felt they were doing "fine."
- Groups more likely than voters overall to believe immigrants were not assimilating well included conservatives, self-ID Republicans and those planning to vote for GOP candidates in the General Election, blue-collar workers, high school graduates, and those with some college.
- Those more apt than most to believe immigrants were doing a fine job integrating included Blacks and Hispanics, liberals, self-ID Democrats and those who will cast a ballot for Dem candidates in November, college grads, professionals, white collar workers, and Northeasterners.
Ideological liberals were actually the only group more likely to express the view that immigrants are doing a fine job blending in than to feel that they were not assimilating well (47 percent-38 percent). Hispanics were almost evenly split, but still tilted in favor of immigrants struggling to integrate (47 percent vs. 42 percent who said "assimilating fine").
C. Enforcement of Immigration Laws
- Voters Rebuke the Government’s Efforts (or Lack Thereof) to Regulate Immigration. Voters were asked a simple question about the federal government’s attempts to implement current immigration laws. The results were overwhelming. An unmistakable majority (73 percent) declared that the government had done "too little" in terms of enforcement. By comparison, just 11 percent gave the government’s efforts a passing grade – saying it had done "just the right amount" – and 7 percent felt the Feds had done "too much." This last figure is a reversal of the general trend among Americans, vis a vis federal government regulation on many other matters. Similarly, 8 percent were not sure – a remarkable low number for the equivocation when compared to public sentiment on other policy issues.
- Men were more likely than women to believe the government had done "too little" (76 percent-70 percent).
- Other groups more likely than most to find enforcement efforts lacking included 55-64 year olds, conservatives, self-ID Republicans, and those who intended to cast a ballot for Republican candidates in November.
- Blacks and Hispanics were more likely than most to take the Goldilocks approach and say the government’s enforcement has been "just right."
- Those most apt to cry foul and claim the government had done too much included 18-24 year olds, liberals, and those who planned to vote for mostly Democratic candidates in the November election.
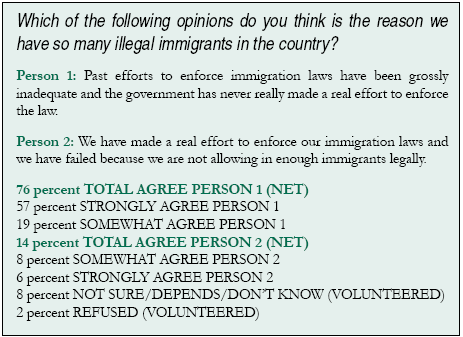
- A Troubling Nexus: Lax Enforcement to Blame for Growing Population of Illegal Immigrants. By a margin of more than five-to-one (76 percent-14 percent), voters pointed the finger at insufficient efforts to apply current laws as the cause for "so many illegal immigrants" in the U.S. rather than an overly-restrictive policy on legal immigration (the argument often made by advocates calling for increased legal immigration, including supporters of the recent immigration bill passed by the U.S. Senate (S2611)). In fact, a clear majority (57 percent) felt this way "strongly."
- Groups more likely than most to deem enforcement efforts "grossly inadequate"
- Those more apt than average to feel the U.S. has tried to apply its laws but failed because legal immigration is too low included liberals, those who plan to cast a ballot for the Dems in the General Election, professionals, and Pacific region residents.
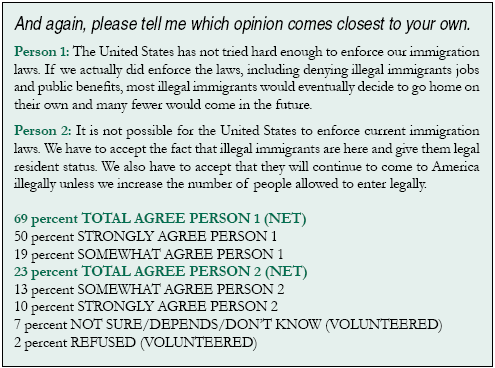
- Seven-in-Ten Agree That New Attention to Enforcement of Immigration Laws Superior Solution to Legalizing Current Illegals. Voters were fairly firm in their rejection of the principle that trying to restrict illegal immigration is futile. Instead, 69 percent of them voiced the opinion that the government simply has not tried hard enough, but if a concerted effort was made to enforce the laws, many illegals would go home on their own. Furthermore, one-half (50 percent) of them held this position with intensity.
Just one-third that many (23 percent) were of the mind that the U.S. must simply accept its fate as a haven for illegals and grant them all citizenship (as well as boosting legal immigration). Americans by nature are not a "give up and give in" people and this issue is no exception.
- Groups more likely than most to feel the U.S. could solve many of its illegal immigration problems by enforcing laws that have never really been applied included 35-44 year olds, conservatives, self-ID Republicans and those who will vote Republican this fall, and blue collar workers.
- Voters more likely than most to feel the government must accept that the laws cannot be enforced and legalize current illegal immigrants included 18-24 year olds, Blacks, liberals, self-ID Democrats and those who will favor left-leaning candidates this fall, parents, and Westerners.
D. Costs of Immigration - Overview
- Economic Impact and Effect on Social Services Cited as Most Troubling Albatross of Immigration. Americans thought fiscally when asked to select their most pressing concern related to immigration from a list of six options. In fact, a full 27 percent of likely voters selected the "burden on taxpayers, such as health care and schools" that immigrants create – nearly twice the number who named any other potential problem.
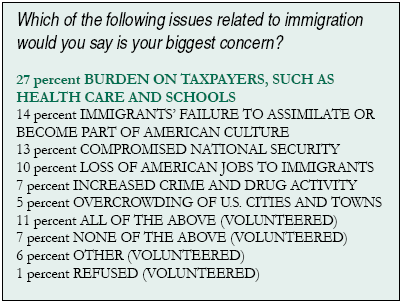
Concern about the failure of immigrants to "assimilate or become part of American culture" was second on the list with 14 percent, followed closely by "compromised national security" with 13 percent. Though earlier in this survey voters revealed the critical importance to them of the war on terror and politicians and the media often link securing the borders with winning that war. When presented with a series of other potential effects, voters are inclined to wear green eye shades and think financially.
"Loss of American jobs" also received double-digit support (10 percent), while "increased crime and drug activity" (7 percent), and "overcrowding of U.S. cities and towns" (5 percent) were considered less pressing.
A notable 11 percent of respondents volunteered that they were concerned by "all of the above," while 7 percent shrugged off the potential problems with immigration saying they weren’t worried about any of them.
Voters more likely than most to select ___________ as their top immigration concern: Burden on taxpayers, such as healthcare and schools. (27 percent Overall)- Self-ID Republicans
- Plan to vote for GOP candidates in November
- Conservatives and moderates more than liberals (28 percent and 30 percent, respectively vs. 20 percent)
- 18-24 year olds
- South Atlantic residents
- 25-34 year olds
- Self-ID Republicans
- Plan to vote for Republican candidates this fall
- Those who stay home full time
- Blacks
- Part-time workers
- Low-income households (< $30K)
E. Costs of Immigration – Population Growth / Overcrowding
- Americans Worried that Immigration Leads to Explosive Population Growth. The overcrowding of America’s cities was considered the least troublesome impact of immigration when tested amongst a longer list of problems. However, when considered alone, the prospect that nchecked immigration would increase the American population by 100 million people over the next 50 years3 was a shocking figure to many voters – 64 percent of whom responded by calling for the country to "reduce the number of immigrants entering the U.S."
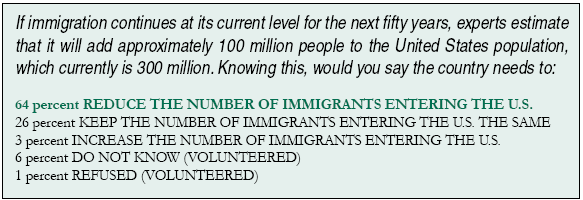
This is 38 points higher than the 26 percent who were satisfied with the present level of immigration continuing. A paltry 3 percent felt America should welcome in even more foreign nationals.
- Voters more likely than most to call for immigration levels to be reduced in the face of these figures included 55-64 year olds, Blacks, conservatives, self-ID Republicans and those who plan to vote for GOP candidates in November, Protestants (especially those who are "Born-Again"), those with a high school diploma or less, blue-collar workers, Southerners, and low-income households (<$30K).
- Those more apt than voters overall to believe the number of immigrants entering the U.S. should remain the same, even if that means 100 new "Americans" over the next 50 years included 25-34 year olds, liberals, self-ID Democrats and Independents, those who will vote for Dem candidates this fall, college graduates, professionals, households earning more than $50,000 per year, and residents of the West.
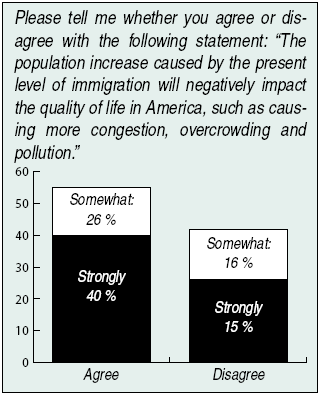
- Two-Thirds Declare Unchecked Immigration a Threat to American Quality of Life. In a separate question, a comparable number (66 percent) agreed that immigration has the potential to cause negative consequences to their quality of life. By a margin of more than 2-to-1, voters assented that the predicted population growth caused by current immigration policies would lead to increased congestion, overcrowding, and pollution (66 percent agree vs. 31 percent disagree). This opinion was held with notable intensity – a full 40 percent "strongly" concurred.
- Those more likely than most to agree that immigration could lead to congestion and overcrowding included 55-64 year olds, conservatives, self-ID Republicans and those who will support Republican candidates in the upcoming election, Protestants (especially those who are "Born-Again"), high school graduates, blue collar workers, retirees, and residents of the Southern United States.
- Groups more inclined than voters overall to disagree were 18-34 year olds, Hispanics, liberals, self-ID Democrats and those who will vote for mainly Democratic candidates this fall, professionals, high-income households ($70K+), and Western dwellers.
- N.I.M.B.Y. (Not In My Backyard): Americans Acknowledge that Big Growth in Home Town Population Would Be Detrimental. When faced with a hypothetical that hit a bit closer to home – a one-third increase in the population, literally where respondents live – a clear majority (65 percent) believed their quality of life would be harmed by such an influx.
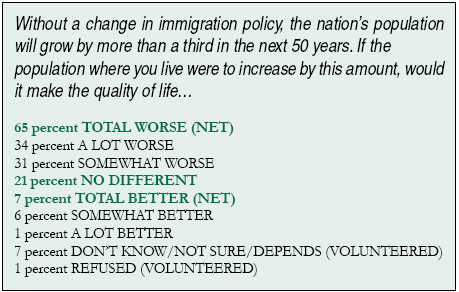
This is very similar to the result to the previous question, in which 66 percent declared the overall American quality of life would suffer, indicating that the possible negative effects of immigration are credible and tangible to most folks, not just something hypothetical "other people" must endure.
One-fifth (21 percent) did not feel they would be much affected either way if the population were to jump by this amount, and a mere 7 percent perceived benefit to this kind of growth.
- Those more likely than voters overall to worry that a substantial population increase would negatively impact them included conservatives, voters who will support GOP candidates in November, those with a high school education or less, and retirees.
- Hispanics and liberals stood out as groups more inclined than average to say "no different."
- The number of people claiming that an immigrant-driven substantial increase in population in their own neighborhoods would improve the quality of life failed to reach 15 percent among any major demographic group surveyed (with liberals the highest at 14 percent).
F. Costs of Immigration – Loss of American Jobs
- Even More Decisively, Voters Reject Argument That We Need Immigrants Because There Aren’t Enough Americans to Fill Low Wage Jobs. An unmistakable majority (71 percent) of respondents declared that the secret to filling low paying, low education jobs in this country is higher wages and better treatment by employers of American workers – not the "importation" of immigrants.
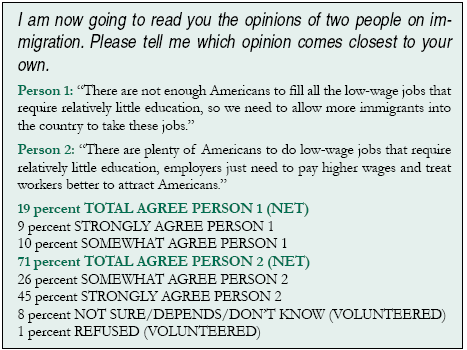
The intensity with which voters held this opinion was palpable – a full 45 percent felt "strongly" that employers were bypassing Americans to fill their low wage jobs in favor of immigrants who accept lower wages.
By comparison, just under two-in-ten (19 percent) agreed that it was necessary to allow immigrants in to take low wage jobs because there weren’t enough Americans to perform them all.
- Notably, voters more likely than most to believe there are enough Americans to fill low-wage jobs were those who ostensibly would be competing with immigrants for these jobs (e.g. those with a high school diploma or less, blue collar and part time workers), and residents of the Southern region.
- Those more likely than average to say we need more immigrants to fill all the low-wage jobs in this country included Hispanics, liberals, college graduates, and professionals.
G. Children of Immigrants
- Voters Split on "Citizenization" of Children, But More Than Half Reject "Born in the USA" as Free Pass. After learning how many children are born to illegal immigrants inside the United States and granted de facto citizenship each year4, a slim majority (52 percent) of voters denounced this policy. They outnumbered those who approved of automatically granting U.S. born children legal status (43 percent) by 9-points, a small, but nonetheless decisive, victory.
Additionally, there was a bit more urgency in the opinions of opponents to the current citizenship policy – 35 percent "strongly" denied the automatic citizenship tenet (double the number who did so "somewhat").
H. Preferred Immigration Policy
- Americans Favor Firm Enforcement Over Amnesty or Mass Deportation. When it comes to the ideal immigration policy for the U.S., the plurality of voters moderated toward a "middle of the road" approach, rather than the more extreme poles of "kick them out" or "let them stay." In fact, 44 percent felt the best option was "a policy that strictly enforces immigration laws and causes illegal immigrants to go home over time."
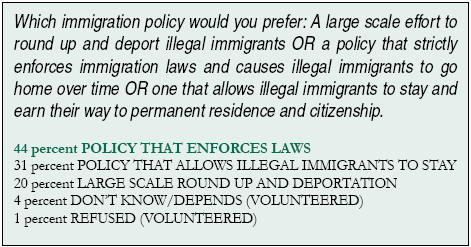
While enforcement won the most votes in this three-way contest, the other two suggestions also garnered notable support.
Three-in-ten (31 percent) respondents were most attracted by a plan that would permit current illegals to remain here and earn their way towards citizenship, while 20 percent favored mass round-ups and deportation.
Several advocacy groups and even some media outlets have released polls showing support for granting legal status to current illegal immigrants. However, many of those polls restricted voters to an artificial choice between large-scale deportations or earned legalization. When given the third choice of stricter enforcement with the intention of making illegals go home on their own over time, the public prefers this type of "attrition strategy" most.
Just 4 percent could not or would not choose between the three policies, suggesting again that immigration is a key topic in the national consciousness right now and one about which nearly everyone has an opinion he or she is willing to share.
- A bit of a gender gap emerged, as men were more likely than women to favor a policy of enforcement (47 percent-42 percent), while women were more apt than their male counterparts to prefer allowing illegals to stay and earn citizenship.
- Groups more likely than most to find the strict enforcement plan the most appealing way to handle illegal immigration included self-ID Republicans, those who plan to vote for GOP candidates in the fall, and white-collar workers.
- Those more apt than voters overall to prefer granting current illegals legal status included liberals, self-ID Democrats and those who will vote for mainly Democratic candidates in the election, and Westerners.
- Voters more likely than average to vouch for large-scale roundups of illegals included 35-44 year olds, conservatives, self-ID Republicans and those supporting Republican candidates in November, those with a high school diploma or less, and blue collar workers.
- Past as Prologue: Eight-in-Ten Believe Amnesty Would Encourage More Illegals to Cross Our Borders. Voters were largely of one mind after being told about the legalization that occurred in the late 1990s, and the subsequent growth in the illegal population that has occurred since then. A full 79 percent agreed that legalizing the 12 million illegals estimated to now be in this country would only lead to another big influx of undocumented immigrants.
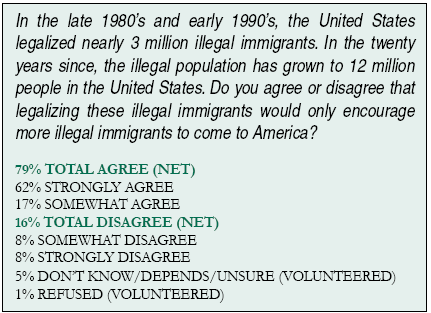
Perhaps more remarkable than the sheer size of the agreement with this principle was the adamancy with which voters expressed their opinions – an eye-popping 62 percent of them said they strongly agreed.
This is nearly five times the number (16 percent) who disputed that automatically legalizing illegal immigrants already here with no questions asked would cause more of them to try to enter the States.
This cause-and-effect relationship was naturally accepted by voters as logical and true. No spin is needed to convince them that forgiving the illegal behavior that brought them to the U.S. will only invite more such conduct.
- Groups more likely than most to agree that amnesty would cause an influx of immigrants included 18-24 year olds, conservatives, self-ID Republicans and those who will cast a ballot for GOPers this fall, high school graduates and those who have completed some college, and white collar workers.
- Those more apt than voters overall to disagree with the statement were 45-54 year olds, liberals, self-ID Independents, those who plan to vote for Democrats in November, college grads, and professionals.
- U.S. House Plan Big Winner Among Several Possible Immigration Restrictions. Voters were asked to evaluate four separate plans that have been proposed to deal with the problem of immigration in this country. They were asked whether they supported or opposed each plan individually and the order in which the proposals were presented to them was rotated to avoid bias. Each plan was summarized using balanced neutral language, and all relevant aspects of each proposal was explained.
As indicated in the following chart, voters most embraced the immigration policy advocated by the United States House of Representatives – in fact, two-thirds (67 percent) supported it compared to 26 percent who stood opposed resulting in a net positive of 31-points.
Mass deportation was also moderately praised, while the proposal known as the Pence Plan (for Indiana Congressman Mike Pence (R)) divided voters. The immigration policy package put forth by the United States Senate was soundly rejected by these likely voters.
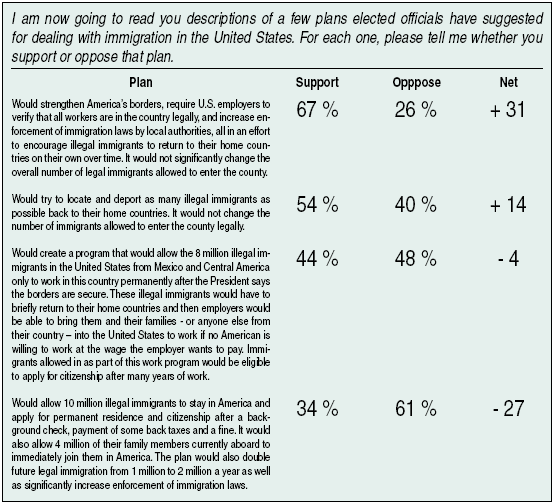
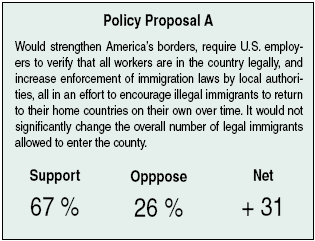
Voters clearly favored an immigration policy which would not significantly alter the permitted level of legal immigration and which stepped up enforcement as a carrot to encourage illegals to eventually go home. A full 67 percent offered their support. Intensity was evenly split, with 34 percent "strongly" backing it and 33 percent who doing so just "somewhat." Approximately one-quarter (26 percent) of those surveyed opposed the plan.
- Gender played an important role in voters’ opinions on this plan. While a majority of both men and women supported it, men were much more likely to do so (73 percent-62 percent).
- Groups more likely than most to back the House’s proposal included 18-24 year olds, conservatives, self-ID Republicans and those who plan to vote Republican this fall, blue collar workers, and voters who do not work outside the home.
- Liberals, self-ID Democrats, and those who say they will back Dem candidates in November stood out as more apt than average to oppose this plan.
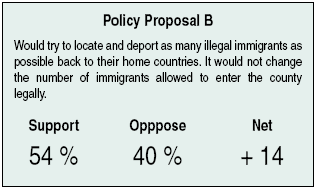
Broad-scale round-ups and deportation of illegal immigrants also received support among a majority of voters (54 percent), albeit by smaller margins that other proposals. A full 40 percent of voters were against such a plan and nearly one-quarter (24 percent) adamantly so. The public clearly favors tough enforcement, as this was the only other plan to achieve a net positive result.
- Men again stood out as more in favor of this plan than women (58 percent-52 percent).
- Voters more likely than most to support mass deportation included 18-24 year olds, conservatives, self-ID Republicans and those who planned to vote Republican this fall, those with a high school education or less, blue collar workers, low-income households (< $30K), and residents of the Southern region.
- Groups more apt than voters overall to oppose deportation included 45-54 year olds, liberals, self-ID Democrats and Independents, those who will vote for mainly Democratic candidates this fall, college grads, professionals, white collar workers, high-income earners (> $70K), and Western region residents.
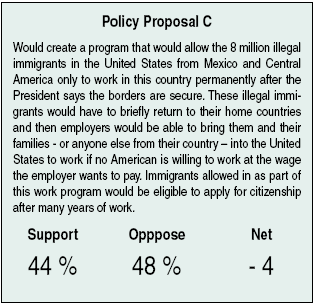
Voters split over the immigration policy proposed by Congressman Mike Pence (R-IN), with 44 percent in favor and 48 percent against. Though the topline numbers reveal a closely divided electorate, intense opposition to this guest worker plan was double the level of strong support.
- The gender gap was notable by its absence with respect to the Pence Plan. There was also little variation by ideology, party, or voting intention.
- Groups more likely than most to support this immigration policy included 18-24 year olds, 55-64 year olds, Hispanics, and Catholics.
- Those who stood apart as more opposed than average included 25-54 year olds, liberals, white collar and blue collar workers, those who do not work, and union households.
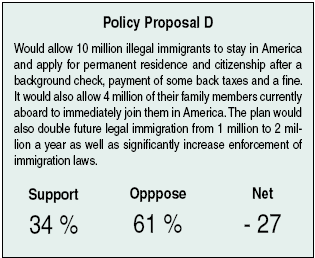
The immigration policy similar to that proposed by the United States Senate (S2611) that provides a path to citizenship for illegal immigrants currently in the U.S. was emphatically rejected by voters, 61 percent of whom opposed it (and with intensity – 42 percent were strongly against it). By comparison, just 34 percent supported the plan to legalize illegal immigrants already in the country and double the number of legal immigrants allowed in each year. This resulted in a significant net negative of 27 points.
- Men were somewhat more likely than women to oppose this plan (63 percent-58 percent), though the two sexes supported it equally at 34 percent.
- Voters more likely than most to be in favor of mass legalization of immigrants included 25-34 year olds, Hispanics, liberals, self-ID Democrats and those who intend to support Democratic candidates in November, parents, college graduates, professionals, and those who stay home full time.
- Those more likely than average to reject the Senate plan included 55-64 year olds, conservatives, self-ID Republicans and those who will back the GOP in November, high school grads, and blue collar workers.
- House Immigration Policy Also Comes Out on Top in Head-to-Head Match-Up. After evaluating each of the four proposals separately, voters were read short summaries of each again and asked which one they thought was best. The plan proposed by the United States House of Representatives was the clear and unmistakable winner, garnering 44 percent support – twice that of the next most popular plan. The mass deportation solution remained in second place with 22 percent support, but the third and fourth plans (as judged by their scores when judged individually) flipped places. The Senate policy was favored by 16 percent of voters and the Pence proposal by just 11 percent.
Notably just 4 percent were unsure – a tiny number for such a complicated issue. This reinforces the premise that immigration is not a topic about which voters are apathetic or unengaged. Rather, everyone has an opinion.
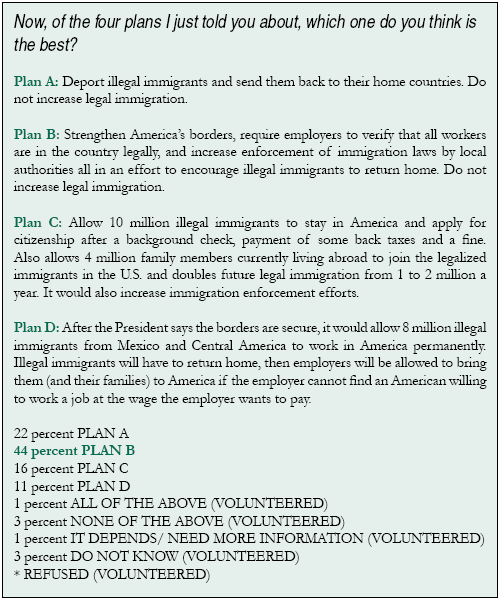
Voters more likely than most to select ___________ as the best immigration policy:
Plan A: The Mass Deportation Plan (22 percent Overall)
- High school graduates
- East Central residents
Plan B: The United States House of Representatives Plan (44 percent Overall)
- Conservatives
- Self-ID Republicans
- Plan to vote for GOP candidates in November
- "Born-Again" Protestants
- Blue collar workers
- Residents of New England, the South Atlantic, and Mountain regions
Plan C: The United States Senate Plan (16 percent Overall)
- Liberals
- Self-ID Democrats
- Plan to vote for Democratic candidates in November
- Hispanics
- College graduates
Plan D: The Pence Plan (11 percent Overall)
- Undecided voters
- Professionals
I. Political Currency
- Candidates Who Supports Reducing the Number of Immigrants in the U.S. – Both Legal and Illegal – Gains Notable Backing from Voters. After examining reactions to proposed immigration policies, the survey evaluated the prospective political punch carried by candidates’ varying stances on immigration. The inclusion of "political currency" questions – which ask voters whether they would be more or less likely to vote for a candidate holding a particular view – often helps to translate ideas from hypothetical and nebulous to real and actionable in voters’ minds.
Five individual candidate positions were presented to voters. For each one, they were asked whether knowing that a man or woman seeking office held this view would make them more or less likely to cast a ballot in his or her favor. Of the five positions tested, three resulted in net negatives for these unnamed office-seekers and three in net positives. Directly following is a summary overview: each candidate position is analyzed extensively below.
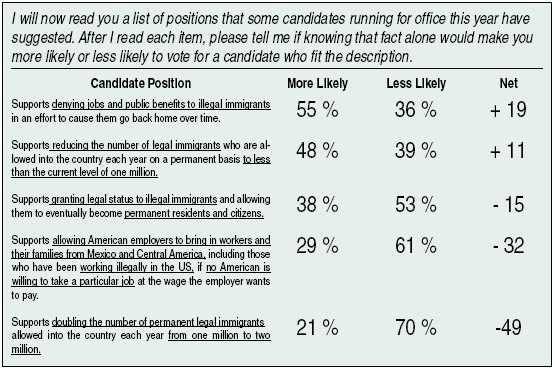
- Supports denying jobs and public benefits to illegal immigrants in an effort to cause them go back home over time.
An office-seeker adopting the "reduction through attrition" principle (part of the U.S. House proposal tested previously in the survey) was appealing to 55 percent of likely voters. This candidate backing was not quite as strong as the general support the House immigration policy received (67 percent). Still, with 36 percent of respondents noting they would be less inclined to vote for this candidate, the result was a net positive of 19 points. This was the only hypothetical to generate majority support.
- Supports reducing the number of legal immigrants who are allowed into the country each year on a permanent basis to less than the current level of one million.
A candidate who favored reducing legal immigration in the U.S. was also fairly popular, but failed to crack the 50 percent mark. Rather, 48 percent of voters would be more apt to support him or her, compared to 39 percent who would be less likely. When taken with other data, this result reinforces Americans’ expressed opposition to increasing the level of legal immigration.
- Supports granting legal status to illegal immigrants and allowing them to eventually become permanent residents and citizens.
Being pro-immigrant amnesty was not a fruitful position for office-seekers to hold. In fact, a majority (53 percent) of voters would be less likely to back a candidate who took such a stance while only 38 percent would be more likely to vote for him or her.
- Supports allowing American employers to bring in workers and their families from Mexico & Central America, including those who have been working illegally in the US, if no American is willing to take a particular job at the wage the employer wants to pay.
Voters were initially split on the Pence Immigration plan when tested earlier in the survey, but when it came to voting for a candidate who supported most responded, "No way." A full 61 percent would be less likely to support this candidate – more than twice the 29 percent who would be more likely.
- Supports doubling the number of permanent legal immigrants allowed into the country each year from one million to two million.
A candidate who wanted to double legal immigration received an unmistakable thumbs down from voters, 70 percent of whom would be less likely to cast a ballot in his or her favor. By comparison, just 21 percent supported such a candidate resulting in a net negative of a whopping 49 points.
- Groups most likely to vote for this candidate included 25-34 year olds, 55-64 year olds, conservatives, self-ID Republicans and those who will support GOP candidates this fall, Protestants, high school graduates, and blue collar workers.
- Additionally, men were a bit more likely than women to back a candidate who supported this approach to reducing illegal immigration (58 percent-53 percent).
- Those who stood out as markedly less likely than most to support such a candidate including Hispanics, liberals, self-ID Democrats and those who will back Dem candidates in November, college grads, professionals, and Westerners.
- Groups more likely than voters overall to back this candidate included conservatives, those who will vote for GOPers this fall, Protestants (especially "Born-Again"), high school grads and those with some college, white and blue collar workers, union households, middle income households ($30K-$70K), and North Central residents.
- Those less apt than most to support this candidate included liberals, self-ID Democrats and those who will vote for Dem candidates in November, college grads, professionals, and Westerners.
- Voters least likely to support this candidate after learning this fact included 55-64 year olds, conservatives, self-ID Republicans and those who intended to vote for Republicans this fall, Protestants (especially those "Born-Again"), high school grads, blue collar workers, and Southerners.
- Groups least likely to support this candidate included conservatives, self-ID Republicans and those who plan to vote for mostly GOP candidates in November, high school grads, and blue collar workers.
- Those least inclined to vote for this candidate included seniors, conservatives, self-ID Republicans and Independents, voters who plan to support Republican candidates this fall, high school grads, blue collar and part-time workers, and retirees.
- Supports denying jobs and public benefits to illegal immigrants in an effort to cause them go back home over time.
There was extremely strong negative reaction to any proposal that included increasing the level of legal immigration, at least on the scale proposed by the Senate. In fact, one of the things that sets this particular poll apart from other studies is that it probes voters specifically on they feelings regarding legal immigration. Previously, pollsters have focused on questions dealing with the legalization provisions of the Senate’s plan or the guest worker policies. In fact, the proposed increases in legal immigration appear to be one of the most unpopular features of the Senate bill.
J. Immigrants and the Media
- Voters Believe Media Portrayal of Illegal Immigrants Doesn’t Tell the Whole Story. By a margin of more than two-to-one (62 percent-29 percent), voters agreed that the news media’s coverage of illegal immigrants is mostly human-interest fluff that largely ignores or omits information about the downside of a steady stream of people entering this country illegally.
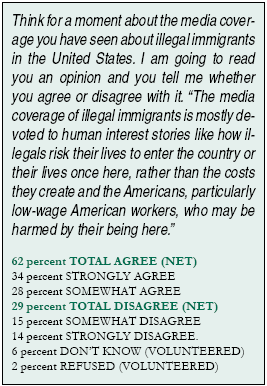
- Groups more likely than voters overall to agree that the media paints an unrealistically sunny picture of illegal immigrants included 18-24 year olds, 45-54 year olds, conservatives, self-ID Republicans and those who plan to vote Republican this fall, high school grads, those who don’t work, and mid-Atlantic residents.
- Those more inclined than most to disagree with this assessment of the media were Blacks, Hispanics, liberals, those who intend to vote for Democratic candidates in November, professionals, and Westerners.
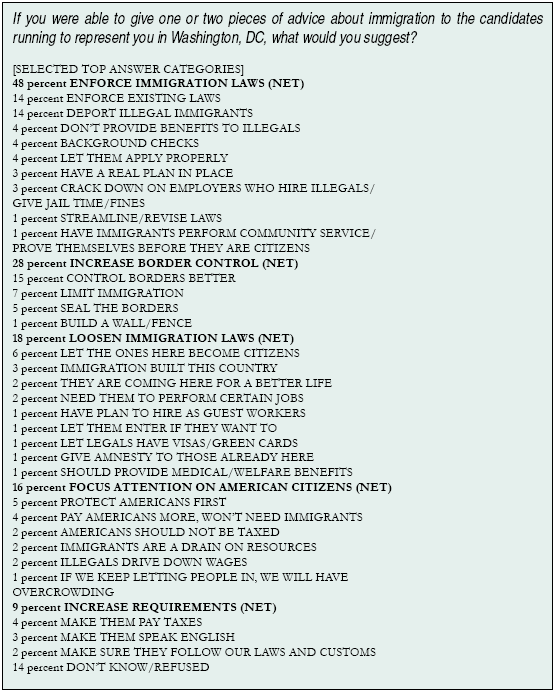
K. Final Advice to Candidates on Immigration: The Voters Speak
- Voters Call Upon Politicians to Step Up Enforcement of Immigration Laws. When given the opportunity to speak freely and advise candidates on immigration, voters overwhelmingly recommended tightening, rather than loosening, national standards.
The number one response given was strict enforcement of current immigrations laws – volunteered by nearly one-half (48 percent) of voters. Another 28 percent suggested tighter border control and 9 percent wanted to make it more difficult for immigrants to become citizens.
By comparison, just 18 percent thought Washington should relax immigration restrictions.
Just 14 percent were unsure or did not have anything to say – a number that easily approximates 30 percent-40 percent in questions about other public policy issues. This highlights again the fact that immigration is not a concern of the few. Rather, it is on the minds of voters of all regions, races, and registrations.
IV. In Conclusion…
Immigration is an important topic to American voters and one that will factor into their ballot box decisions this November. Overall, voters are dissatisfied with the current state of immigration (both legal and illegal) in this country and are calling upon lawmakers to take action. Of top priority is the strict attention to and enforcement of current immigration laws, including – but not limited to – securing the borders, which many feel have been ignored for too long.
American voters found the immigration policies proposed by the U.S. House of Representatives to be most appealing. They gravitated towards the combination of increased enforcement of existing laws, the addition of new restrictions on illegal immigration, and the maintenance of current legal immigration levels to be the best plan of the many tested. As is often the case, voters were drawn to the middle ground that the House plan represents, rejecting the policies they may have perceived as too harsh (e.g. mass round-ups and deportations) or too lax (e.g. amnesty and higher levels of legal immigration).
End Notes
1 In conjunction with this nationwide survey, shorter polls containing many of the same questions are being conducted in four states and ten Congressional districts. States: Pennsylvania, New Jersey, Montana, Missouri; Congressional Districts: Arizona-5, Colorado-7, Connecticut-4, Georgia-8, Indiana-8, Kentucky-4, Louisiana-3, Ohio-6, Pennsylvania-6, Texas-17.
2 Yearbook of Immigration Statistics: 2005. www.uscis.gov/graphics/shared/statistics/yearbook/index.htm and http://www.cis.org/sites/cis.org/files/articles/2003/back103.html .
3 Federation for American Immigration Reform www.fairus.org/site/DocServer/pop_projections.pdf?docID=901 .
4 www.cis.org/sites/cis.org/files/articles/2005/back805.html
