Download this Backgrounder as a pdf
Read the Panel Discussion Transcript
President Bush and some members of Congress have proposed legalizing illegal aliens and substantially increasing legal immigration. Economic theory predicts that increasing the supply of labor in this way will reduce earnings for natives in competition with immigrants. This study examines the economic impact of increases in the number of immigrant workers by their education level and experience in the work force, using Census data from 1960 through 2000. Statistical analysis shows that when immigration increases the supply of workers in a skill category, the earnings of native-born workers in that same category fall. The negative effect will occur regardless of whether the immigrant workers are legal or illegal, temporary or permanent. Any sizable increase in the number of immigrants will inevitably lower wages for some American workers. Conversely, reducing the supply of labor by strict immigration enforcement and reduced legal immigration would increase the earnings of native workers.
Among this Backgrounder’s findings:
- By increasing the supply of labor between 1980 and 2000, immigration reduced the average annual earnings of native-born men by an estimated $1,700 or roughly 4 percent.
- Among natives without a high school education, who roughly correspond to the poorest tenth of the workforce, the estimated impact was even larger, reducing their wages by 7.4 percent.
- The 10 million native-born workers without a high school degree face the most competition from immigrants, as do the eight million younger natives with only a high school education and 12 million younger college graduates.
- The negative effect on native-born black and Hispanic workers is significantly larger than on whites because a much larger share of minorities are in direct competition with immigrants.
- The reduction in earnings occurs regardless of whether the immigrants are legal or illegal, permanent or temporary. It is the presence of additional workers that reduces wages, not their legal status.
Introduction
After World War I, laws were passed severely limiting immigration. Only a trickle of immigrants has been admitted since then. . . By keeping labor supply down, immigration policy tends to keep wages high. Let us underline this basic principle: Limitation of the supply of any grade of labor relative to all other productive factors can be expected to raise its wage rate; an increase in supply will, other things being equal, tend to
depress wage rates.
— Paul Samuelson, Economics (1964)
What happens when immigration increases the supply of workers in a particular labor market? In his influential introductory textbook, Paul Samuelson gives the common-sense answer implied by the standard model of the labor market. Samuelson was writing just before the enactment of the 1965 amendments to the Immigration and Nationality Act — the major policy shift that initiated the resurgence of large-scale immigration — leading him to make the point that immigration restrictions tended "to keep wages high." He also stressed the mirror-image implication: as immigrants increase the supply of a particular type of labor (such as low-educated workers), the wage paid to that group falls.
More generally, immigration should lower the wages of competing workers and increase the wages of complementary workers, of workers whose skills become more valuable because of immigration. For example, an influx of foreign-born laborers reduces the economic opportunities for laborers — all laborers now face stiffer competition in the labor market. At the same time, high-skill natives may gain substantially. They pay less for the services that laborers provide, such as painting the house and mowing the lawn, and natives who hire these laborers can now specialize in producing the goods and services that better suit their skills.
In the United States, immigrants cluster in a small number of geographic areas. In 2000, for example, 34.5 percent of the working-age immigrant population lived in only three metropolitan areas (New York, Los Angeles, and Chicago). In contrast, only 10.5 percent of the comparable natives clustered in these three areas. Practically all empirical studies in the academic literature exploit this geographic clustering to measure the labor market impact of immigration.1
Earlier studies usually define a metropolitan area as the labor market that is being penetrated by immigrants.2 A typical study calculates a cross-city correlation measuring the relation between the native wage in a locality and the relative number of immigrants in that locality. A negative correlation, indicating that native wages are lower in markets penetrated by immigrants, would indicate that immigrants worsen the employment opportunities of competing native workers. Studies of this kind have generally shown that the estimated correlations cluster around zero, creating the conventional wisdom that immigrants have little impact on the labor market, perhaps because "immigrants do jobs that natives do not want to do."
More recent research raises two questions about the validity of interpreting near-zero cross-city correlations as evidence that immigration has no labor market impact. First, immigrants may not be randomly distributed across labor markets. If immigrants tend to cluster in cities with thriving economies, there would be a built-in spurious positive correlation between immigration and wages.
Second, natives may respond to the wage impact of immigration by moving their labor or capital to other cities. For example, native-owned firms see that cities in Southern California flooded by low-skill immigrants pay lower wages to laborers. Employers who hire laborers will want to relocate to those cities. The flow of jobs to the immigrant-hit areas cushions the adverse effect of immigration on the wage of competing workers in those localities.
Similarly, laborers living in Michigan were perhaps thinking about moving to California before the immigrants entered that state. These laborers learn that immigration reduced their potential wages in California and may instead decide to remain where they are or move elsewhere. Moreover, some Californians might leave the state to search for better opportunities.
The flow of jobs and workers tends to equalize economic conditions across cities. As a result, inter-city comparisons will not be very revealing; job flows and native migration effectively diffuse the impact of immigration across the national economy. In the end, all laborers, regardless of where they live, are worse off because there are now many more of them.
Because local labor markets adjust to immigration, the labor market impact of immigration may be measurable only at the national level. Research by the National Academy of Sciences, the Department of Labor, the Center for Immigration Studies, and others that examined the impact of immigration at the national level has concluded that immigration does adversely impact the wages of natives in competition with immigrants.3 I, too, examine the impact of immigration nationally, but introduce a new methodological approach. I examine how wages evolved for specific skill groups during the 1960-2000 period. I show that by analyzing national trends in the labor market and by defining skill groups in terms of both educational attainment and work experience, one can make substantial progress in determining whether immigration alters the employment and earnings opportunities of native workers.
To see how this approach can be used to measure the labor market impact of immigration, consider the following example. Recent immigration has increased the relative supply of high school dropouts substantially. The labor market implications of this increase clearly depend on how the distribution of work experience in the immigrant population contrasts with that of natives. After all, one particular set of native high school dropouts would likely be affected if all the new low-skill immigrants were very young, and a very different set would be affected if the immigrants were near retirement age. The approach introduced here exploits the fact that the age distributions of immigrants and natives differ substantially — even within a schooling group.
Data and Methods
The empirical analysis uses data drawn from the 1960, 1970, 1980, 1990, and 2000 Integrated Public Use Microdata Samples (IPUMS) of the Decennial Census. These surveys contain information on millions of native and foreign-born workers.4 The findings reported below summarize how immigration affected the labor market outcomes experienced by men aged 18 to 64.5
As noted above, I use both educational attainment and work experience to sort workers into particular skill groups. In particular, I classify the men into four distinct education groups: persons who are high school dropouts, high school graduates, persons who have some college, and college graduates.
I define work experience as the number of years that have elapsed since the person completed school.6 I group workers into eight different experience groups, indicating if the worker has 1-5 years of experience, 6-10 years, 11-15 years, and so on. There are, therefore, a total of 32 skill groups in the labor market (four education and eight experience groups).
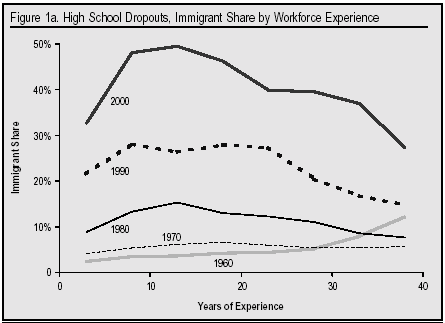
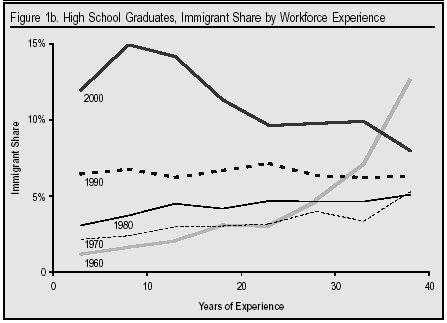
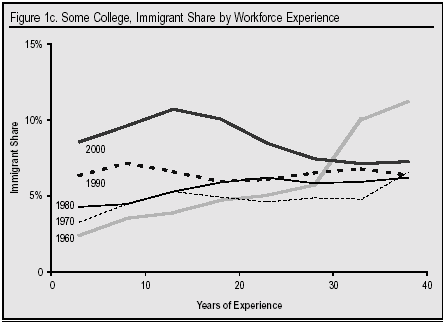
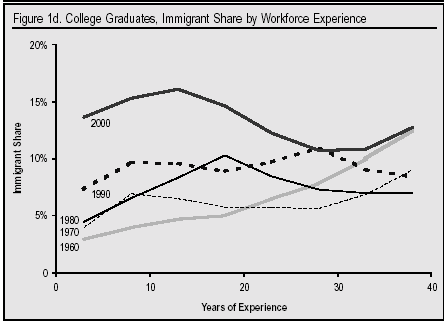
Figure 1 (bottom of page) reports the fraction of the skill group that is foreign-born at a particular point in time. There is a great deal of dispersion in the immigrant share, even within schooling groups. It is well known, for example, that immigration greatly increased the supply of high school dropouts in recent decades. What is less well known, however, is that this supply shift did not equally affect all experience groups within the population of high school dropouts. As Figure 1a. shows, immigrants made up nearly half of all high school dropouts with 10 to 20 years of experience in 2000, but only 30 percent of those with less than five years of experience. In 1960, however, the immigration of high school dropouts disproportionately increased the supply of the most experienced workers. Similarly, Figure 1d. shows that the immigrant supply shock for college graduates in 1990 was reasonably balanced across all experience groups, generally increasing supply by around 10 percent. But the supply shock for college graduates in 1960 was larger for the most experienced groups, while in 2000 it was largest for workers with five to 20 years of experience.
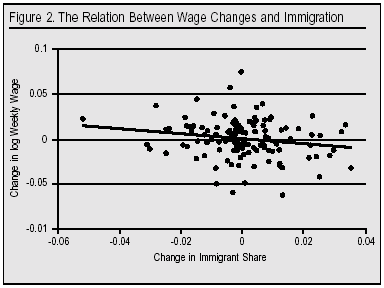
It is instructive to illustrate the strong link that exists between mean weekly earnings and the immigrant share across schooling-experience cells. In particular, I calculated the wage growth experienced by each skill group in each decade and the corresponding change in the immigrant share. Figure 2 (below) presents the scatter diagram relating these changes.7 The plot clearly illustrates a negative relation between wage growth and immigration: weekly wages grew fastest for workers in those skill groups that were least affected by immigration.
I used these data to estimate a statistical framework that relates changes in labor market outcomes for a particular group over each decade to the change in the immigrant share for that skill group. It is worth noting that this framework adjusts for changes in labor market conditions between 1960 and 2000 that might affect wages differentially for the various skill groups.
A simple statistical model for describing the link between wages and immigration can be obtained by stacking the data across skill groups and calendar years and estimating the regression equation:
yijt = b pijt + si +i> x j + Bt + (si × xj) + (si × Bt) + (xj × Bt) + nijt
where yijt is the dependent variable of interest, such as the mean earnings of workers with i years of schooling, j years of experience, at time t; pijt gives the fraction of the workforce in the particular skill group that is foreign-born; si is a vector of fixed effects indicating the group’s educational attainment, xj is a vector of effects indicating the group’s work experience, and Bt is a vector of fixed effects indicating the time period of the observation. The linear fixed effects control for differences in labor market outcomes across schooling groups, experience groups, and over time. The interactions (si × Bt) and (xj × Bt) control for the possibility that the impact of education and experience changed over time, and the interaction (si × xj) controls for the fact that the experience profile for a particular labor market outcome differs across schooling groups. For those interested in a more detailed mathematical explanation of the statistical model I employ, please see my November 2003 article in the uarterly Journal of Economics, which can be found at: http://ksghome.harvard.edu/~.GBorjas.Academic.Ksg/Papers/QJE2003.pdf.
Results
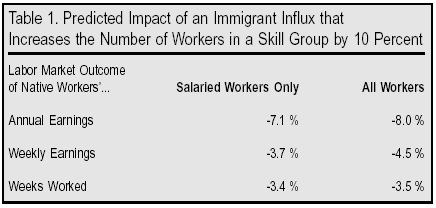
Table 1 summarizes the evidence by reporting what happens to various labor market outcomes when immigration increases the number of workers in a particular skill group by 10 percent. The table shows that immigration has a very strong effect on annual earnings. A 10 percent increase in the size of the skill group reduces annual earnings by 7.1 percent among salaried workers. This change in annual earnings arises because immigration reduces both weekly earnings and annual hours worked. Weekly earnings fall by 3.7 percent among salaried workers and by 4.5 percent if one includes the self-employed. Further, annual hours of work fall by about 3.5 percent. In sum, immigration has an adverse effect on both the wages and employment of competing native workers.
Impact Across Skill Groups
The results reported in Table 1 effectively measure the correlation that indicates how an increase in the number of immigrants lowers the wage of competing native workers. This approach, however, ignores the possibility that immigration into one skill group (say high school dropouts) alters the employment opportunities of workers in other skill groups (for example, college graduates).
The problem with estimating these "cross-effects" is that with 32 skill groups, there are over 500 cross-effects that need to be estimated. As a result, any study of these cross-effects must narrow the scope of the problem by relying on a theoretical model derived from economic theory. The typical approach used in the labor demand literature specifies a production function that delineates how various types of labor and capital interact in the production process, and estimates the implied parameters by assuming that workers are paid the value of their contribution to the firm’s revenue (a standard result in labor markets that are competitive).8
When applied to the wage trends observed between 1960 and 2000, this approach implies that a 10 percent increase in the number of workers in a particular skill group reduces the wage of workers in that skill group by 3.5 percent, reduces the wage of workers who have the same education but who differ in their experience by 0.7 percent, and increases the wage of workers with different educational attainment by 0.5 percent. The implications of these estimated wage effects are best illustrated by using a particular example: consider what happened to the wage structure as a result of the immigrant influx that entered the United States between 1980 and 2000.
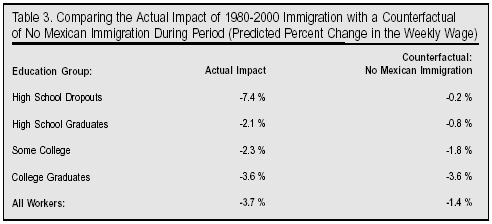
Table 2 summarizes the results of the simulation. As indicated by the bottom row of the table, the immigrant influx of the 1980s and 1990s lowered the wages of most native workers, particularly of those workers at the bottom and top of the education distribution. The wage fell by 7.4 percent for high school dropouts and by 3.6 percent for college graduates. In contrast, the wage of high school graduates and workers with some college fell by around 2 percent. Overall, the immigrant influx reduced the wage of the typical native worker by 3.7 percent.
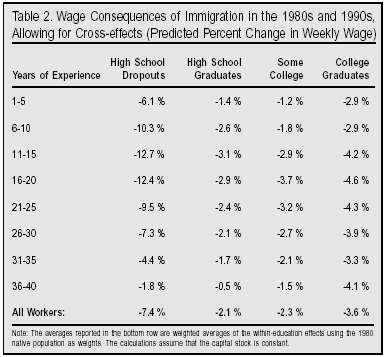
It is worth pointing out that these wage impacts imply sizable reductions in annual earnings. In 2000, for example, the typical native man without a high school diploma earned $25,000 annually. This implies that immigration reduced this worker’s earnings by around $1,800. Similarly, the typical male college graduate earned $73,000, implying that immigration reduced this worker’s wage by nearly $2,600.
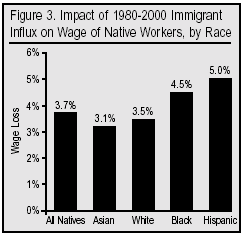
One can use the wage effects reported in Table 2 for each of the various education-experience groups to estimate the impact of immigration on native workers by race and ethnicity. Because the skill distribution of workers differs significantly across race groups, immigration will have a different net impact on each group.9 Figure 3 summarizes the evidence. Although the 1980-2000 immigrant influx lowered the wage of white workers by 3.5 percent and of Asians by only 3.1 percent, it reduced the wage of blacks by 4.5 percent and that of Hispanics by 5.0 percent. The adverse impact of immigration, therefore, is largest for the most disadvantaged native-born minorities.
The Bush Proposal
In January 2004, President Bush proposed an immigration plan that, if enacted, would have far-reaching labor market effects. The plan has three key components:
First, it would legalize the status of the approximately 10 million illegal aliens now present in the United States by creating a new type of temporary worker visa. This visa would have a term of three years and would be renewable for an unspecified number of times.
Second, temporary worker visas would be available to persons now living abroad who have been offered employment by an American employer. As the White House puts it, the plan "matches willing foreign workers with willing U.S. employers when no Americans can be found to fill the jobs." Although the proposal does not specify the number or allocation of temporary worker visas, the program would place many American workers in many different industries in direct competition with foreign workers.
Finally, the program would give temporary workers a path to permanent immigration by allowing them to apply for a green card, and would increase the total number of green cards available.
Native workers have already felt the labor market impact of the 10 million illegal aliens now living in the United States — and this impact is unlikely to change once the illegal immigrants are granted a form of amnesty. In fact, one can use the wage effects reported above to make an informed estimate of the labor market impact of the largest component of the existing stock of illegal immigrants — namely, the illegal immigration that originates in Mexico.
I simulated the model to predict a new set of labor market impacts under the counterfactual assumption that there had been no Mexican immigration (either legal or illegal) between 1980 and 2000. Table 3 summarizes the findings. It is clear that Mexican immigration, which is predominantly low-skill, accounts for virtually the entire adverse impact of immigration on low-skill native workers. It is also worth noting that the earnings of college graduates would fall by 3.6 percent regardless of whether or not there is a large influx of Mexican immigration. In other words, the influx of Mexican immigrants does not have a discernable beneficial impact on the wages of college graduates.
U.S. Citizenship and Immigration Services, part of the Department of Homeland Security, estimates that there were 4.8 million Mexican illegal aliens present in the country in 2000, making up about half of the 9.2 million Mexican immigrants counted by the 2000 Census. If illegal immigrants from Mexico were just as skilled as Mexican legal immigrants, this illegal immigrant population accounts for half of the 7.4 percent wage loss suffered by native high school dropouts. If Mexican illegal immigrants were relatively low-skill compared to their legal counterparts, Mexican illegal immigration accounts for an even larger fraction of the wage loss suffered by low-skill natives.
An important component of the Bush proposal is the new guestworker program, which opens up the door to many new foreign-born workers. This program will almost surely have an adverse effect on the earnings of native workers. The typical rationale provided for the guestworker program is that the country "needs" immigrants to keep many of its industries running. After all, many immigrants "do jobs that natives do not want to do."
These assertions are among the most persistent and hard-to-shake myths regarding the labor market impact of immigration. Supporters of the guestworker program argue that entire industries would vanish if American employers did not have access to cheap foreign labor. The vast majority of cab drivers in New York City are foreign-born (82 percent in the 2000 Census). Would all those yellow cars be piled up in some junkyard if those immigrants had not been admitted? Of course not. Fewer than 10 percent of the cab drivers in Cincinnati and Detroit are foreign-born. Nevertheless, the cab industry in those cities manages to survive and provide services to the local communities. It may cost a little more to ride those cabs, but the jobs get done.
What past immigration has done — and what the temporary worker program will continue to do on a potentially larger scale — is to depress wages and increase the profits of the firms that employ the
immigrants. The labor market effects documented in this paper suggest that the proposed temporary worker program will expose many more Americans to competition from foreign workers, will generate higher earnings losses for workers, and will lead to an even greater redistribution of wealth from labor to those who buy and use immigrant services.
Conclusion
The concern over the adverse labor market effects of immigration has always played a central role in the immigration debate. This Backgrounder introduces a new approach for estimating the wage effects of immigration. The approach stresses that the labor market impact of immigration needs to be measured at the national level and exploits the fact that — even within a particular schooling group — young immigrants are more likely to compete with young native workers than they are to compete with older native workers.
The study of the trends in the earnings of native workers over the 1960-2000 period indicates that immigration has indeed harmed their economic opportunities. The effect on wages, however, differs across education groups and race groups. For example, the immigrant influx that entered the country between 1980 and 2000 lowered the wage by 7.4 percent for high school dropouts, by 3.6 percent for college graduates, and by around 2 percent for both high school graduates and workers with some college. Of course, the impact is much larger for some specific experience groups within each educational category. Similarly, although this immigrant influx lowered the wages of white native workers by 3.5 percent, it lowered the wage of native-born blacks by 4.5 percent, and of native-born Hispanics by 5 percent.
It seems that Paul Samuelson was right after all: Wages fall when immigrants increase the size of the workforce.
Endnotes
1 Friedberg, Rachel M. and Jennifer Hunt. “The Impact of Immigration on Host Country Wages, Employment and Growth,” Journal of Economic Perspectives 9 (Spring 1995): 23-44.
2 The best known example is David Card’s, “The Impact of the Mariel Boatlift on the Miami Labor Market,” Industrial and Labor Relations Review 43 (January 1990): 245-257. Card compared labor market conditions in Miami and in other cities before and after the Marielitos increased Miami’s workforce by 7 percent. The data indicate that this sudden and unexpected immigrant influx did not have a discernable effect on employment and wages in Miami’s labor market.
3 Smith, James P. and Barry Edmonston, The New Americans: Economic, Demographic and Fiscal Effects of Immigration, The National Academy Press (1997). http://books.nap.edu/catalog/5779.html. It should be noted that Dr. Borjas worked on the research team that developed the National Academy of Sciences estimates.
See also David A. Jaeger, Skill Differences and the Effect of Immigrants on the Wages of Natives, Bureau of Labor Statistics Working Paper 273 (March 1996) and The Wages of Immigration: The Effect on the Low-skilled Labor Market (1998) published by the Center for Immigration Studies. The CIS report can be found online at www.cis.org/sites/cis.org/files/articles/1998/wagestudy/wages.pdf
4 The data contain a 1 percent random sample of the population in 1960 and 1970, and a 5 percent sample in 1980, 1990, and 2000.
5 A person is defined to be an immigrant if he was born abroad and is either a non-citizen or a naturalized
citizen; all other persons are classified as natives.
6 I assume that the age of entry into the labor market is 17 for the typical high school dropout, 19 for the typical high school graduate, 21 for the typical person with some college, and 23 for the typical college graduate, and restrict the analysis to persons who have between one and 40 years of experience.
7 The data summarized in the plot adjusts for decade effects as well as for interactions between the decade effects and education or experience.
8 In particular, I assume that the economy-wide production function can be represented in terms of a three-level CES technology, a specification that aggregates across different levels of work experience and education groups in order to form the national workforce (see Borjas, George J. “The Labor Demand Curve Is Downward Sloping: Reexamining the Impact of Immigration on the Labor Market,” The Quarterly Journal of Economics, November 2003, pp. 1359-1368). In this framework, the number of parameters that describe how immigrants into a particular skill group affect the wage of other skill groups depends on three different responses: how immigration in a particular skill group (say high school graduates with 20 years of experience) affects the earnings of native high school graduates with 20 years of experience; how the immigrants affect the wage of younger and older high school graduates; and how the immigrants affect the wage of workers in different education groups. I use the measure of weekly earnings that includes self-employed workers. The estimation of the labor demand functions is conducted using instrumental variables techniques, where the instrument is the fraction of the workforce that is foreign-born in a particular year and skill group. The estimated elasticity of substitution is 2.9 across experience groups and 2.3 across education groups.
9 In particular, I use the estimated wage effects for each education-experience group reported in Table 2 and estimate what the average impact would be for a particular race group by taking a weighted average, where the weights are given by the skill distribution of the race group (as of 1980).
Dr. Borjas is the Robert W. Scrivner Professor of Economics and Social Policy at the John F. Kennedy School of Government, Harvard University. This Backgrounder is an expansion of Dr. Borjas’ article, "The Labor Demand Curve Is Downward Sloping: Reexamining the Impact of Immigration on the Labor Market," published in the November 2003 issue of the Quarterly Journal of Economics (pp. 1335-1374). This Backgrounder updates and expands the earlier results, most notably by incorporating newly released public use data from the 2000 Census and estimating the impact of immigration on various ethnic groups.