Download a PDF of this Backgrounder
Steven A. Camarota is the Director of Research and Karen Zeigler is a demographer at the Center for Immigration Studies.

The Gang of Eight Senate immigration bill (S.744) passed last June would have roughly doubled the number of new foreign workers allowed into the country and legalized millions of illegal immigrants already in the United States. Both Tennessee senators — Lamar Alexander (R) and Bob Corker (R) — voted for it.
To put into context the possible effects of this legislation on Tennessee, the Center for Immigration Studies has analyzed recent government data on employment. The analysis shows that, since 2000, all of the net increase in the number of working-age (16 to 65) people holding a job in Tennessee has gone to immigrants (legal and illegal). This is the case even though the native-born accounted for 60 percent of the growth in the state’s total working-age population.
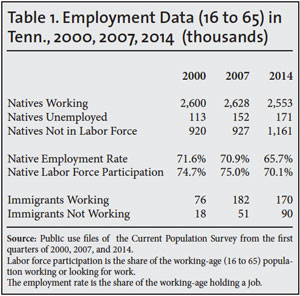
- The total number of working-age (16 to 65) immigrants (legal and illegal) holding a job in Tennessee increased by 94,000 from the first quarter of 2000 to the first quarter of 2014, while the number of working-age natives with a job declined by 47,000 over the same period.
- The fact that all of the long-term net gain in employment among the working-age population went to immigrants is striking because natives accounted for 60 percent of the increase in the total size of the state's working-age population.
- In the first quarter of this year, only 66 percent of working-age natives in the state held a job. As recently as 2000, 72 percent of working-age natives in Tennessee were working.
- Because the native-born population in Tennessee grew significantly, but the percentage working fell, there were nearly 300,000 more working-age natives not working in the first quarter of 2014 than in 2000.
- The supply of potential workers in Tennessee remains very large: In the first quarter of 2014, 1.3 million working-age natives were not working (unemployed or entirely out of the labor market), as were 90,000 working-age immigrants.
- While the share of working-age natives holding a job has improved in Tennessee somewhat since the jobs recovery began in 2010, the share working showed no improvement in the last year.1
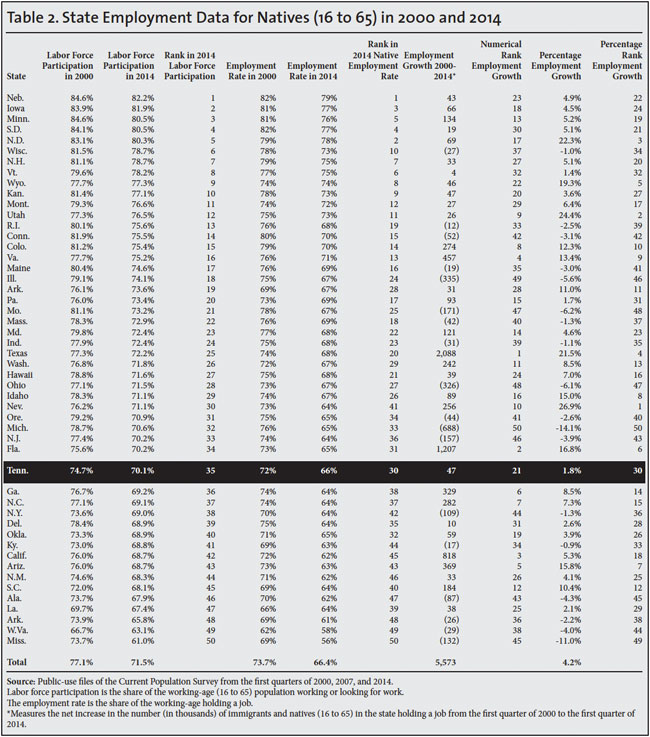
- Relative to other states, Tennessee ranked 30th in the nation in terms of the share of working-age natives holding a job in the first quarter of 2014.
- In terms of the labor-force participation rate (share working or looking for work) among working-age natives, the state ranked 35th in the nation.
- Two key conclusions from the state's employment situation:
- The long-term decline in the employment for natives in Tennessee and the enormous number of working-age natives not working clearly indicates that there is no general labor shortage in the state. So it is very difficult to justify the large increases in foreign workers (skilled and unskilled) allowed into the country through a bill like S.744 that many of the state's politicians support.
- Tennessee's working-age immigrant population grew 176 percent from 2000 to 2014, one of the highest of any state in the nation. Yet the number of natives working in 2014 was actually lower than in 2000. This undermines the argument that immigration increases job opportunities for natives.
Data Source
This analysis is based on the "household survey" collected by the government. The survey, officially known as the Current Population Survey (CPS), is the nation's primary source of information on the labor market.2 Many jobs are created and lost each quarter and many workers change jobs as well. But the number of people employed reflects the net effect of these changes. We focus on the first quarter of each year 2000 to 2014 in this analysis because comparing the same quarter over time controls for seasonality.
This analysis focuses on those 16 to 65 so that we can examine the labor force participation rate (share working or looking for work) and employment rate (share working) of native-born Americans.3 Labor force participation and the employment rate are measures of labor force attachment that are less sensitive to the business cycle than is the often-cited unemployment rate. The unemployed are only those who report that they have looked for a job in the four weeks prior to the survey. Immigrants or the foreign-born (legal and illegal) are individuals who are not U.S. citizens at birth. Prior research indicates that almost half of immigrants in the CPS in Tennessee are in the country illegally.4
End Notes
1 In the first quarter of 2013, 66 percent of working-age natives were employed in Tennessee; in the first quarter of 2014 it was 65.7 percent. This is not a statistically significant change.
2 We do not use the "establishment survey", which measures employment by asking businesses because that survey is not available to the public for analysis. Equally important, it does not ask if an employee is an immigrant.
3 Those 16 to 65 years of age account for some 95 percent of all workers. When examining the share working or in the labor force, it is necessary to limit the age range because although the under-16 and over-65 populations are quite large, only a small share work.
4 The Pew Hispanic Center estimated 140,000 illegal immigrants in Tennessee in 2010. The Federation for American Immigration Reform estimated 120,000. These are the newest estimates of illegal immigrants available for Tennessee. The total immigrant population in the state in 2010 was 289,000. The Department of Homeland Security and others have estimated that about 90 percent of illegal immigrants are included in Census Bureau data such as the CPS. Thus, in 2010 slightly less than half of the immigrant population was comprised of illegal aliens. The monthly CPS (2010 to 2014) shows very modest growth and no fundamental change in the composition of the state's immigrant population since 2010. Therefore the illegal share of this population in 2014 is almost certainly very similar to what it was in 2010.