Steven A. Camarota is the Director of Research and Karen Zeigler is a demographer at the Center for Immigration Studies.

The Gang of Eight immigration bill (S.744) passed by the Senate last June would have roughly doubled the number of new foreign workers allowed into the country, as well as legalized illegal immigrants already here. North Carolina Sen. Kay Hagen (D) voted for it. An analysis of government data by the Center for Immigration Studies shows that, since 2000, all of the net increase in the number of working-age (16 to 65) people holding a job in North Carolina has gone to immigrants (legal and illegal). This is the case even though the native-born accounted for 61 percent of growth in the state’s total working-age population.
Findings:
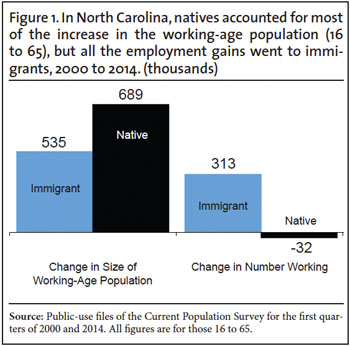
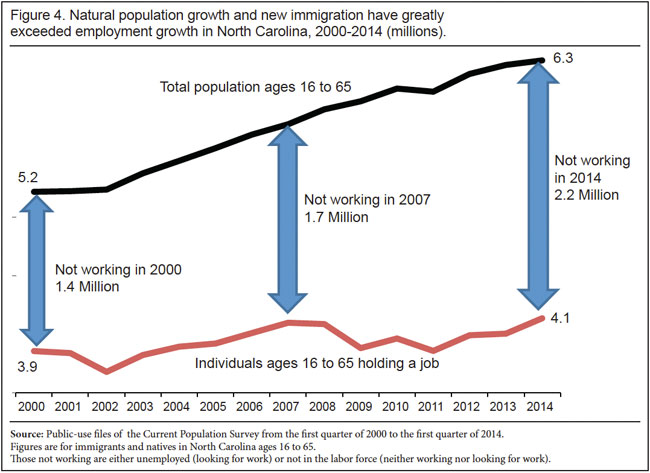
- The total number of working-age (16 to 65) immigrants (legal and illegal) holding a job in North Carolina increased by 313,000 from the first quarter of 2000 to the first quarter of 2014, while the number of working-age natives with a job declined by 32,000 over the same time.
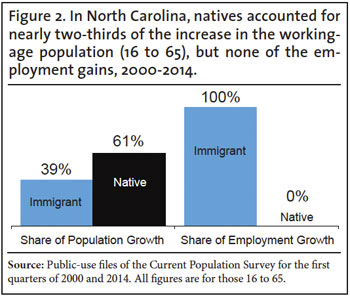
- The fact that all of the long-term net gain in employment among the working-age went to immigrants is striking because natives accounted for 61 percent of the increase in the total size of the state’s working-age population.
- In the first quarter of this year, only 64 percent of working-age natives in the state held a job. As recently as 2000, 74 percent of working-age natives in North Carolina were working.
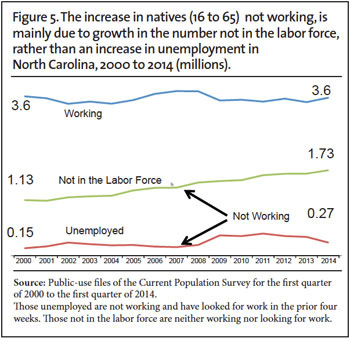
- Because the native working-age population in North Carolina grew significantly, but the share working actually fell, there were 720,000 more working-age natives not working in the first quarter of 2014 than in 2000 — a 56 percent increase.
- The supply of potential workers in North Carolina is very large: In the first quarter of 2014, two million working-age natives were not working (unemployed or entirely out of the labor market), as were 201,000 working-age immigrants.
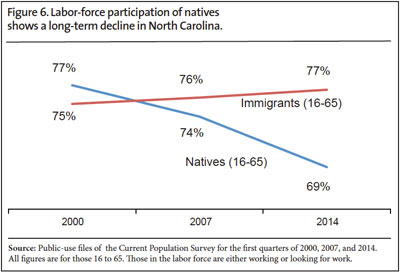
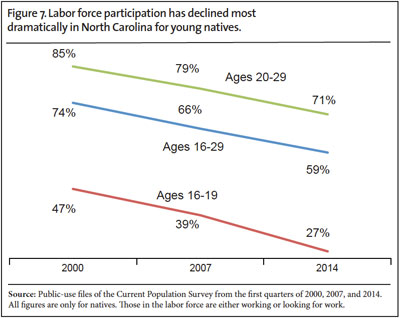
- Perhaps most troubling is that the labor-force participation rate (share working or looking for work) of working-age natives in North Carolina has continued to decline even after the jobs recovery began in 2010.
- In fact, the labor-force participation of natives in North Carolina shows a near uninterrupted 14-year decline.
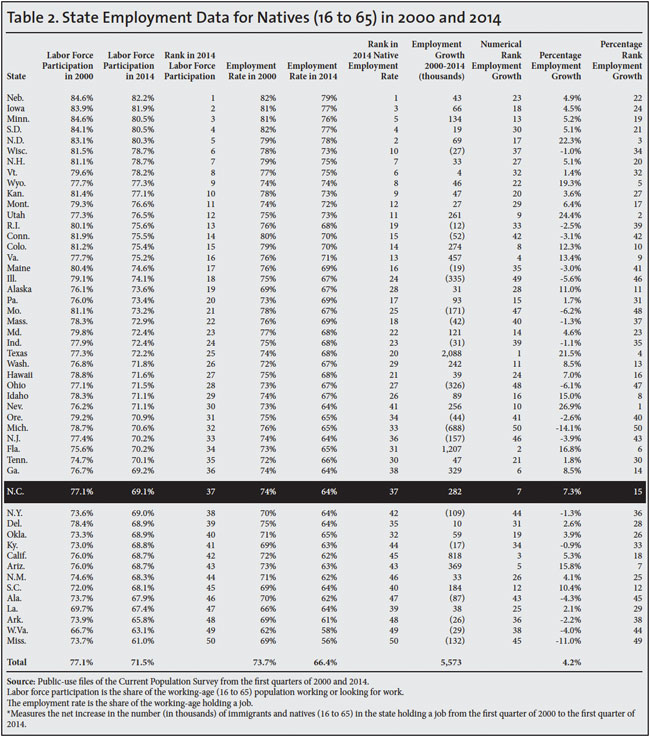
- In terms of the labor-force participation rate among working-age natives, the state ranks 37th in the nation.
- Two key conclusion from the state’s employment situation:
- First, the long-term decline in employment for natives in North Carolina and the enormous number of working-age natives not working clearly indicate that there is no general labor shortage in the state. Thus, it is very difficult to justify the large increases in foreign workers (skilled and unskilled) that would be allowed into the country in a bill like S.744 that many of the state’s politicians support.
- Second, North Carolina’s working-age immigrant population grew 146 percent from 2000 to 2014, one of the highest rates of any state in the nation. Yet the number of natives working in 2014 was actually lower than in 2000. This undermines the argument that immigration increases job opportunities for natives.
Data Source
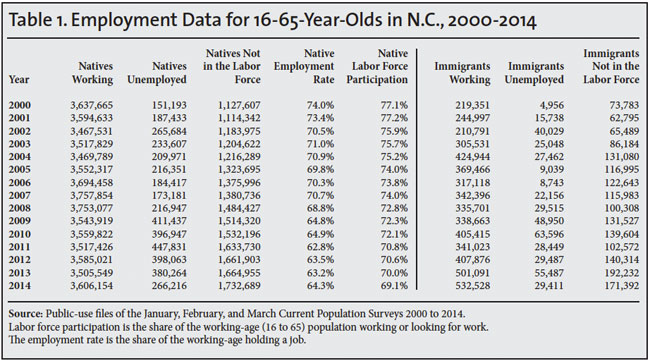
This analysis is based on the “household survey”, collected by the government. The survey, officially known as the Current Population Survey (CPS), is the nation’s primary source of labor market information.1 Many jobs are created and lost each quarter and many workers change jobs as well. But the number of people employed reflects the net effect of these changes. We focus on the first quarter of each year 2000 to 2014 in this analysis because comparing the same quarter over time controls for seasonality. We also emphasize the economic peaks in 2000 and 2007 as important points of comparison. However we also report figures for every first quarter between 2000 and 2014 in Table 1.
This analysis focuses on those 16 to 65 so that we can examine the labor-force participation rate (share working or looking for work) and employment rate (share working) of native-born Americans.2 Labor-force participation and the employment rate are measures of labor-force attachment that are less sensitive to the business cycle than the often-cited unemployment rate. Immigrants (legal and illegal) are individuals who are not U.S. citizens at birth. Prior research indicates that, of immigrants in the CPS, about half in North Carolina are illegally in the country.3

End Notes
1 We do not use the “establishment survey”, which measures employment by asking businesses, because that survey is not available to the public for analysis. Equally important, it does not ask if an employee is an immigrant. The Current Population Survey does not include those in institutions such as prisons.
2 Those 16 to 65 years of age account for some 95 percent of all workers. When examining the share working or in the labor force it is necessary to limit the age range because, although the under-16 and over-65 populations are quite large, only a small share of each work.
3 The Department of Homeland Security estimated 360,000 illegal immigrants in the state in 2012. The total immigrant population (legal and illegal, working and not working, of all ages) in the state in 2012 was 753,000, based on the American Community Survey (ACS). The Department of Homeland Security and others have estimated that about 90 percent of illegal immigrants are included in Census Bureau data such as the CPS and ACS. Thus, in 2012 about half of North Carolina’s immigrant population were illegal aliens. The monthly CPS (2012 to 2014) shows significant growth in the state’s total foreign born. Therefore, it is possible that the illegal share of the state’s population may have changed somewhat between 2012 and 2014.