Download a PDF of this Backgrounder.
Steven A. Camarota is the director of research and Karen Zeigler is a demographer at the Center.
On September 14, 2017, the Census Bureau released some data from the 2016 American Community Survey (ACS) that shows uneven growth in the immigrant population in the last year. The number of immigrants (legal and illegal) from the Middle East, Latin American countries other than Mexico, Asia, and Sub-Saharan Africa grew significantly, while the number from some places, such as Mexico, Europe, and Canada, grew not at all or even declined. The Census Bureau refers to immigrants as the foreign-born, which includes all those who were not U.S. citizens at birth. The Department of Homeland Security has previously estimated that 1.9 million immigrants are missed by the ACS, so the total immigrant population in 2016 was likely 45.6 million.1
Among the findings in the new data:
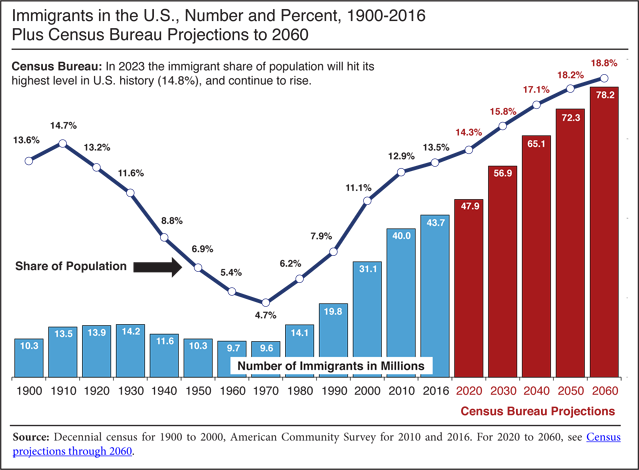
- The nation's immigrant population (legal and illegal) hit a record 43.7 million in July 2016, an increase of half a million since 2015, 3.8 million since 2010, and 12.6 million since 2000.
- As a share of the U.S. population, immigrants (legal and illegal) comprised 13.5 percent, or one out of eight U.S. residents in 2016, the highest percentage in 106 years. As recently as 1980, just one out of 16 residents was foreign-born.
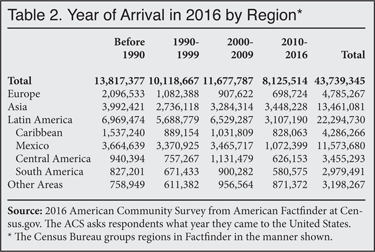
- Between 2010 and 2016, 8.1 million new immigrants settled in the United States. New arrivals are offset by the roughly 300,000 immigrants who return home each year and annual natural mortality of about 300,000 among the existing foreign-born population.2 As a result, growth in the immigrant population was 3.8 million 2010 to 2016.3
- In addition to immigrants, there were slightly more than 16.6 million U.S.-born minor children with an immigrant parent in 2016, for a total of 60.4 million immigrants and their children in the country.4 Immigrants and their minor children now account for nearly one in five U.S. residents.
- Mexican immigrants (legal and illegal) were by far the largest foreign-born population in the country in 2016. Mexico is the top sending country, with 1.1 million new immigrants arriving from Mexico between 2010 and 2016, or one out of eight new arrivals. However, because of return migration and natural mortality among the existing population, the overall Mexican-born population has not grown in the last six years.5
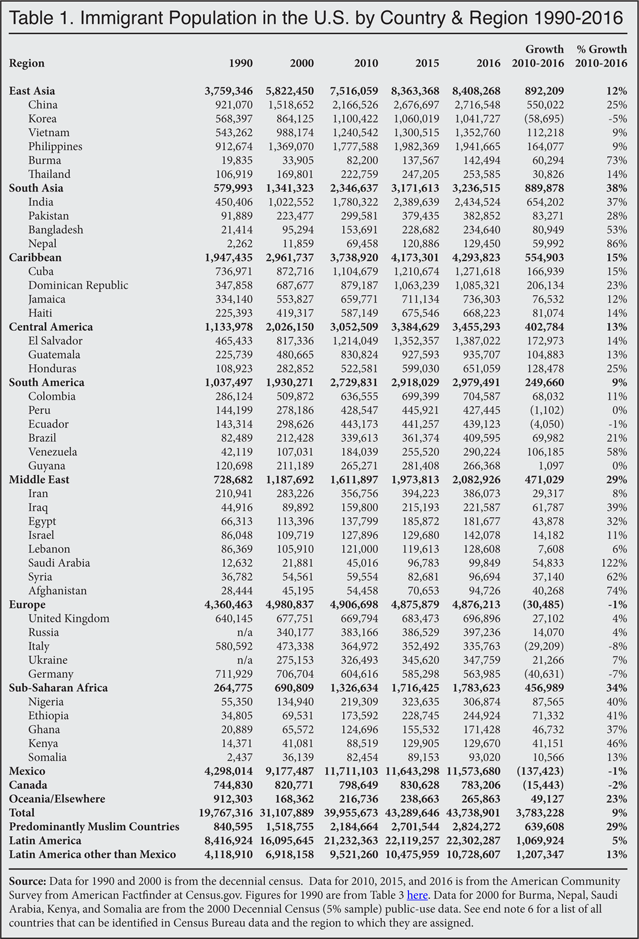
- The sending regions with the largest numerical increases in the number of immigrants living in the United States 2015 to 2016 were the Caribbean (up 120,522), the Middle East (up 109,113), Central America (up 70,664), Sub-Saharan Africa (up 67,198), South Asia (up 64,902), and South America (up 61,462).6
- Longer term, the regions with the largest numerical increases 2010 to 2016 were East Asia (up 892,209), South Asia (up 889,878), the Caribbean (up 554,903), the Middle East (up 471,029), Sub-Saharan Africa (up 456,989), Central America (up 402,784), and South America (up 249,660).
- The sending countries with the largest numerical increases since 2010 were India (up 654,202), China (up 550,022), the Dominican Republic (up 206,134), El Salvador (up 172,973), Cuba (up 166,939), the Philippines (up 164,077), Honduras (up 128,478), Vietnam (up 112,218), Venezuela (up 106,185), Guatemala (up 104,883), Nigeria (up 87,565), Pakistan (up 83,271), Haiti (up 81,074), Bangladesh (up 80,949), Jamaica (up 76,532), Ethiopia (up 71,332), Brazil (up 69,982), Colombia (up 68,032), Iraq (up 61,787), Burma (also known as Myanmar, up 60,294), Nepal (up 59,992), and Saudi Arabia (up 54,833).
- The sending countries with the largest percentage increases in the number of immigrants living in the United States since 2010 were Saudi Arabia (up 122 percent), Nepal (86 percent), Afghanistan (up 74 percent), Burma (up 73 percent), Syria (up 62 percent), Venezuela (up 58 percent), Bangladesh (up 53 percent), Kenya (up 46 percent), Ethiopia (up 41 percent), Nigeria (up 40 percent), Iraq (up 39 percent), Ghana (up 37 percent), India (up 37 percent), Egypt (up 32 percent), Pakistan (up 28 percent), and China (up 25 percent).
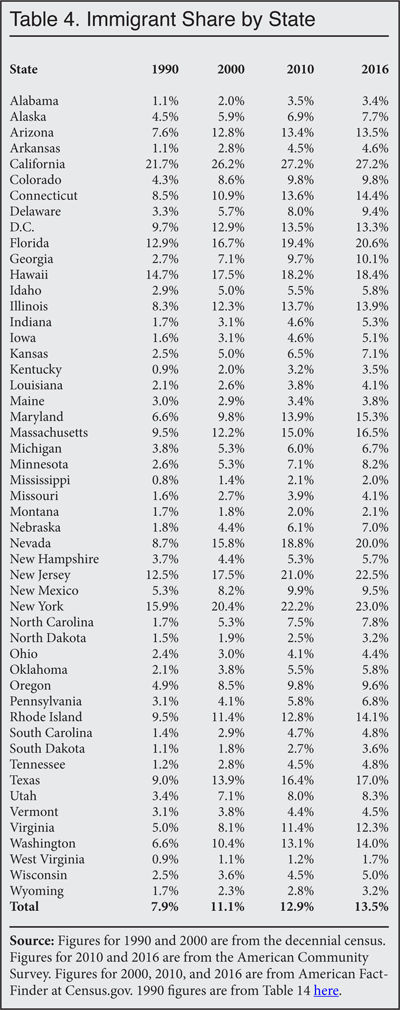
- The states with the largest numerical increases in the number of immigrants from 2010 to 2016 were Texas (up 587,889), Florida (up 578,468), California (up 527,234), New York (up 238,503), New Jersey (up 171,504), Massachusetts (up 140,318), Washington (up 134,132), Pennsylvania (up 131,845), Virginia (up 120,050), Maryland (up 118,175), Georgia (up 95,353), Nevada (up 78,341), Arizona (up 78,220), Michigan (up 74,532), Minnesota (up 73,953), and North Carolina (up 70,501).
- The states with the largest percentage increases in the number of immigrants 2010 to 2016 were North Dakota (up 48 percent), West Virginia (up 41 percent), South Dakota (up 39 percent), Delaware (up 24 percent), Nebraska (up 20 percent), Minnesota (up 20 percent), Wyoming (up 19 percent), Pennsylvania (up 18 percent), Alaska (up 16 percent), Indiana (up 16 percent), Florida (up 16 percent), Nevada (up 15 percent), Washington (up 15 percent), Iowa (up 15 percent), Maryland (up 15 percent), Massachusetts (up 14 percent), Texas (up 14 percent), Utah (up 13 percent), Wisconsin (up 13 percent), and Virginia (up 13 percent).
Data Source. On September 14, the Census Bureau released some of the data from the 2016 American Community Survey (ACS). The survey reflects the U.S. population as of July 1, 2016. The ACS is by far the largest survey taken by the federal government each year and includes over two million households.7 The Census Bureau has posted some of the results from the ACS to its American FactFinder website.8 It has not released the public-use version of the ACS for researchers to download and analyze. However, a good deal of information can be found at FactFinder. Unless otherwise indicated, the information in this analysis comes directly from FactFinder.
The immigrant population, referred to as the foreign-born by the Census Bureau, is comprised of those individuals who were not U.S. citizens at birth. It includes naturalized citizens, legal permanent residents (green card holders), temporary workers and foreign students, and illegal immigrants. It does not include those born to immigrants in the United States, including to illegal immigrant parents, or those born in outlying U.S. territories, such as Puerto Rico. Prior research by the Department of Homeland Security and others indicates that some 90 percent of illegal immigrants respond to the ACS. Thus all the figures reported above are for both legal and illegal immigrants.

End Notes
1 Bryan Baker and Nancy Rytina, "Estimates of the Unauthorized Immigrant Population Residing in the United States: January 2012", Office of Immigration Statistics within DHS, March 2013. See Table 2 on page 4.
2 In addition to asking about citizenship and country of birth, The ACS also asks immigrants what year they came to the United States.
3 It is possible to roughly estimate out-migration from the data released so far. Given the characteristics of immigrants by age, race, and sex, there were likely about 1.74 million deaths in this population 2010 to 2016. The number of new arrivals 2010 to 2016 was 8.13 million. However, this figure includes all of 2010 while growth 2010 to 2016 (3.78 million) in the ACS is measured from July 1, 2010, to July 1, 2016, which is the population control date for the survey. Excluding one-half of the new arrivals in 2010 so that arrivals correspond to the growth figures means new immigration from July to July equaled about 7.45 million. Out-migration can be estimated using the following formula: Outmigration = new arrivals – (growth + deaths). Plugging in the numbers we get the following: 1.93 million = 7.45 million – (3.78 million + 1.74 million). This implies a rough estimate of 1.93 million immigrants left the United States during the six years from 2010 to 2016, or about 320,000 annually. This figure includes legal and illegal immigrants.
4 The figure for immigrants is from the 2016 American Community Survey (ACS). The figure for children is from the public-use files of the 2016 and 2017 Current Population Survey Annual Social and Economic Supplement (CPS ASEC) and are for those under age 18 born in the United States with either a mother or father born outside of the United States. Unlike the ACS, the CPS ASEC does ask all respondents about their parents' places of birth, including children. The CPS ASEC is collected in March each year. The 2016 survey showed 16.5 million U.S.-born children with at least one immigrant parent and the 2017 survey showed 16.88 million kids. Based on the 2016 and 2017 CPS ASEC data there were 16.63 million U.S.-born minor children of immigrants in the country in July 2016.
5 Using the same method to estimate outmigration used in end note 3 indicates that roughly 630,000 people from Mexico returned home between 2010 and 2016. The one million new arrivals from that country means that the net migration of Mexican immigrants is not, as sometimes reported, zero. However, the net zero migration estimates that are often reported in the media include the U.S.-born children who go to Mexico with their immigrant parents. When American citizen children are counted then net migration from Mexico is roughly zero. There were also roughly 487,000 deaths among this population between 2010 and 2016.
6 Regions are defined in the following manner: East Asia: China (including Hong Kong and Taiwan), Japan, Korea, Cambodia, Indonesia, Laos, Malaysia, Burma, Philippines, Singapore, Thailand, Vietnam, Other South Eastern Asia, Other Eastern Asia, Asia n.e.c. South Asia: Bangladesh, India, Nepal, Pakistan, Sri Lanka. Caribbean: Bahamas, Barbados, Cuba, Dominica, Dominican Republic, Grenada, Haiti, Jamaica, St. Vincent and the Grenadines, Trinidad and Tobago, West Indies, Other Caribbean, Other Northern America. Central America: Belize, Costa Rica, El Salvador, Guatemala, Honduras, Nicaragua, Panama, Other Central America. South America: Argentina, Bolivia, Brazil, Chile, Colombia, Ecuador, Guyana, Peru, Uruguay, Venezuela, Other South America. Middle East: Afghanistan, Iran, Kazakhstan, Uzbekistan, Iraq, Israel, Jordan, Kuwait, Lebanon, Saudi Arabia, Syria, Yemen, Turkey, Egypt, Morocco, Sudan, Other Northern Africa, Other South Central Asia, Other Western Asia. Europe: United Kingdom, Ireland, Denmark, Norway, Sweden, Other Northern Europe, Austria, Belgium, France, Germany, Netherlands, Switzerland, Other Western Europe, Greece, Italy, Portugal, Spain, Albania, Belarus, Bulgaria, Croatia, Czech Republic, Slovakia, Hungary, Latvia, Lithuania, Macedonia, Moldova, Poland, Romania, Russia, Ukraine, Bosnia and Herzegovina, Serbia, Armenia, Other Southern Europe, Other Eastern Europe, Europe, n.e.c. Sub-Saharan Africa: Eritrea, Ethiopia, Kenya, Somalia, Other Eastern Africa, Cameroon, South Africa, Other Southern Africa, Cape Verde, Ghana, Liberia, Nigeria, Sierra Leone, Other Western Africa, Other Middle Africa, Africa n.e.c. Oceania/Elsewhere: Australia, Oceania, Pacific Islands, Fiji, and elsewhere. Predominately Muslim Countries includes the following: the Middle East (excluding Israel) as well as Bangladesh, Pakistan, Somalia, Indonesia, and Malaysia. Country list reflects 2010 and 2016; in 2000 the list of specific countries was less detailed.
7 Detailed information on the American Community Survey methodology, questions, and other topics on the can be found here.
8 Much of the data for the foreign-born used in this analysis can be found on FactFinder.