Read the most recent version of this report: https://cis.org/Report/Mapping-Impact-Immigration-Public-Schools
This analysis merges Census Bureau data with Google maps to provide a visual representation of immigration's impact on public schools at the local level.
Related Publications: Press Release, Panel Video, Panel Transcript
Download a PDF of this Backgrounder.
Steven A. Camarota is director of research, Bryan Griffith is multimedia director, and Karen Zeigler is a demographer at the Center for Immigration Studies.
This analysis merges Census Bureau data with Google maps to provide a visual representation of immigration's impact on public schools at the local level.1 The report is based on Public Use Microdata Areas (PUMAs), which average about 20,600 students, and allow for detailed analysis in densely populated areas. We also report statistics by state and metropolitan area. The findings show that the impact of immigration on public schools is truly enormous in many areas of the country.
The number of children from immigrant households in schools is now so high in some areas that it raises profound questions about assimilation. What's more, immigration has added enormously to the number of public school students who are in poverty and the number who speak a foreign language. This cannot help but to create significant challenges for schools, often in areas already struggling to educate students who come from disadvantaged backgrounds.
Among the findings:
- Almost one out of four (23 percent) public school students in the United States came from an immigrant household in 2015. As recently as 1990 it was 11 percent, and in 1980 it was just 7 percent.
- In 2015, between one-fourth and one-third of public school students from immigrant households were the children of illegal immigrants; the remainder were the children from legal immigrant households.2
- Immigrant households are concentrated; just 700 Census Bureau-designated PUMAs account for two-thirds of students from immigrant households, these same PUMAs account for nearly one-third of total public school enrollment.
- In these 700 immigrant-heavy areas, half the students are from immigrant households.
- There are many PUMAs in which well more than half of the students are from immigrant households, for example:
- 93 percent in Northeast Dade County, North Central Hialeah City, Fla.
- 91 percent in Jackson Heights and North Corona, New York City, N.Y.
- 85 percent in Westpark Tollway between Loop I-610 & Beltway Houston, Texas.
- 83 percent in El Monte and South El Monte Cities, Calif.
- 78 percent in Annandale & West Falls Church, Va.
- 74 percent in Fort Lee, Cliffside Park & Palisades Park, N.J.
- In the top 700 immigrant-heavy areas, one sending country typically predominates. On average, the top sending country accounts for 52 percent of students from immigrant households in these areas.3
- On average, students from immigrant households live in a PUMA in which 41 percent of their fellow public school students are also from immigrant households. In contrast, on average students from native households live in a PUMA in which 17 percent of students are from immigrant households.
- Immigration has added disproportionately to the number of low-income students in public schools. In 2015, 28 percent of public school students from immigrant households lived in poverty and they accounted for 30 percent of all students living below the poverty line.
- Immigrants often settle in areas of high poverty, adding to the challenges for schools in these areas. In the 200 PUMAs with the highest poverty rates in the country, where poverty among students averages 46 percent, nearly one-third of students are from immigrant households.
- Immigration has added enormously to the population of students who speak a foreign language. In 2015, 23 percent of public school students spoke a language other than English at home. This compares to 14 percent in 1990 and 9 percent in 1980.4
- On average, public school students who themselves speak a foreign language at home live in an area in which 42 percent of their fellow students also speak a foreign language at home.
- Though one language often predominates in an area, many local schools struggle to deal with a multiplicity of foreign languages, which likely creates enormous challenges. In 315 PUMAs (combined enrollment 6.7 million) 10 or more foreign languages are spoken by public school students.5
- In addition to adding large numbers of students in poverty and for whom English is not their first language, immigration also creates significant challenges for schools because immigrants have lower incomes, making it unlikely that tax revenue grows correspondingly with enrollment in areas of high immigration.6
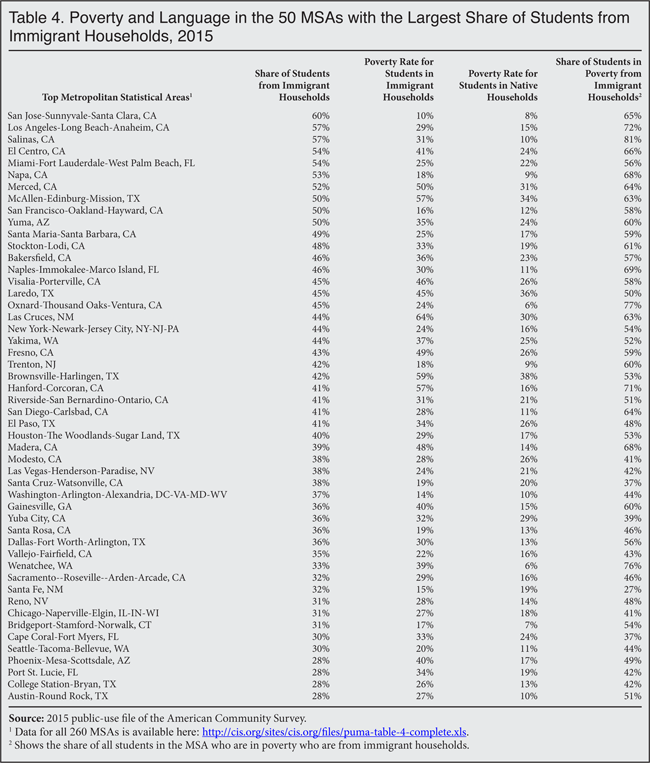
- Some of the metropolitan areas where students from immigrant households account for the largest share of enrollment include: San Jose-Sunnyvale-Santa Clara, Calif., 60 percent; Los Angeles-Long Beach-Anaheim, Calif., 57 percent; Miami-Fort Lauderdale-West Palm Beach, Fla., 54 percent; McAllen-Edinburg-Mission, Texas, 50 percent; San Francisco-Oakland-Hayward, Calif., 50 percent; Yuma, Ariz., 50 percent; Naples-Immokalee-Marco Island, Fla., 46 percent; Laredo, Texas, 45 percent; Las Cruces, N.M., 44 percent; New York-Newark-Jersey City, 44 percent; Yakima, Wash., 44 percent; Fresno, Calif., 43 percent; Trenton, N.J., 42 percent; Brownsville-Harlingen, Texas, 42 percent; Las Vegas-Henderson-Paradise, Nev., 38 percent; Washington-Arlington-Alexandria, 37 percent; Gainesville, Ga., 36 percent.
Discussion
One way that assimilation works is that the predominance of natives and their children makes the absorption of American culture and identity almost inevitable among immigrants and their children. If immigrants are a modest share of the local population it makes identifying with America and its culture practically unavoidable. But the level of immigration, most of it legal, has been so high in the last four decades that there are now whole sections of the country where natives and their children are actually the minority or nearly so. This has the potential to fundamentally change the terms of assimilation.
Of course, the country needs to educate children from immigrant households already in the country. Nearly one out of four children in public schools is from an immigrant household, so how these children do is vitally important not only to them, but to our country's future. It may also be worth pointing out that in 2015, 83.5 percent of these children were born in the United States.7 However, a key immigration policy question for our nation going forward is: Does it make sense to continue to admit a million additional legal permanent immigrants each year and to tolerate widespread illegal immigration without regard to the absorption capacity of our schools? This is true both in terms of our ability to educate as well as to assimilate children from immigrant backgrounds.
Figure and Tables
Figure 1 shows the growth in the share of students in public schools from immigrant households over the last 35 years. It also reports the share of students who speak a foreign language at home. The share of students from immigrant households has increased dramatically. While nearly one in four students in public schools today is from an immigrant household, as recently as 1980 it was only one in 14 students. Figure 1 also shows that the number of students who speak a foreign language at home has grown almost as much. This has been driven largely by immigration, with about three-quarters of students who speak a foreign language living in immigrant households.
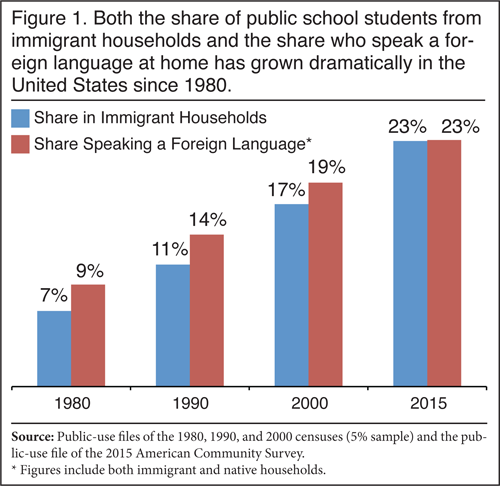
Table 1 shows the share of public school students in immigrant households by state in 1980, 1990, 2000, and 2015. The growth in many states has been astounding. Between 1980 and 2015 in Nevada, the share of students in immigrant households increased from 8 percent to 35 percent; in New Jersey the increase was 11 percent to 34 percent; in Arizona it went from 9 percent to 26 percent; and in Maryland it was 5 percent to 25 percent. Table 1 also reports poverty statistics for pupils in immigrant and native households in 2015. In many states, immigration has dramatically added to the number of low-income students. In California, 61 percent of public school students who are in poverty are from immigrant households, and it is 44 percent in Texas. In New Jersey it is 43 percent and 40 percent in Nevada. Perhaps more surprising is that students from immigrant households account for 36 percent of public school students in poverty in Colorado and Washington State and 39 percent in Minnesota. Table 1 also reports the share of students speaking a foreign language at home in 1980 and 2015. The growth in foreign language students roughly tracks the growth in the share from immigrant households. Looking at the language and poverty data it is clear that in many states across the country immigration has created very significant challenges for public schools by adding many students with special needs.
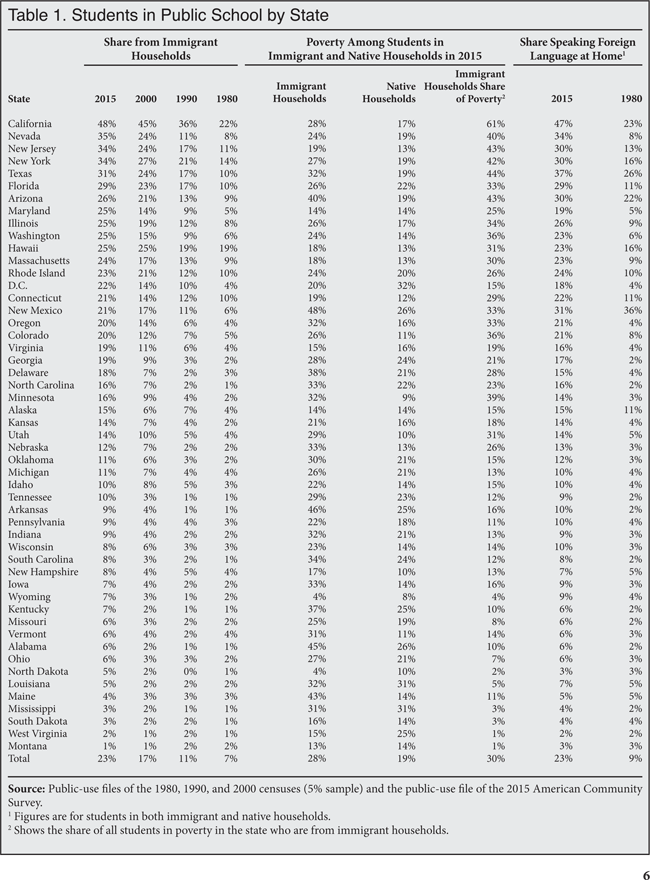
Table 2 shows the top two countries of origin with the most students in each state based on the country of birth of the household head. The table also shows the top two languages spoken at home by public school students. Table 2 reads as follows: of public school students in California, 48 percent are from immigrant households and of those students 59 percent live in a household headed by a Mexican immigrant. Nationally, Mexico is by far the top sending country and Spanish is by far the top foreign language. Averaging the share represented by the top sending country across states (including Washington, DC) shows that the leading country accounts for 40 percent of students on average in a state.
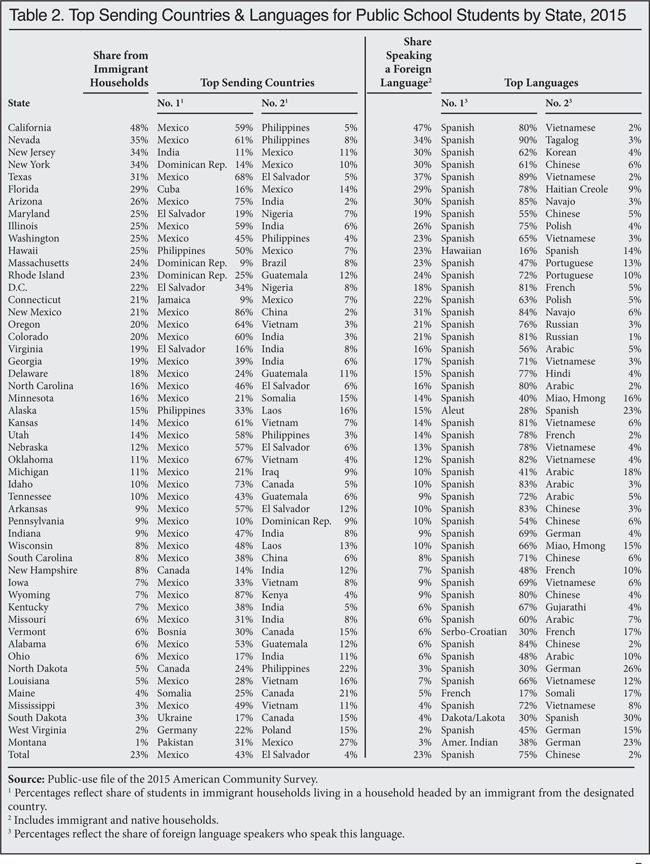
Table 3 reports the share of students in immigrant households for the nation's 260 Metropolitan Statistical Areas (MSAs) in 2015 and the top sending countries, again based on the country of birth of the household head. Table 3 also shows the share of students in public schools speaking a foreign language at home by MSA. The impact of immigration varies a great deal across MSAs. In 38 of the nation's 260 MSAs more than a third of students are from immigrant households, but in 40 of the nation's MSAs fewer than 5 percent of students are from immigrant households.
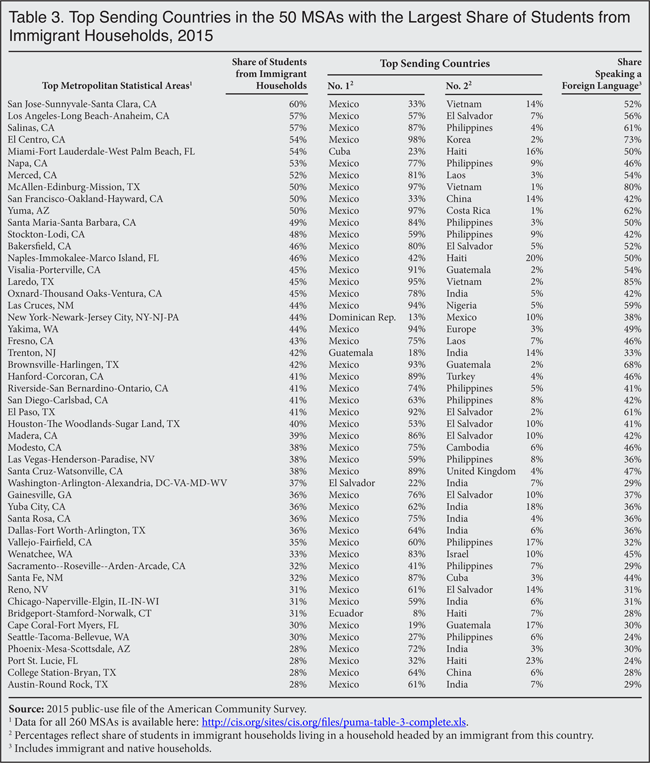
Table 4 shows poverty statistics by MSA for immigrant and native households. In more than half of the nation's MSAs, poverty for students from immigrant households is a good deal higher than that of natives. This is generally true in all of the areas where there is a large share of students in immigrant households. But there are some MSAs where poverty associated with natives in public schools is higher, though these are generally areas where immigrant households comprise a small or very small share of the public student population.
Methods and Data
The data for this Backgrounder comes primarily from the public-use file of the 2015 American Community Survey (ACS).8 The ACS has become one the most important sources of data on the size, growth, and socio-economic characteristics of the nation's immigrant population. In this analysis we use the terms "foreign-born" and "immigrant" synonymously. Immigrants are persons living in the United States who were not U.S. citizens at birth. This includes naturalized American citizens, legal permanent residents (green card holders), illegal aliens, and people on long-term temporary visas such as foreign students or guest workers, who respond to the ACS.
The public-use file of the 2015 ACS includes roughly 3.1 million respondents, nearly 367,000 of whom are immigrants. It is by far the largest survey conducted by the U.S. Census Bureau. The ACS asks individuals if they are enrolled in school and if the school is public or private. The survey also records the grade attended so it is a relatively straightforward matter to calculate the share of public school students who are from households headed by immigrants. The small number of students who are institutionalized are not included in this analysis. The survey also asks if a language other than English is spoken at home and the particular language spoken. We use the language questions to report foreign languages spoken at home by public school students. The poverty statistics reported here are also directly from the ACS public-use file.
The map is based on the nation's 2,351 Public Use Microdata Areas, as defined by the Census Bureau. The Bureau describes PUMAs as statistical geographic areas designed for the dissemination of data, particularly the ACS. They are contiguous, nested within states, built on county borders and have 100,000 to 200,000 residents — 137,000 on average. Of these residents, 20,600 are public school students on average. Though the size of high schools varies significantly across the country, PUMAs roughly cover an area that includes five to 10 high schools. Some PUMAs include a number of small counties, but in densely populated parts of the country there are typically many PUMAs within the same large county or city.9 This allows for a detailed look at the local level in the nation's metropolitan areas. PUMAs are the most detailed level of geographic data available on an annual basis from the Census Bureau.10 It should be noted that for the most part PUMAs do not correspond to school districts. However, since public schools draw their students from the area around them, this analysis does provide a look at the impact of immigration on public schools at the local level.
Detailed Local Maps
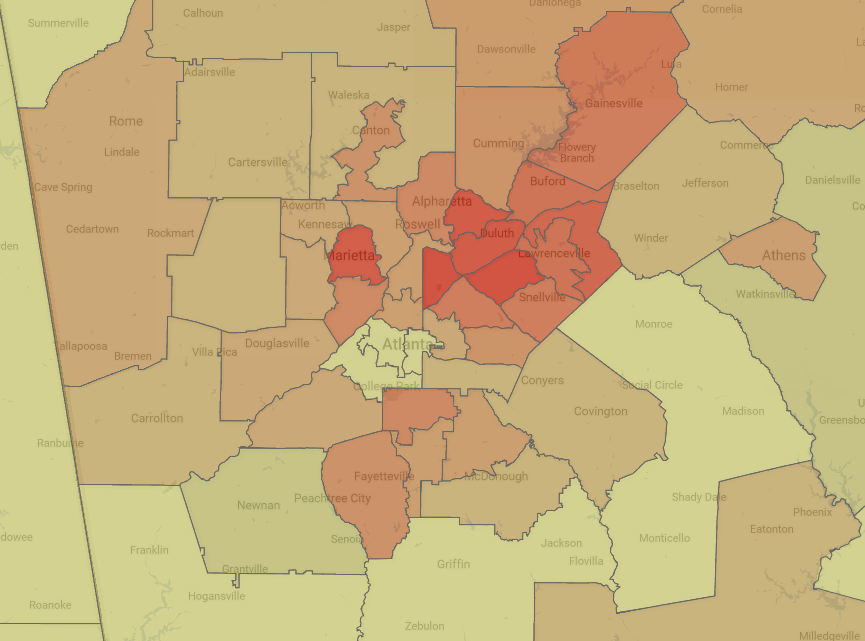
Atlanta
Full Screen
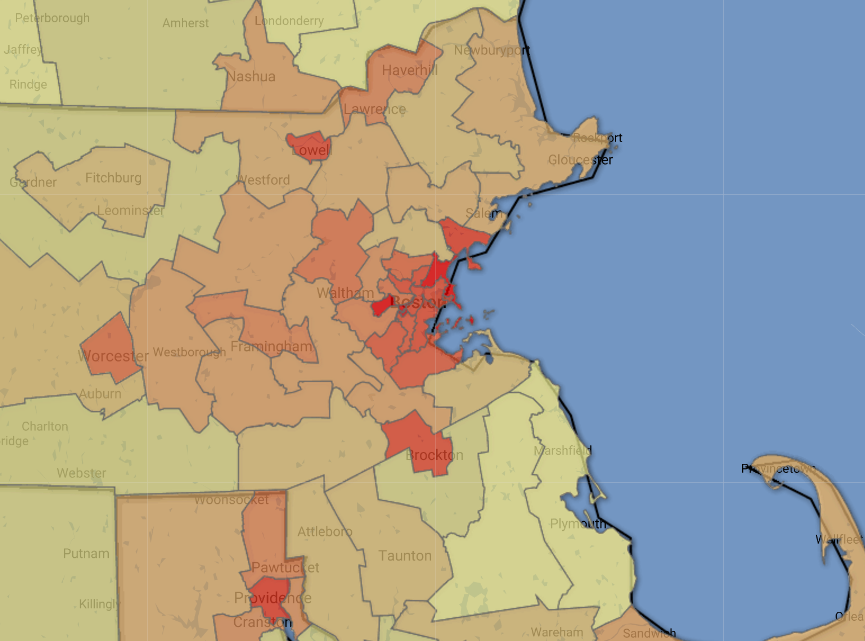
Boston
Full Screen
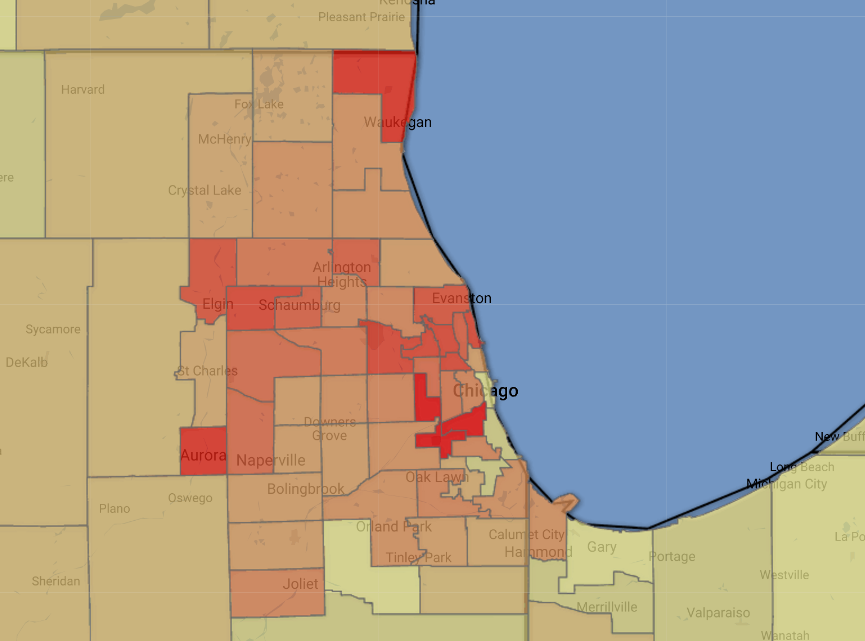
Chicago
Full Screen
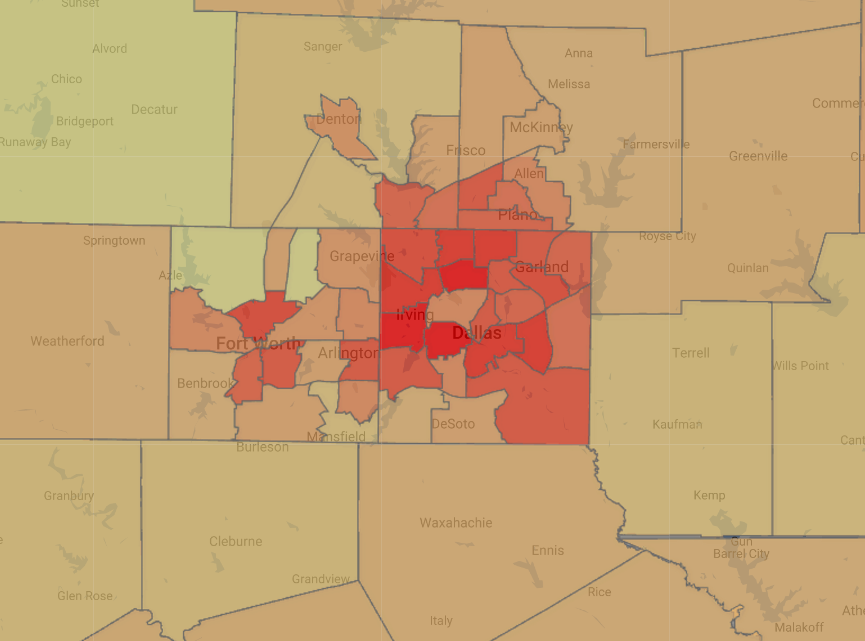
Dallas
Full Screen
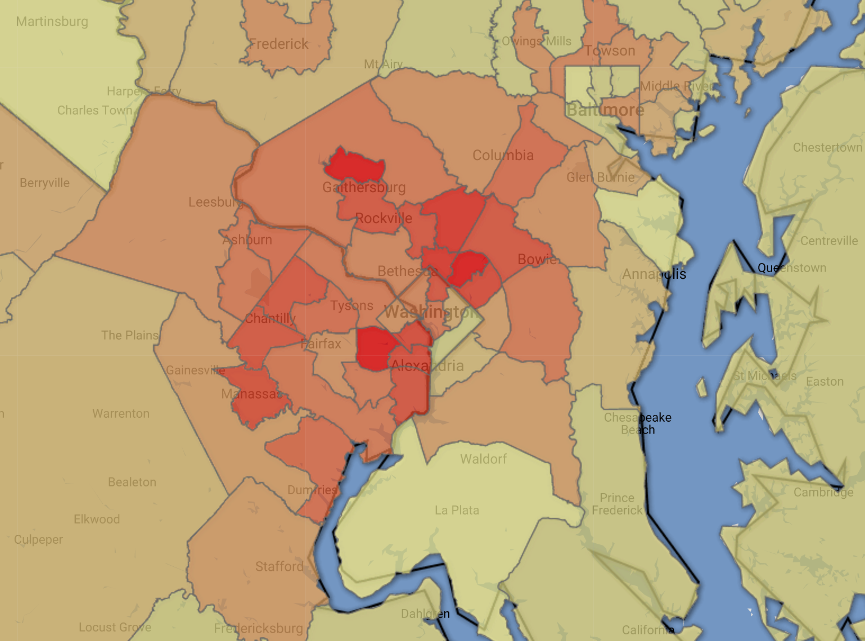
Washington
Full Screen
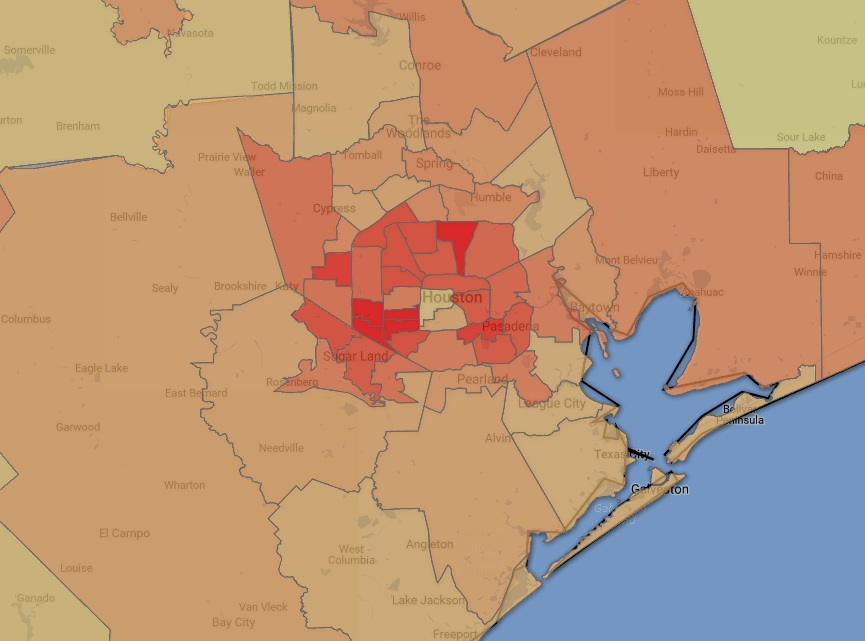
Houston
Full Screen
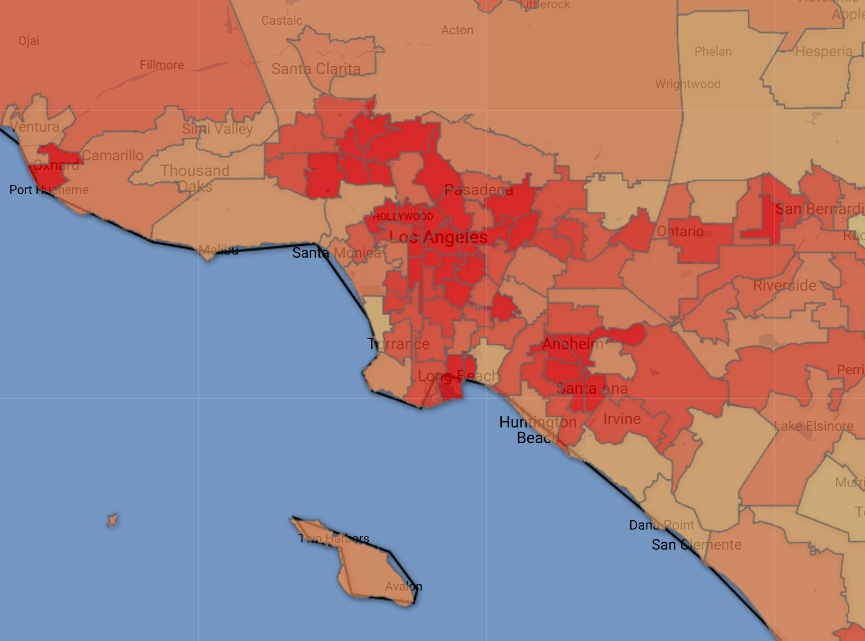
Los Angeles
Full Screen
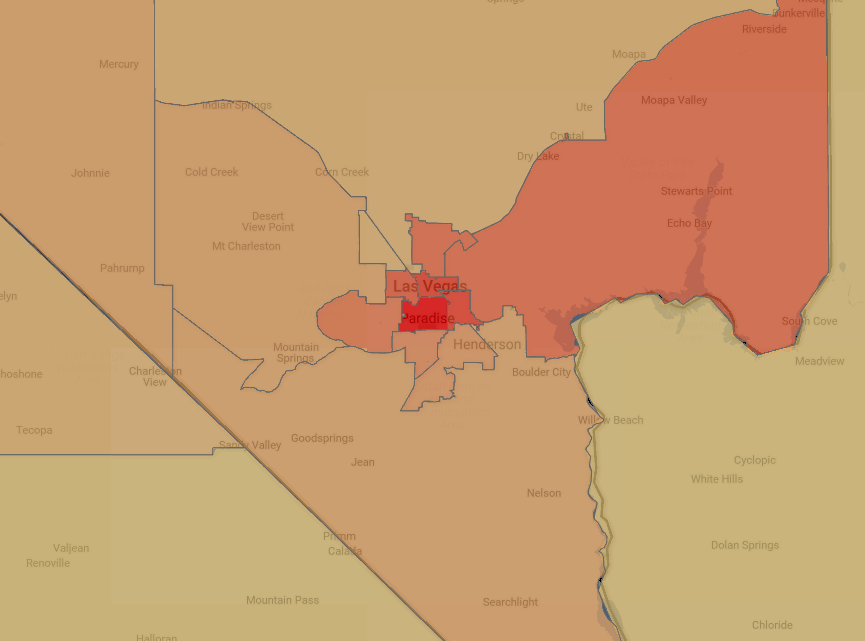
Las Vegas
Full Screen
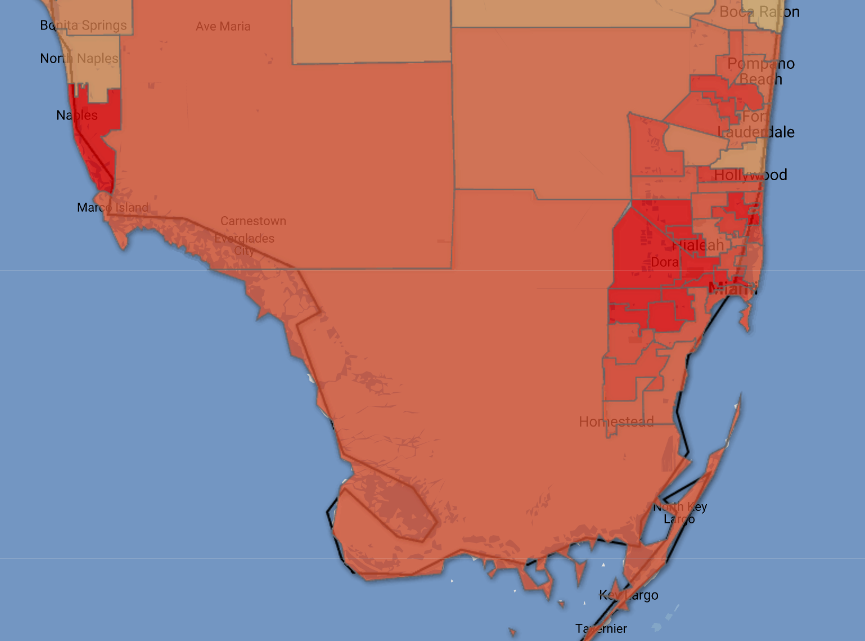
Miami
Full Screen
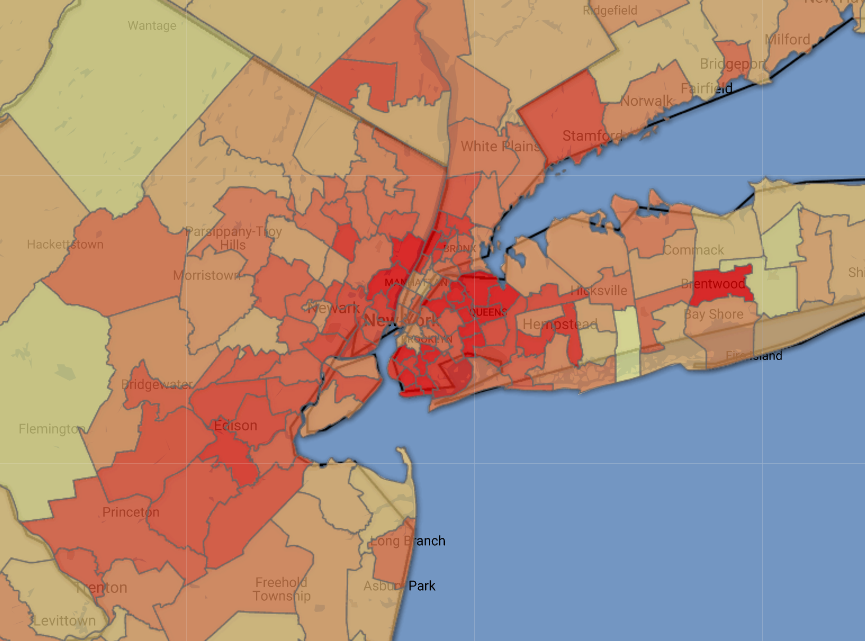
New York
Full Screen
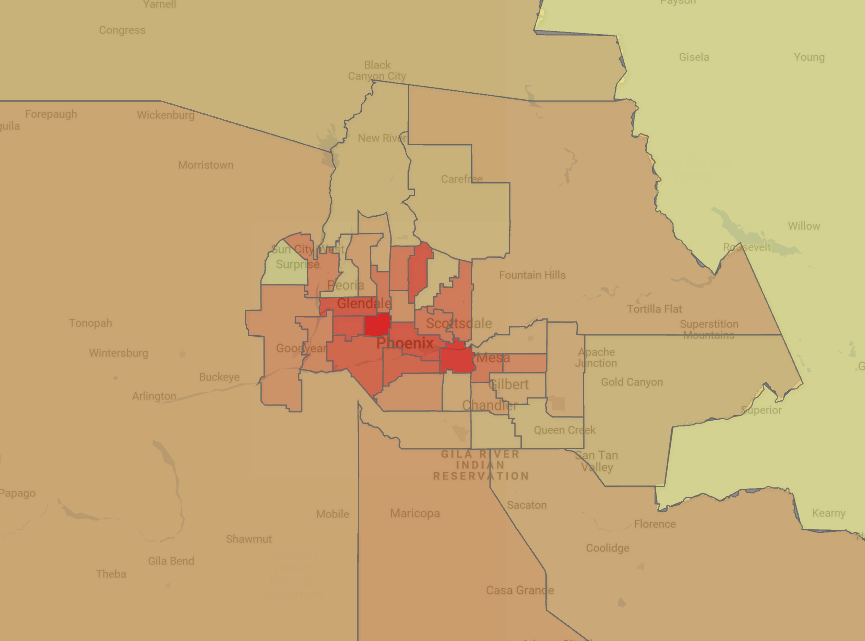
Phoenix
Full Screen
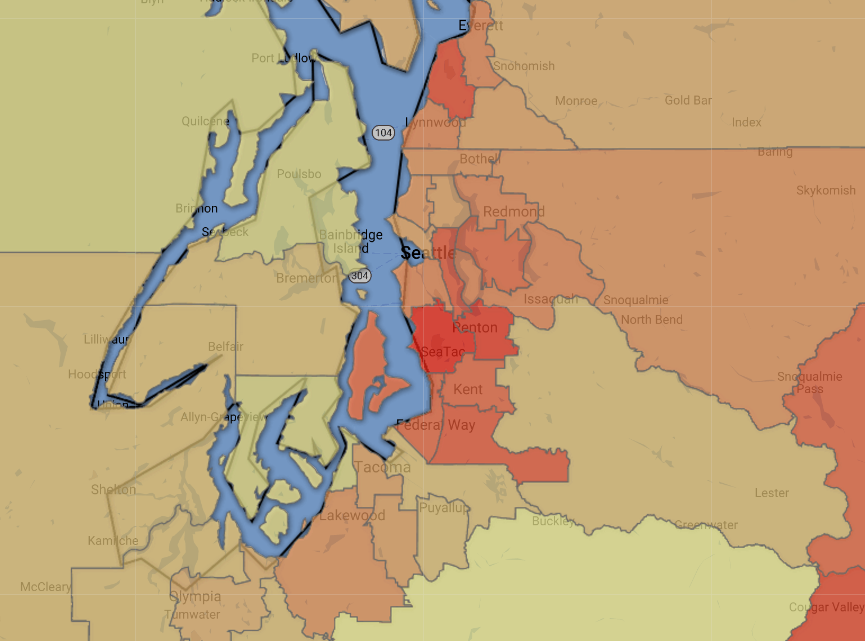
Seattle
Full Screen
End Notes
1 Google Fusion Tables was used to create this map. (Editor's Note (12/5/19) - Fusion Tables was shut down by Google in December 2019 and the maps were reproduced as KML files using QGIS)
2 Although legal status is not the focus of this analysis, in 2010 we estimate that 21.5 percent (Table 20) of all students in public schools were from immigrant households (legal and illegal), and 7 percent (Table 40) of school-age children were the children of illegal immigrants, slightly less than one-third of all students from immigrant households. As already noted, the share of public school students from immigrant households in 2015 was 22.8 percent and the share of students from illegal immigrant households is still likely slightly less one-third of the that total, or about 7.5 percent. See Steven A. Camarota, "Immigrants in the United States 2010: A Profile of America's Foreign-Born Population", Center for Immigration Studies, 2012.
3 Figures refer to the share of students from households headed by the top immigrant-sending country in the PUMA. So, for example, in North Central Hialeah City, 69 percent of public school students from immigrant households are headed by a Cuban immigrant — the top sending country for that PUMA.
4 In 2015, three-fourths of students who spoke a language other than English at home lived in immigrant-headed households.
5 The Census Bureau does not identify all of the languages spoken at home, so the actual number of languages spoken by public school students is higher than that reported here.
6 In 2015, there were 69 percent more public school students in the average immigrant household than in the average native household. But the median household income of immigrants in 2015 was 9 percent lower than the median income of native households. In 2015, there were 63 public school students per 100 immigrant households, compared to 37 students per 100 native households. (Put a different way, there were .63 students in the average immigrant household compared to .37 in the average native household.) The median household income of immigrants in the same year was $49,561 compared to $54,695 for natives. Part of the reason immigrant households have more public school students on average is that a larger share of immigrants are young and have school age children. Moreover, immigrants are much less likely to send their children to private school. In 2015, 12 percent of children enrolled in primary or secondary school in native households were in private school, compared to just 7 percent for children in immigrant households. Education figures come from the 2015 public-use file of the ACS. Median income figures come from the public-use file of the 2016 Annual Social and Economic Supplement of the Current Population Survey, which is collected by the Census Bureau and asks in March each year about income in prior calendar year.
7 Of public school students in native households, just 0.7 percent are foreign-born; though many more may have one immigrant parent.
8 The historical figures reported in the bullets and in Figure 1 for public school enrollment and language come from the public-use samples of the 1980, 1990, and 2000 Census long form and from the public-use file of the 2015 ACS. Tables 1 through 4 also rely on this same data. The 1990 public-use Census data available from the University of Minnesota Ipums website does not include the variable "GRADEATT" or "the grade or level of recent schooling for people who attended regular school or college at the time of the interview". Other years do include this variable. To create public school data for 1990, we use the age range 5-18, and we use the "EDUCD" variable indicating a respondents' educational attainment measured by the highest year of school completed. Public school attendance is available in the 1990 Census public-use data. We select those with less than or equal to a high school degree or GED. Comparisons with other censuses shows this approach produces estimates that closely match prior years. The estimate for 1990 is then multiplied by 99 percent to produce a 1990 public school estimate.
9 For more information on PUMAs and how they are created, see the Census Bureau website.
10 It is possible use public-use data to examine county-level data, but such data represents five years of pooled ACS data. (County data is available every year for the largest counties.) Census Bureau-designated tracts and blocks, which are smaller than PUMAs, also require five years of pooled ACS data. Further there is no public-use data from the ACS for these lower levels of geography; instead researchers are limited to information published for each tract and block by the Census Bureau. As a result, it would be difficult to report some of the statistics in this analysis, which is based on our direct analysis of public-use data from 2015.