Download a PDF of this Backgrounder.
Steven A. Camarota is the director of research and Karen Zeigler is a demographer at the Center.
This analysis shows that real (inflation-adjusted) median weekly earnings for U.S.-born workers without a bachelor’s increased more quickly during the period of lower legal and illegal immigration from 2016 to 2019 than in periods of higher immigration before and after. The period 2016 to 2019 is especially interesting because immigration (legal and illegal together) generally rises during economic expansions. But the economy grew significantly in the three years before Covid even as immigration fell, likely because of Trump administration policies. This combination of economic growth and lower immigration may have increased the earnings of less-educated U.S.-born workers. Since 2020, however, real earnings have declined for virtually all workers, which should give pause to those now calling for more immigration to reduce inflation by lowering wages further, particularly for lower-paid, less-educated Americans.
Among the findings:
- Between the fourth quarters of 2016 and 2019, real (inflation-adjusted) weekly earnings for full-time, U.S.-born workers without a bachelor’s grew 3.2 percent. During this time, growth in the total immigrant population (legal and illegal) averaged about 400,000 a year, compared to about 730,000 a year from 2012 to 2016, when earnings actually fell slightly for the less-educated U.S.-born.
- The labor force participation rate — the share of working-age adults employed or looking for work — also increased for the less-educated U.S.-born between the fourth quarters of 2016 and 2019. In contrast, there was little improvement in the years prior to 2016, after the rate bottomed out in 2013 as a result of the Great Recession.
- The rise in earnings and labor force participation, particularly for the less-educated, along with low inflation and the overall good economic conditions from 2016 to 2019 runs counter to the often-made argument that the U.S. economy requires very high levels of immigration to prosper.
- Among the U.S.-born with at least a bachelor’s, real weekly earnings growth did not vary with the level of immigration. Their earnings increased in both the period of higher immigration from 2012 to 2016 (3.3 percent) and lower immigration from 2016 to 2019 (1.1 percent).
- Among immigrants (legal and illegal) without a bachelor’s, real median weekly earnings increased substantially from 2012 to 2016, while they grew more modestly from 2016 to 2019. The same pattern holds for more educated immigrants. However, given the sample size of the earnings data for immigrants, these results should be interpreted with caution.
- Real weekly earnings for virtually all workers, immigrant and U.S.-born, declined from 2020 to 2022. This almost certainly reflects the very high inflation in this time period, though this decline in earnings coincides with a dramatic rebound in the immigrant population, which increased 1.8 million in a single year, 2021 to 2022.
- In the fourth quarter of 2022, the median weekly earnings for full-time, U.S.-born workers without a bachelor’s was only 59 percent as much as the median earnings for the full-time, U.S.-born workers with at least a bachelor’s.
- In a number of lower-paid occupational categories done predominately by workers without a bachelor’s, median earnings (for immigrants and the U.S.-born) are less than half that of the typical worker with a bachelor’s, including health care support, food preparation and service, and building and grounds cleaning and maintenance.
Introduction
This analysis reports usual weekly earnings for full-time workers on a quarterly basis using the government’s household survey from 2012 to 2022. We compare the fourth quarter of each year over the last decade to control for seasonality. The major difference between this report and those from the Bureau of Labor Statistics (BLS) on quarterly earnings is that we break out the foreign-born separately from the U.S. born.1 Throughout this report, we use the terms “immigrant” and “foreign-born” interchangeably. Immigrants include all those who were not U.S. citizens at birth, such as naturalized citizens, permanent residents, long-term visitors (e.g. guestworkers and foreign students), and illegal immigrants.2
We focus on U.S.-born workers without a bachelor’s degree because such workers have generally not done well in recent decades in terms of labor force participation or earnings. Throughout this report, we alternatively refer to such workers as the “less-educated” or “non-college-educated”. These workers earn only a fraction of the more educated. They make up the majority (84 percent) of the working poor.3 Moreover, nearly all of the children (98.6 percent) of the working poor are supported by someone without a bachelor’s. Of course, many people without a bachelor’s are middle-class and some have very high incomes. But overall, the non-college-educated make up the overwhelming share of low-income adults and are the primary beneficiaries of the government’s efforts to uplift those in or near poverty.
The period from 2016 to 2019 was a time when immigration declined, while the economy expanded, whereas in the past immigration generally rose during good economic times. We find that the earnings of non-college-educated, U.S.-born workers rose during this period more than in the prior period of higher immigration. We also find that the real earnings for virtually all workers were significantly lower in the fourth quarter of 2022 than in the fourth quarter of 2020, when inflation began to spike. Reducing wages further, particularly in jobs that are already lower-paying and where most of the workers are less-educated, seems unwise.
Trends in Immigration
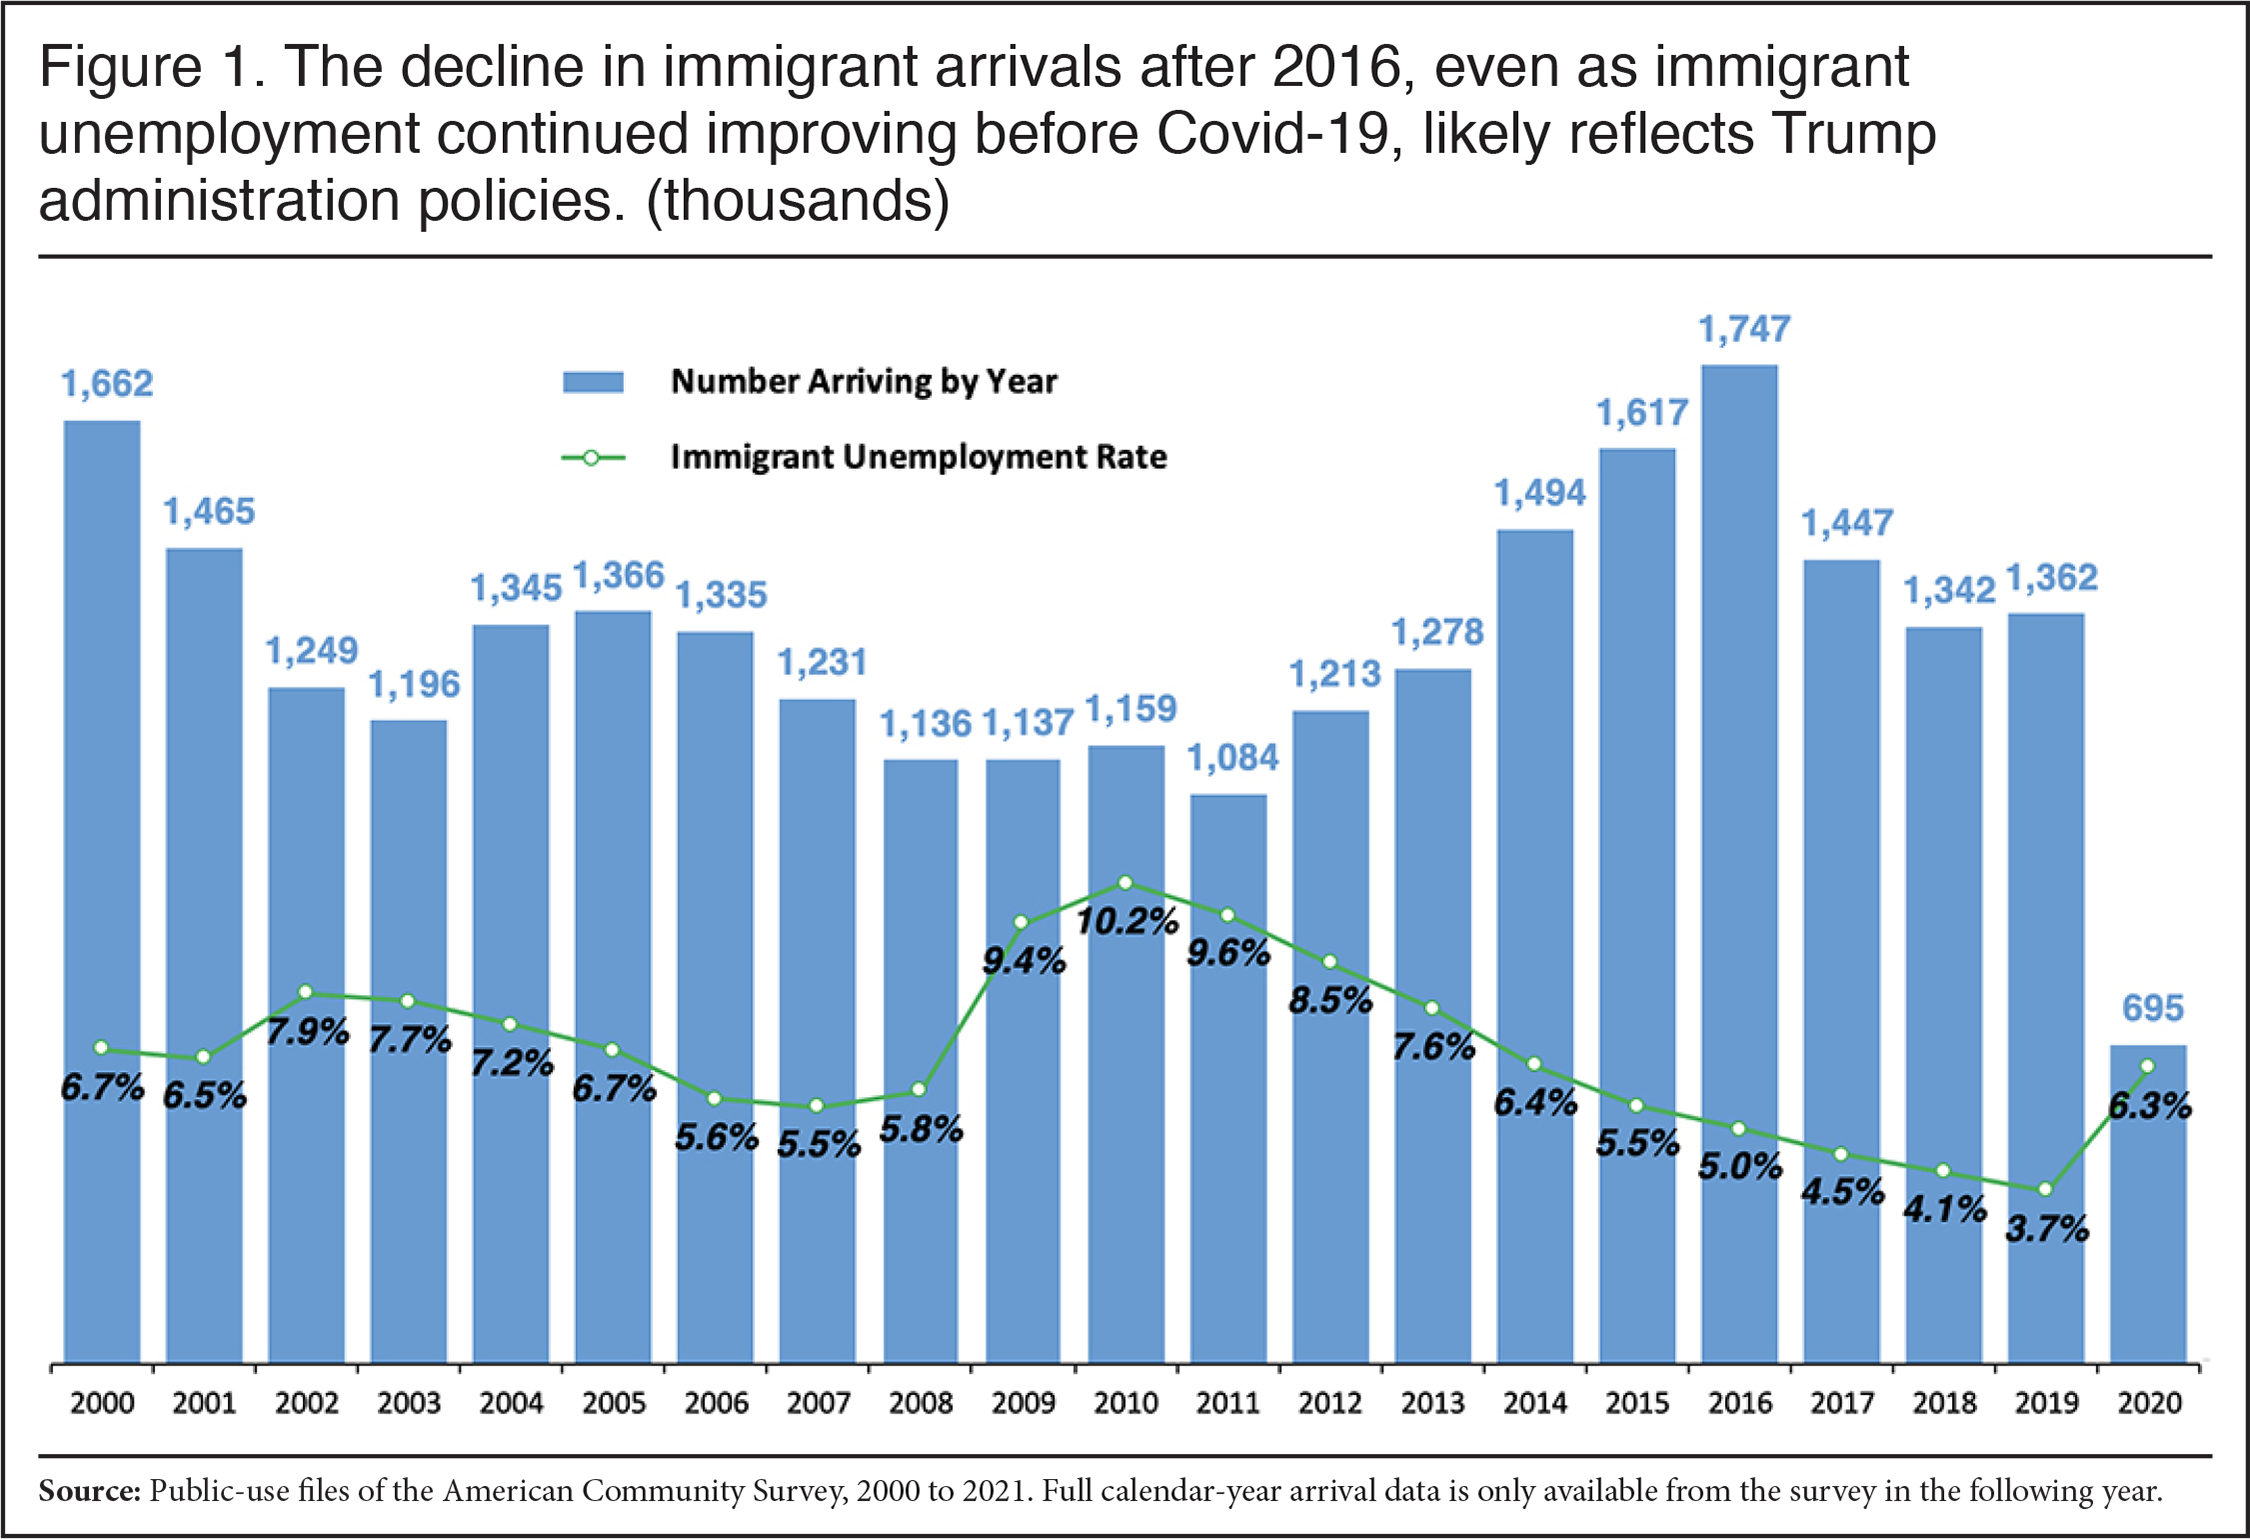
The Slowdown in Immigration Pre-Covid. Figure 1 looks at the number of immigrants (legal and illegal) who arrived each year based on the American Community Survey (ACS) and the national unemployment rate, which is a reasonable proxy for the overall state of the economy.4 Figure 1 shows that the number of newcomers generally increased as unemployment fell over the last two decades, except for the years immediately before Covid, when both unemployment and the number of new immigrant arrivals went down. In addition to a slowdown in new arrivals, in our prior work we have also argued that there was an increase in emigration. The Census Bureau’s estimate of net international migration — the difference between the number of people settling in the U.S. and leaving — also shows a downturn after 2016. As a result, the foreign-born population grew more slowly from 2016 to 2019, as shown in Figure 2.5 The change in the size of the foreign-born population is an important measure of immigration and its potential impact on the labor market because it reflects not just new arrivals but also emigration, though natural mortality among the existing population is also a factor.6
 |
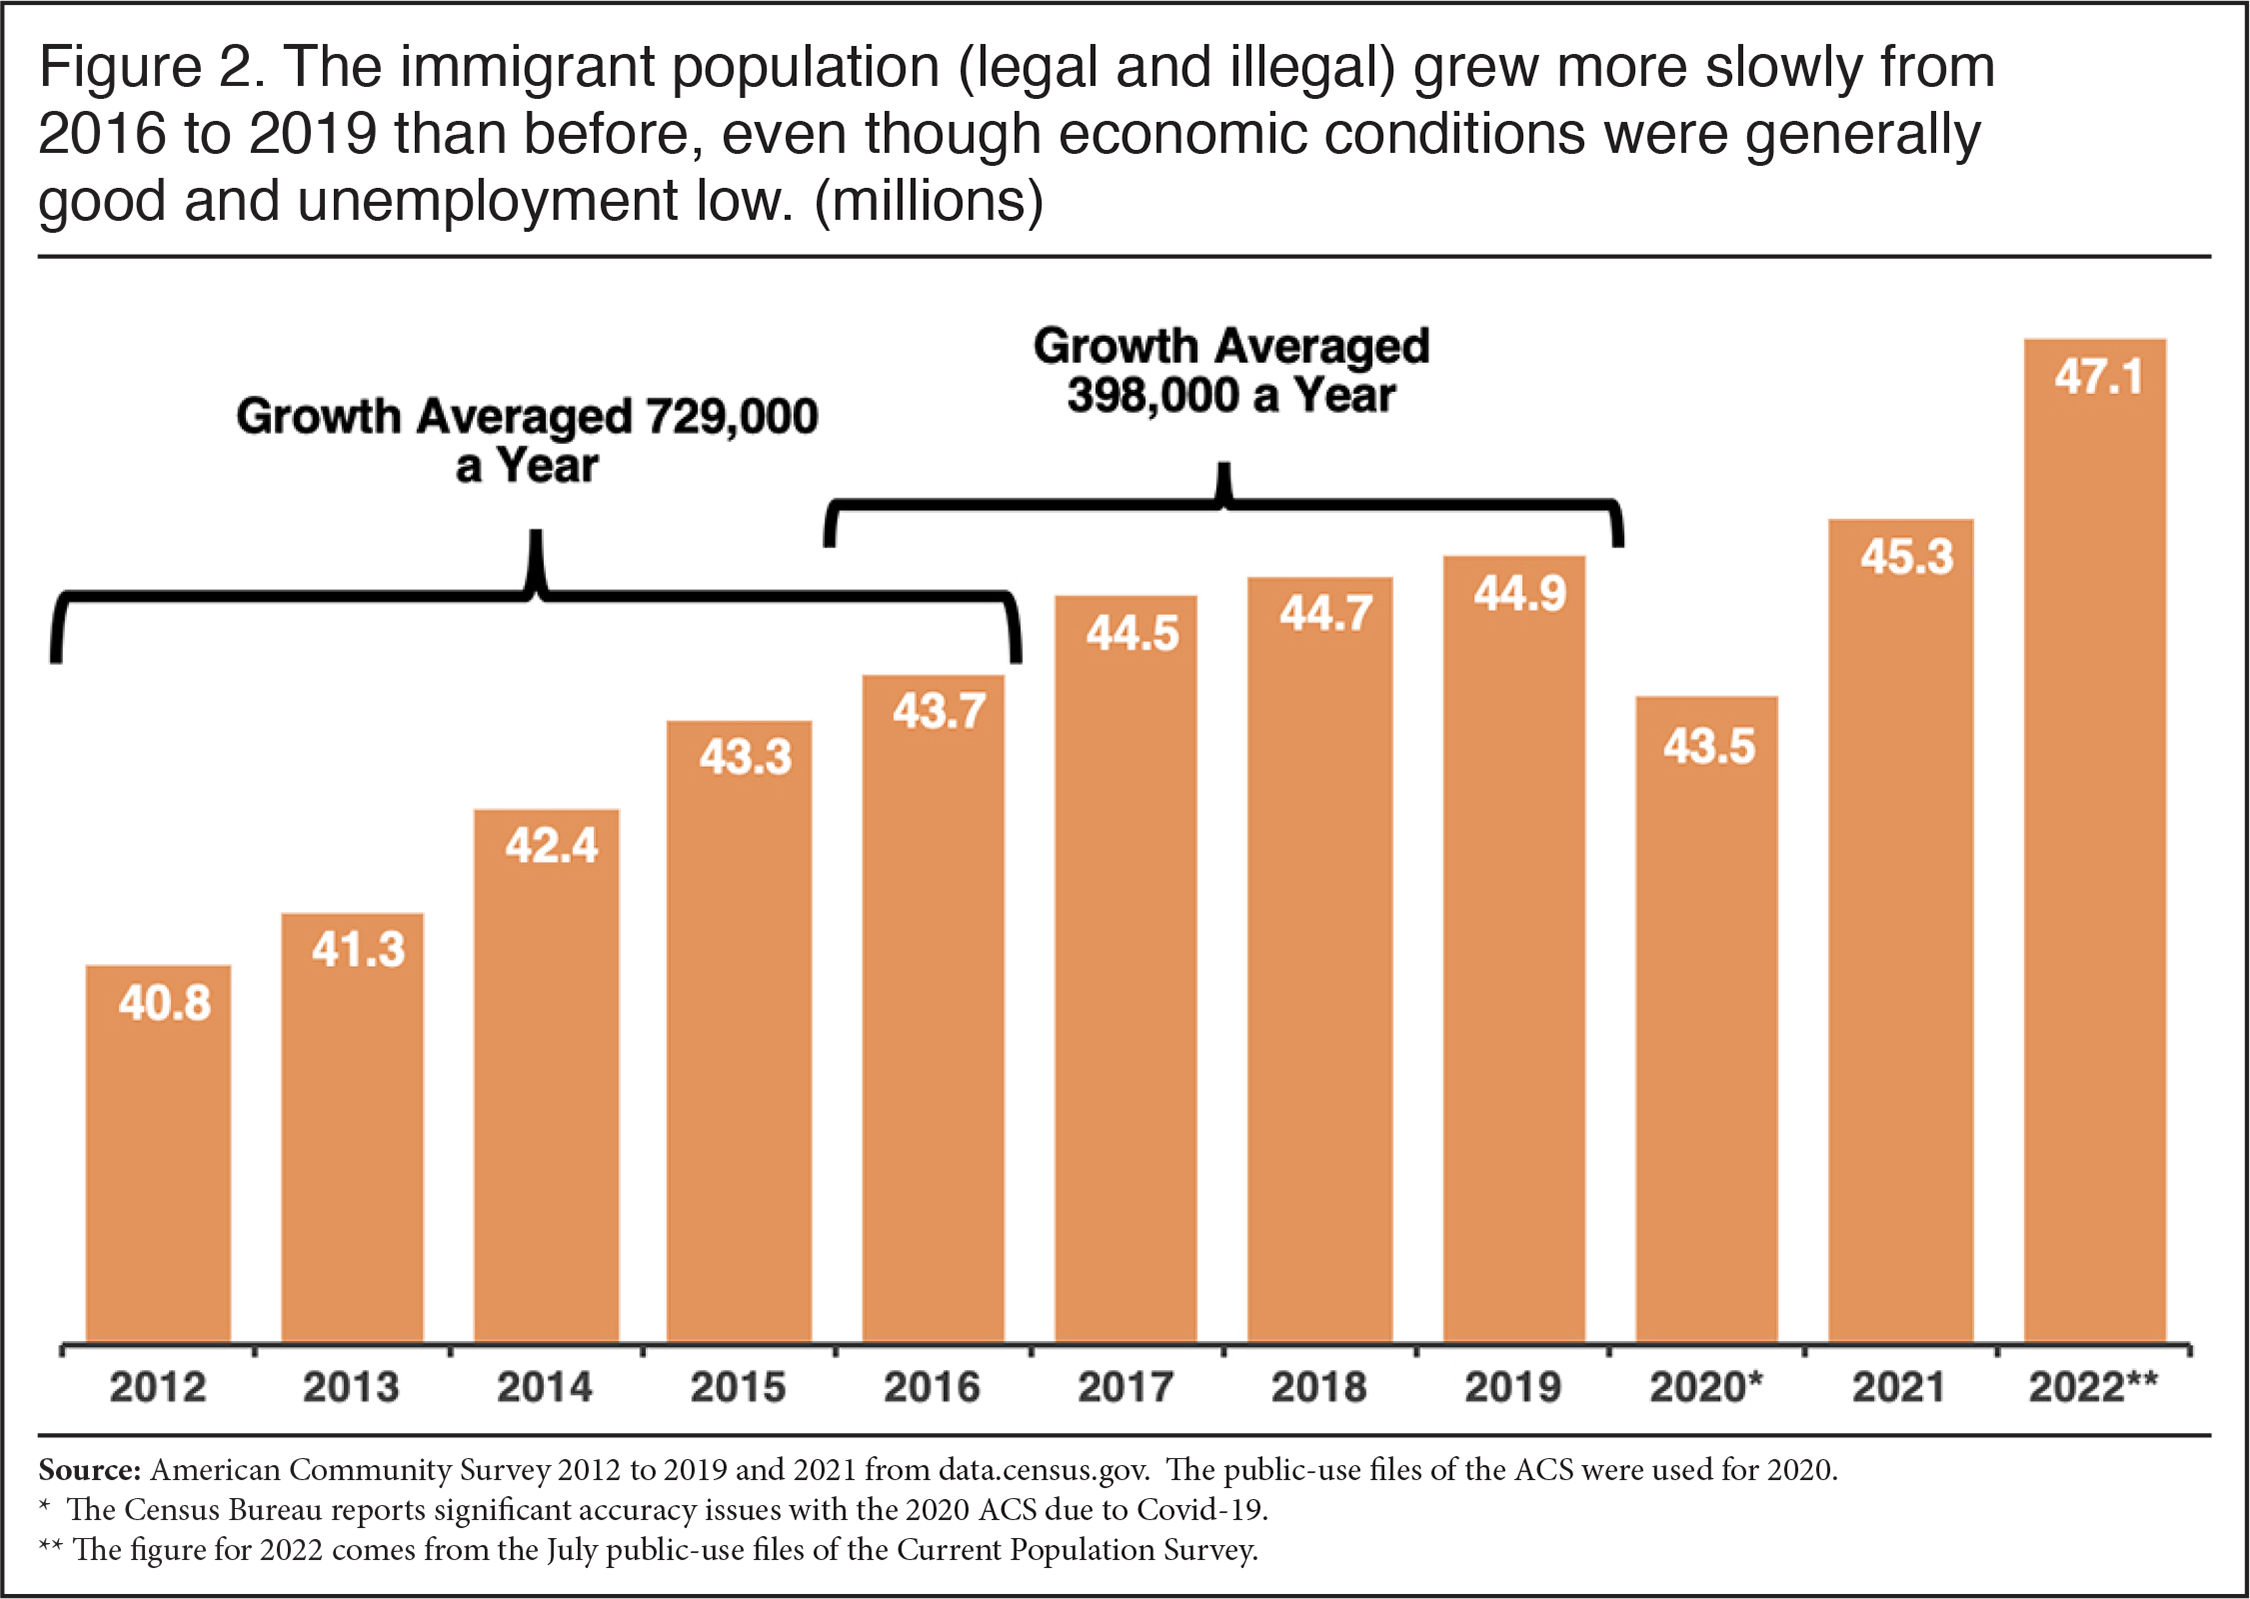 |
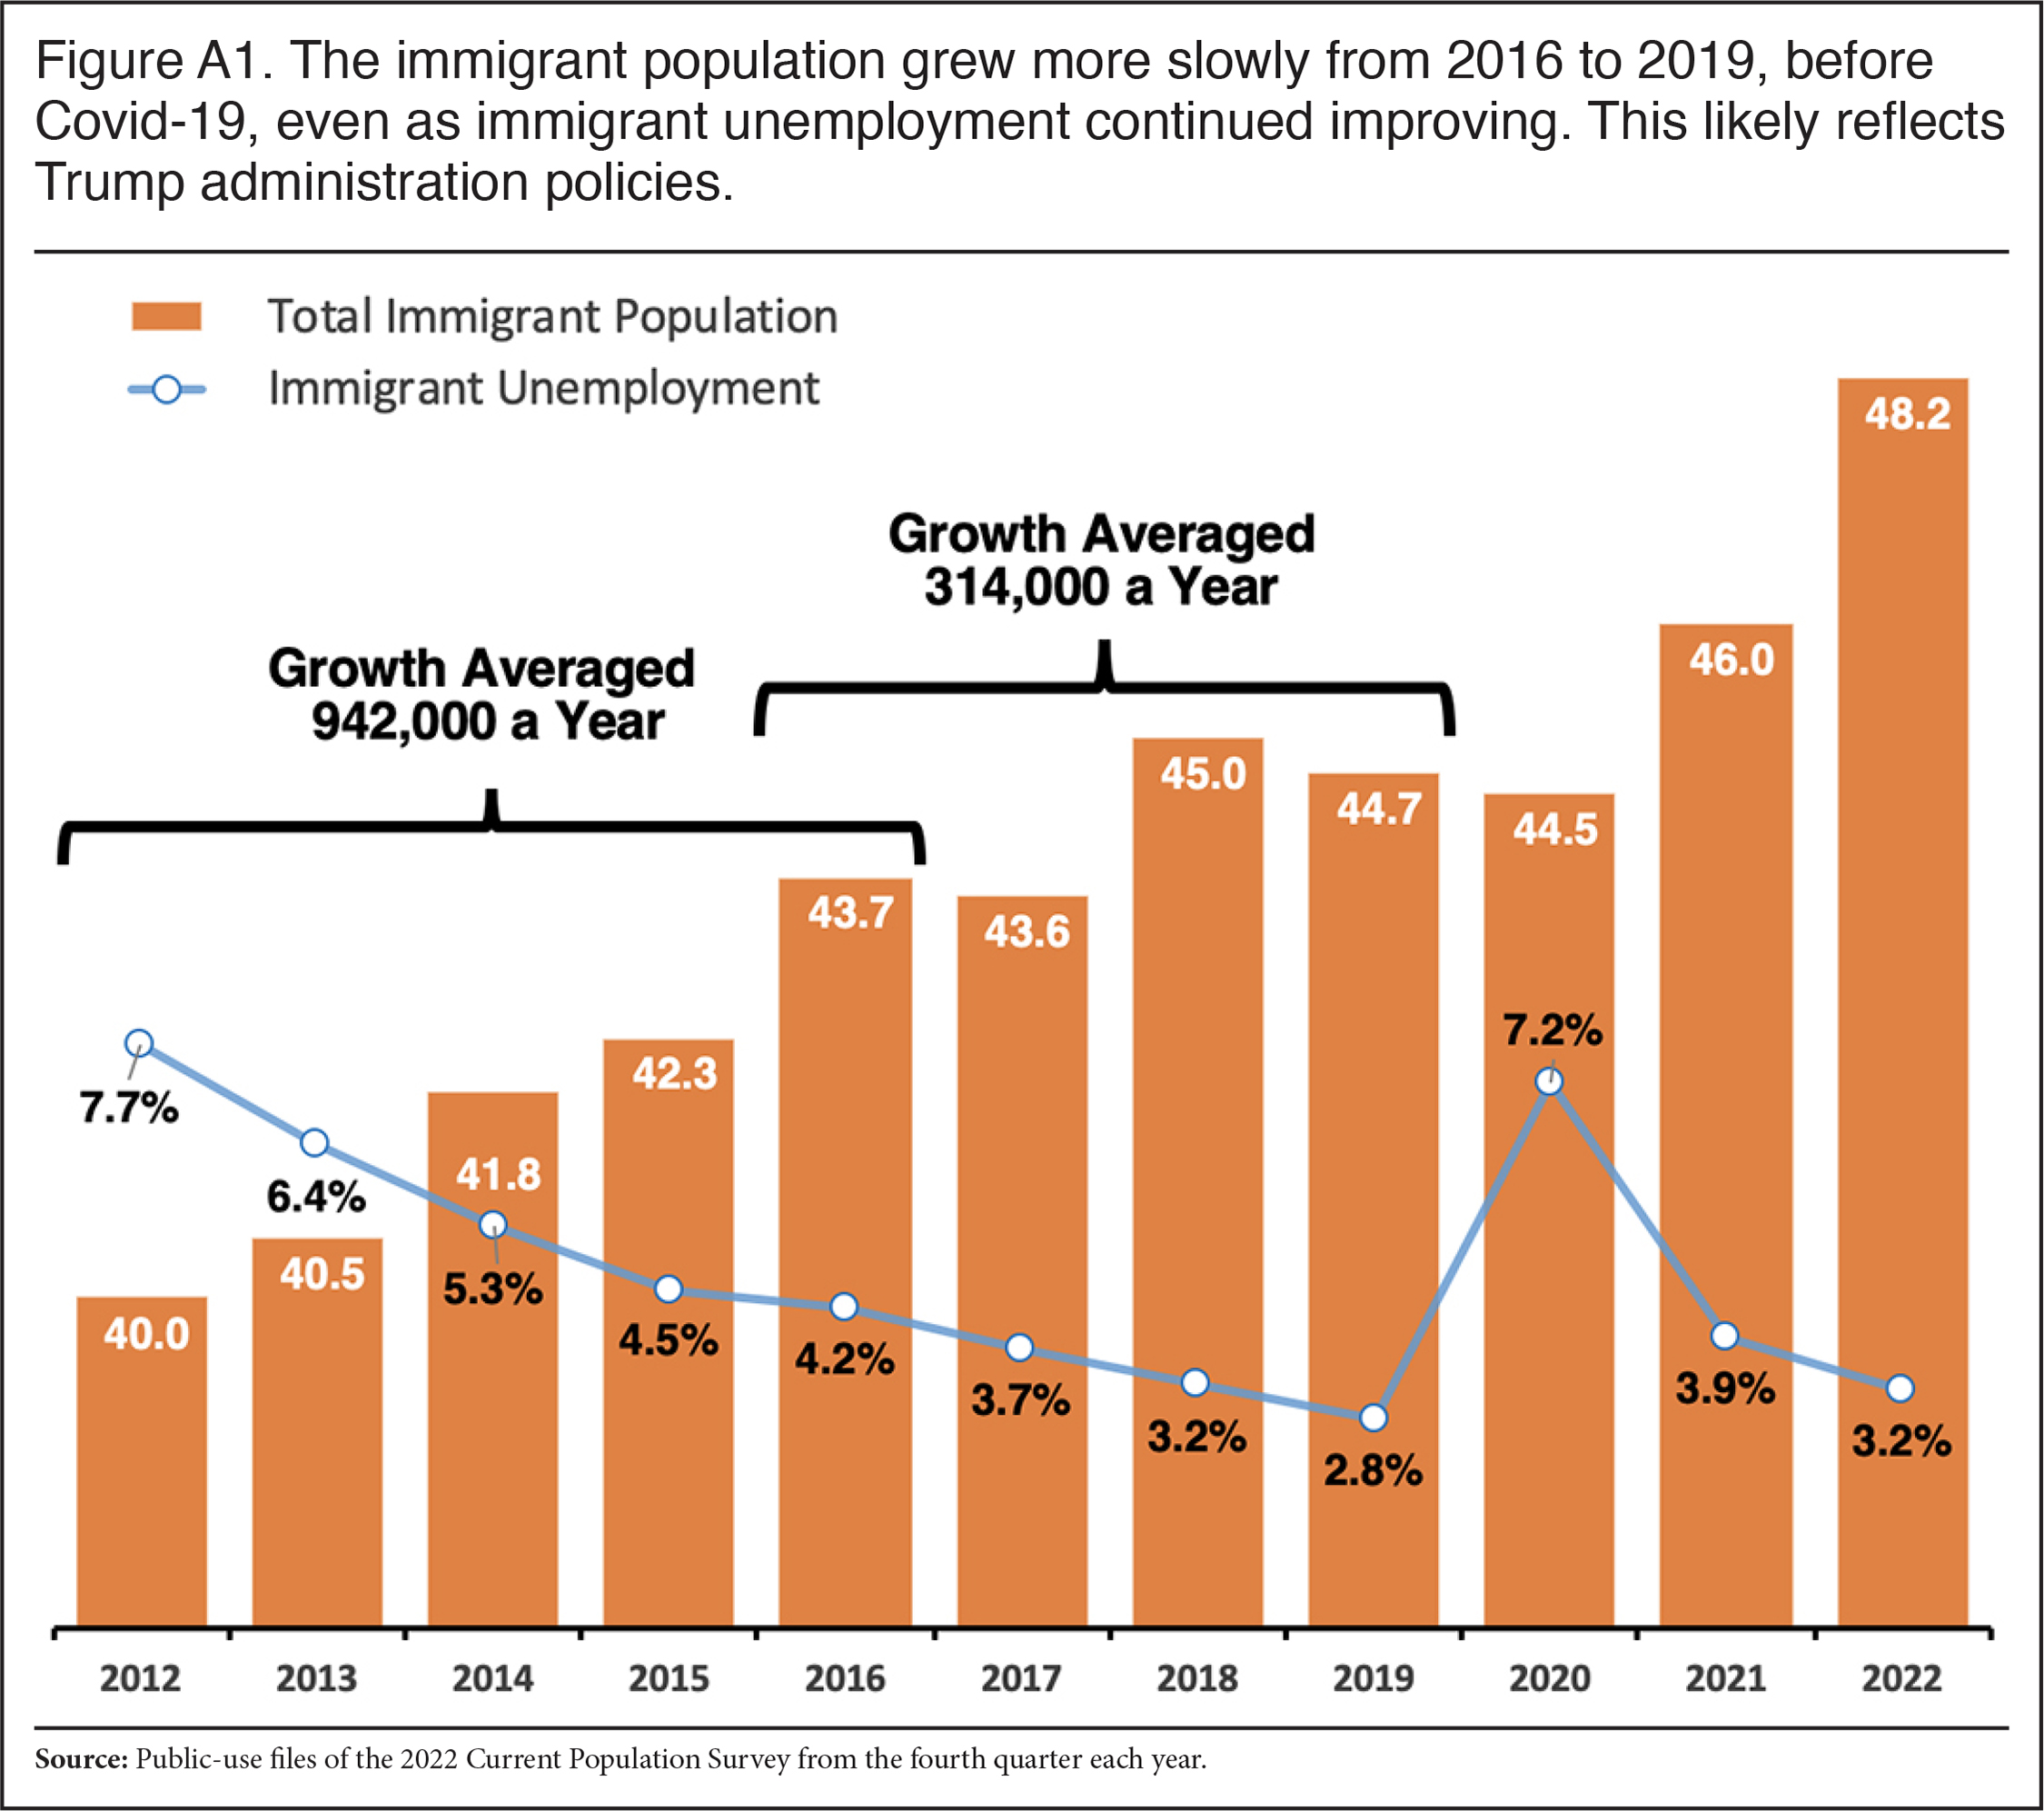
From 2012 to 2016, annual growth in the foreign-born population averaged 729,000. In comparison, there was no growth in the foreign-born population from 2016 to 2020. If we exclude the unusual year of 2020, when the foreign-born population actually declined during Covid, it shows growth averaged 398,000 a year from 2016 to 2019 — with most of this increase occurring from 2016 to 2017. Appendix Figure A1 shows a similar pattern of growth in the foreign-born population as Figure 2, using the CPS rather than the ACS.7 It is sometimes asserted that immigration simply rises and falls with the economy, as immigrants come in larger numbers to take advantage of a tightening labor market. As a result, immigration is largely outside the government’s control and illegal immigration is “inevitable” if jobs are available and immigration is limited, or so the argument goes. But the period 2016 to 2019 contradicts this argument, as the economy expanded and immigration fell. In fact, we have argued in a prior analysis that the decline in immigration over this time period was due, at least in part, to Trump administration policies.
The Recent Surge in Immigration. Partly as a result of the ongoing border crisis, the restarting of legal immigration, and the enormous number of illegal immigrants released into the country, the total foreign-born population has rebounded dramatically since 2020. Figure A1 shows the growth in the foreign-born population based on the Current Population Survey, which is the most up-to-date data available. In sum, both the level of new immigration and net immigration were clearly much higher from 2012 to 2016 and from 2020 to 2022 than it was from 2016 to 2020. If immigration impacts the wages of U.S.-born workers, then it is possible wage trends could fluctuate to some extent due to changes in the inflow of immigrants, especially since the first three years of the Trump administration were a period of significant economic expansion. Of course, numerous factors impact earnings and the U.S. labor force is very large, so a change in immigration levels over just a few years may not have a large enough impact on the labor force to discern using the available data.
Earnings Trends
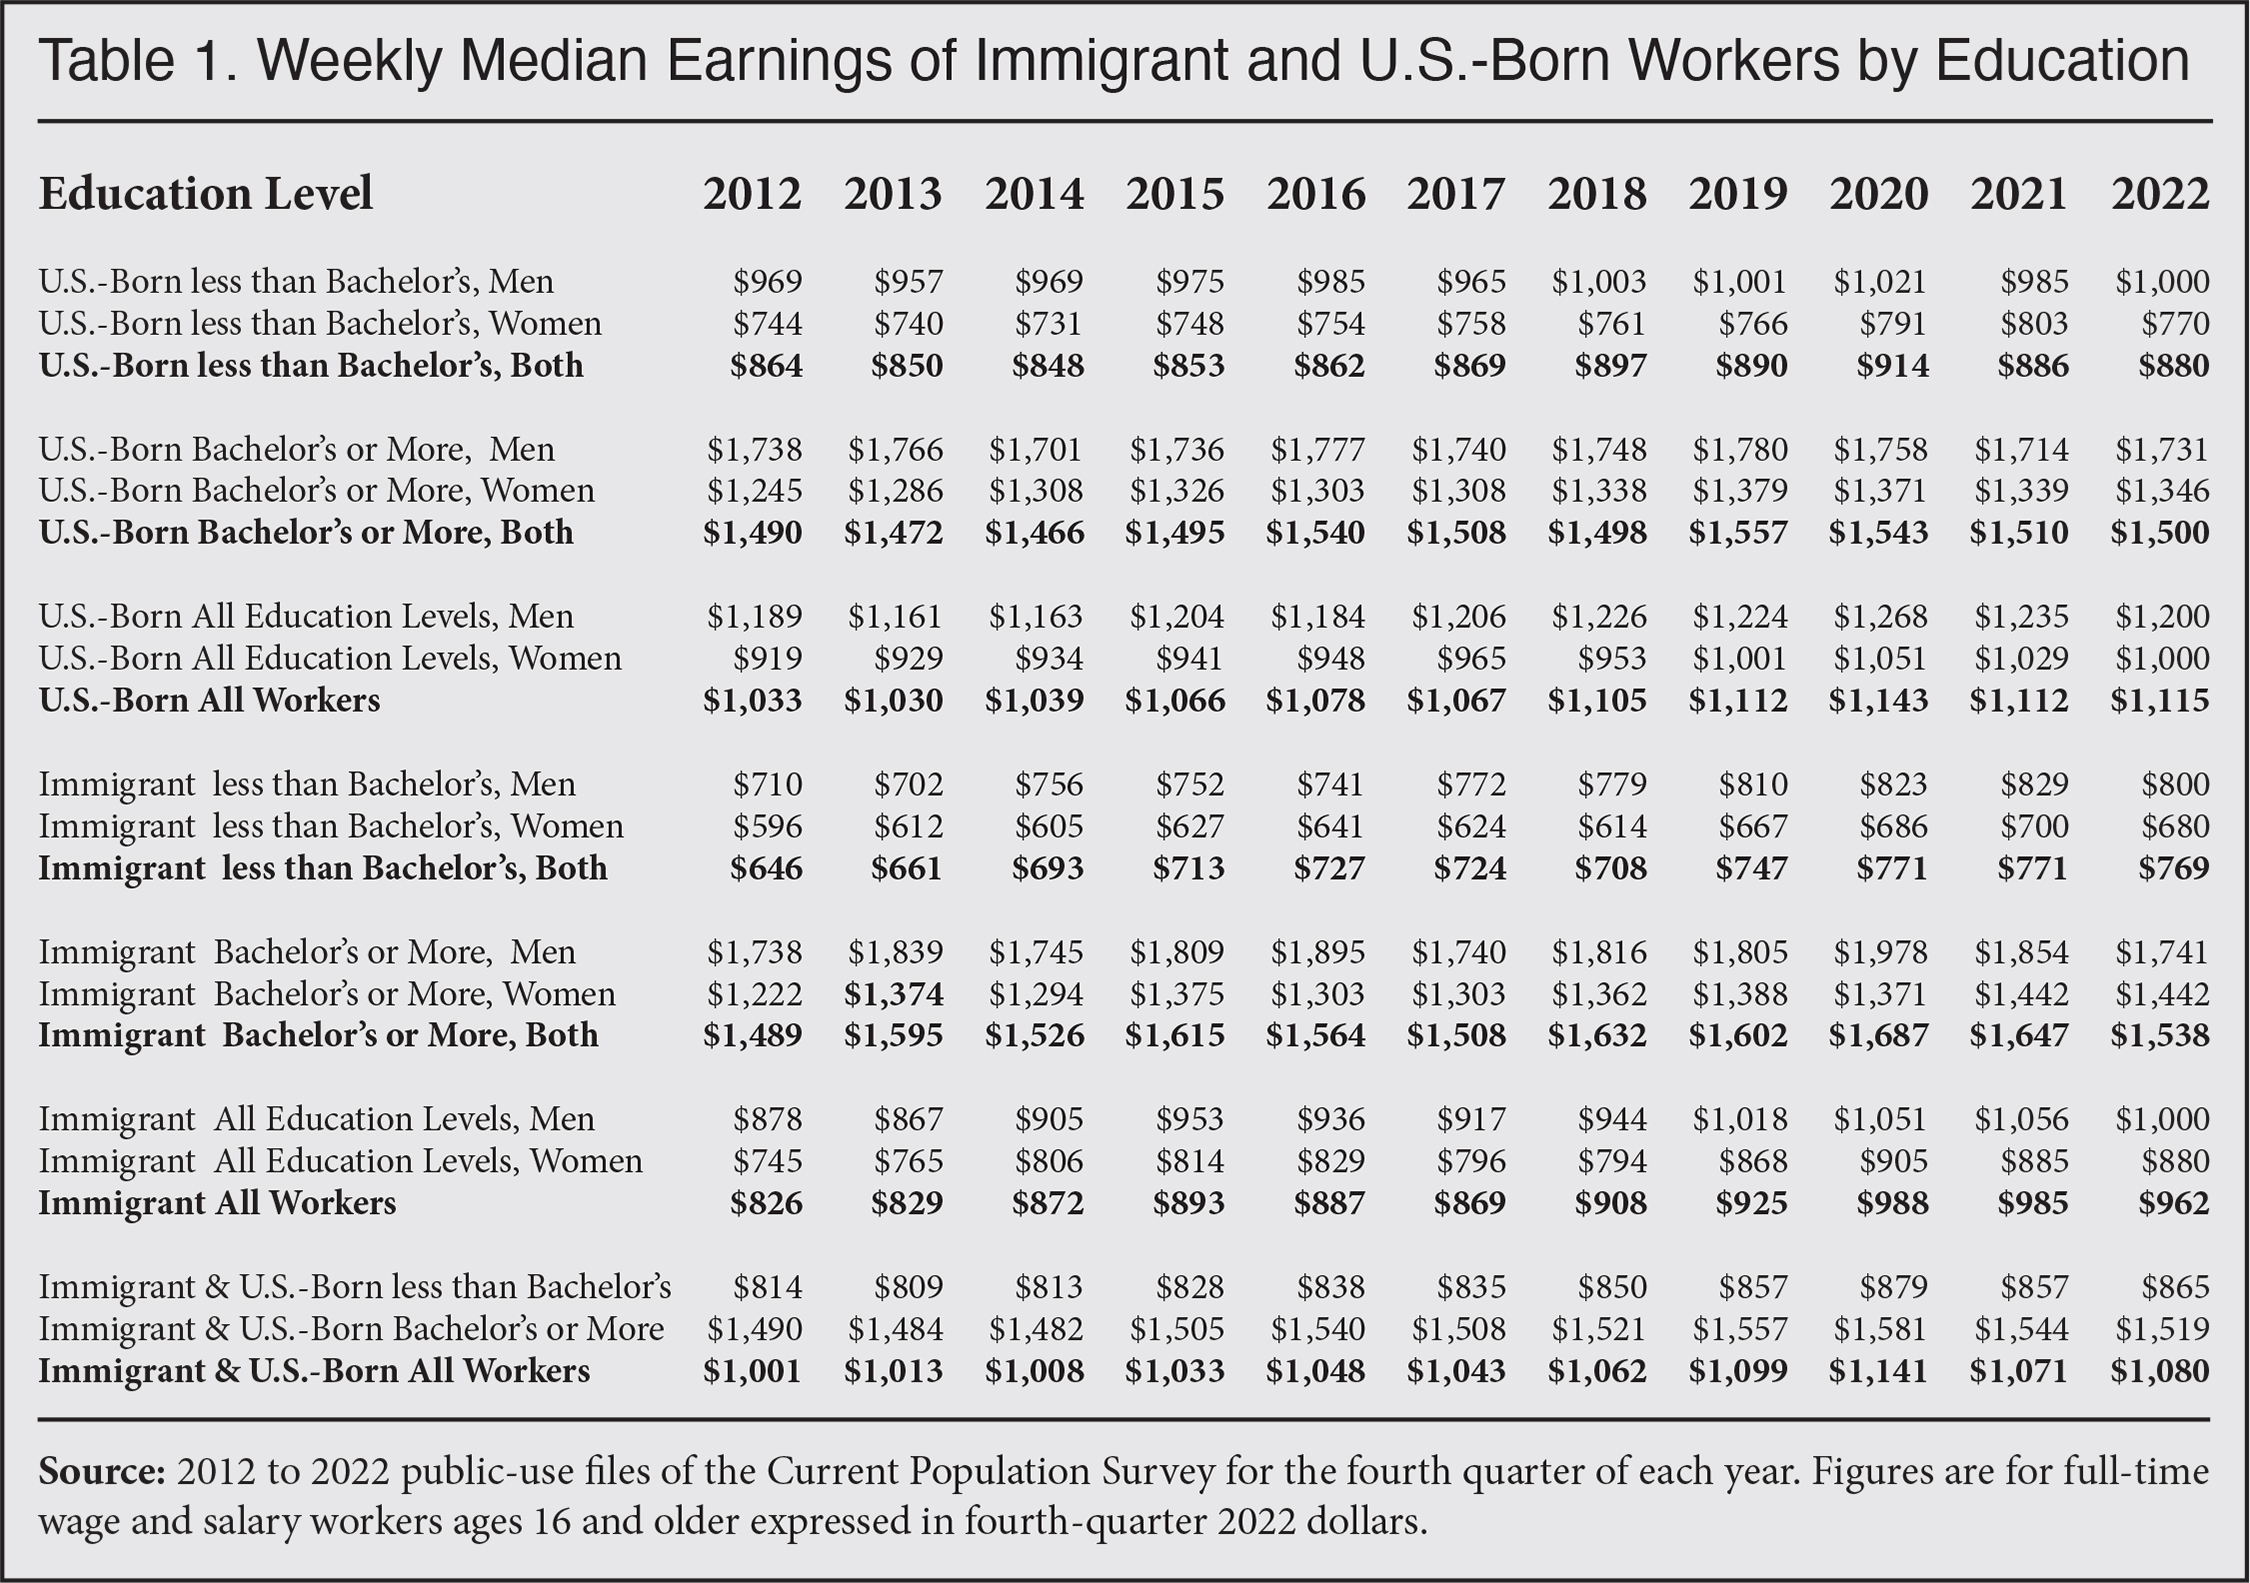
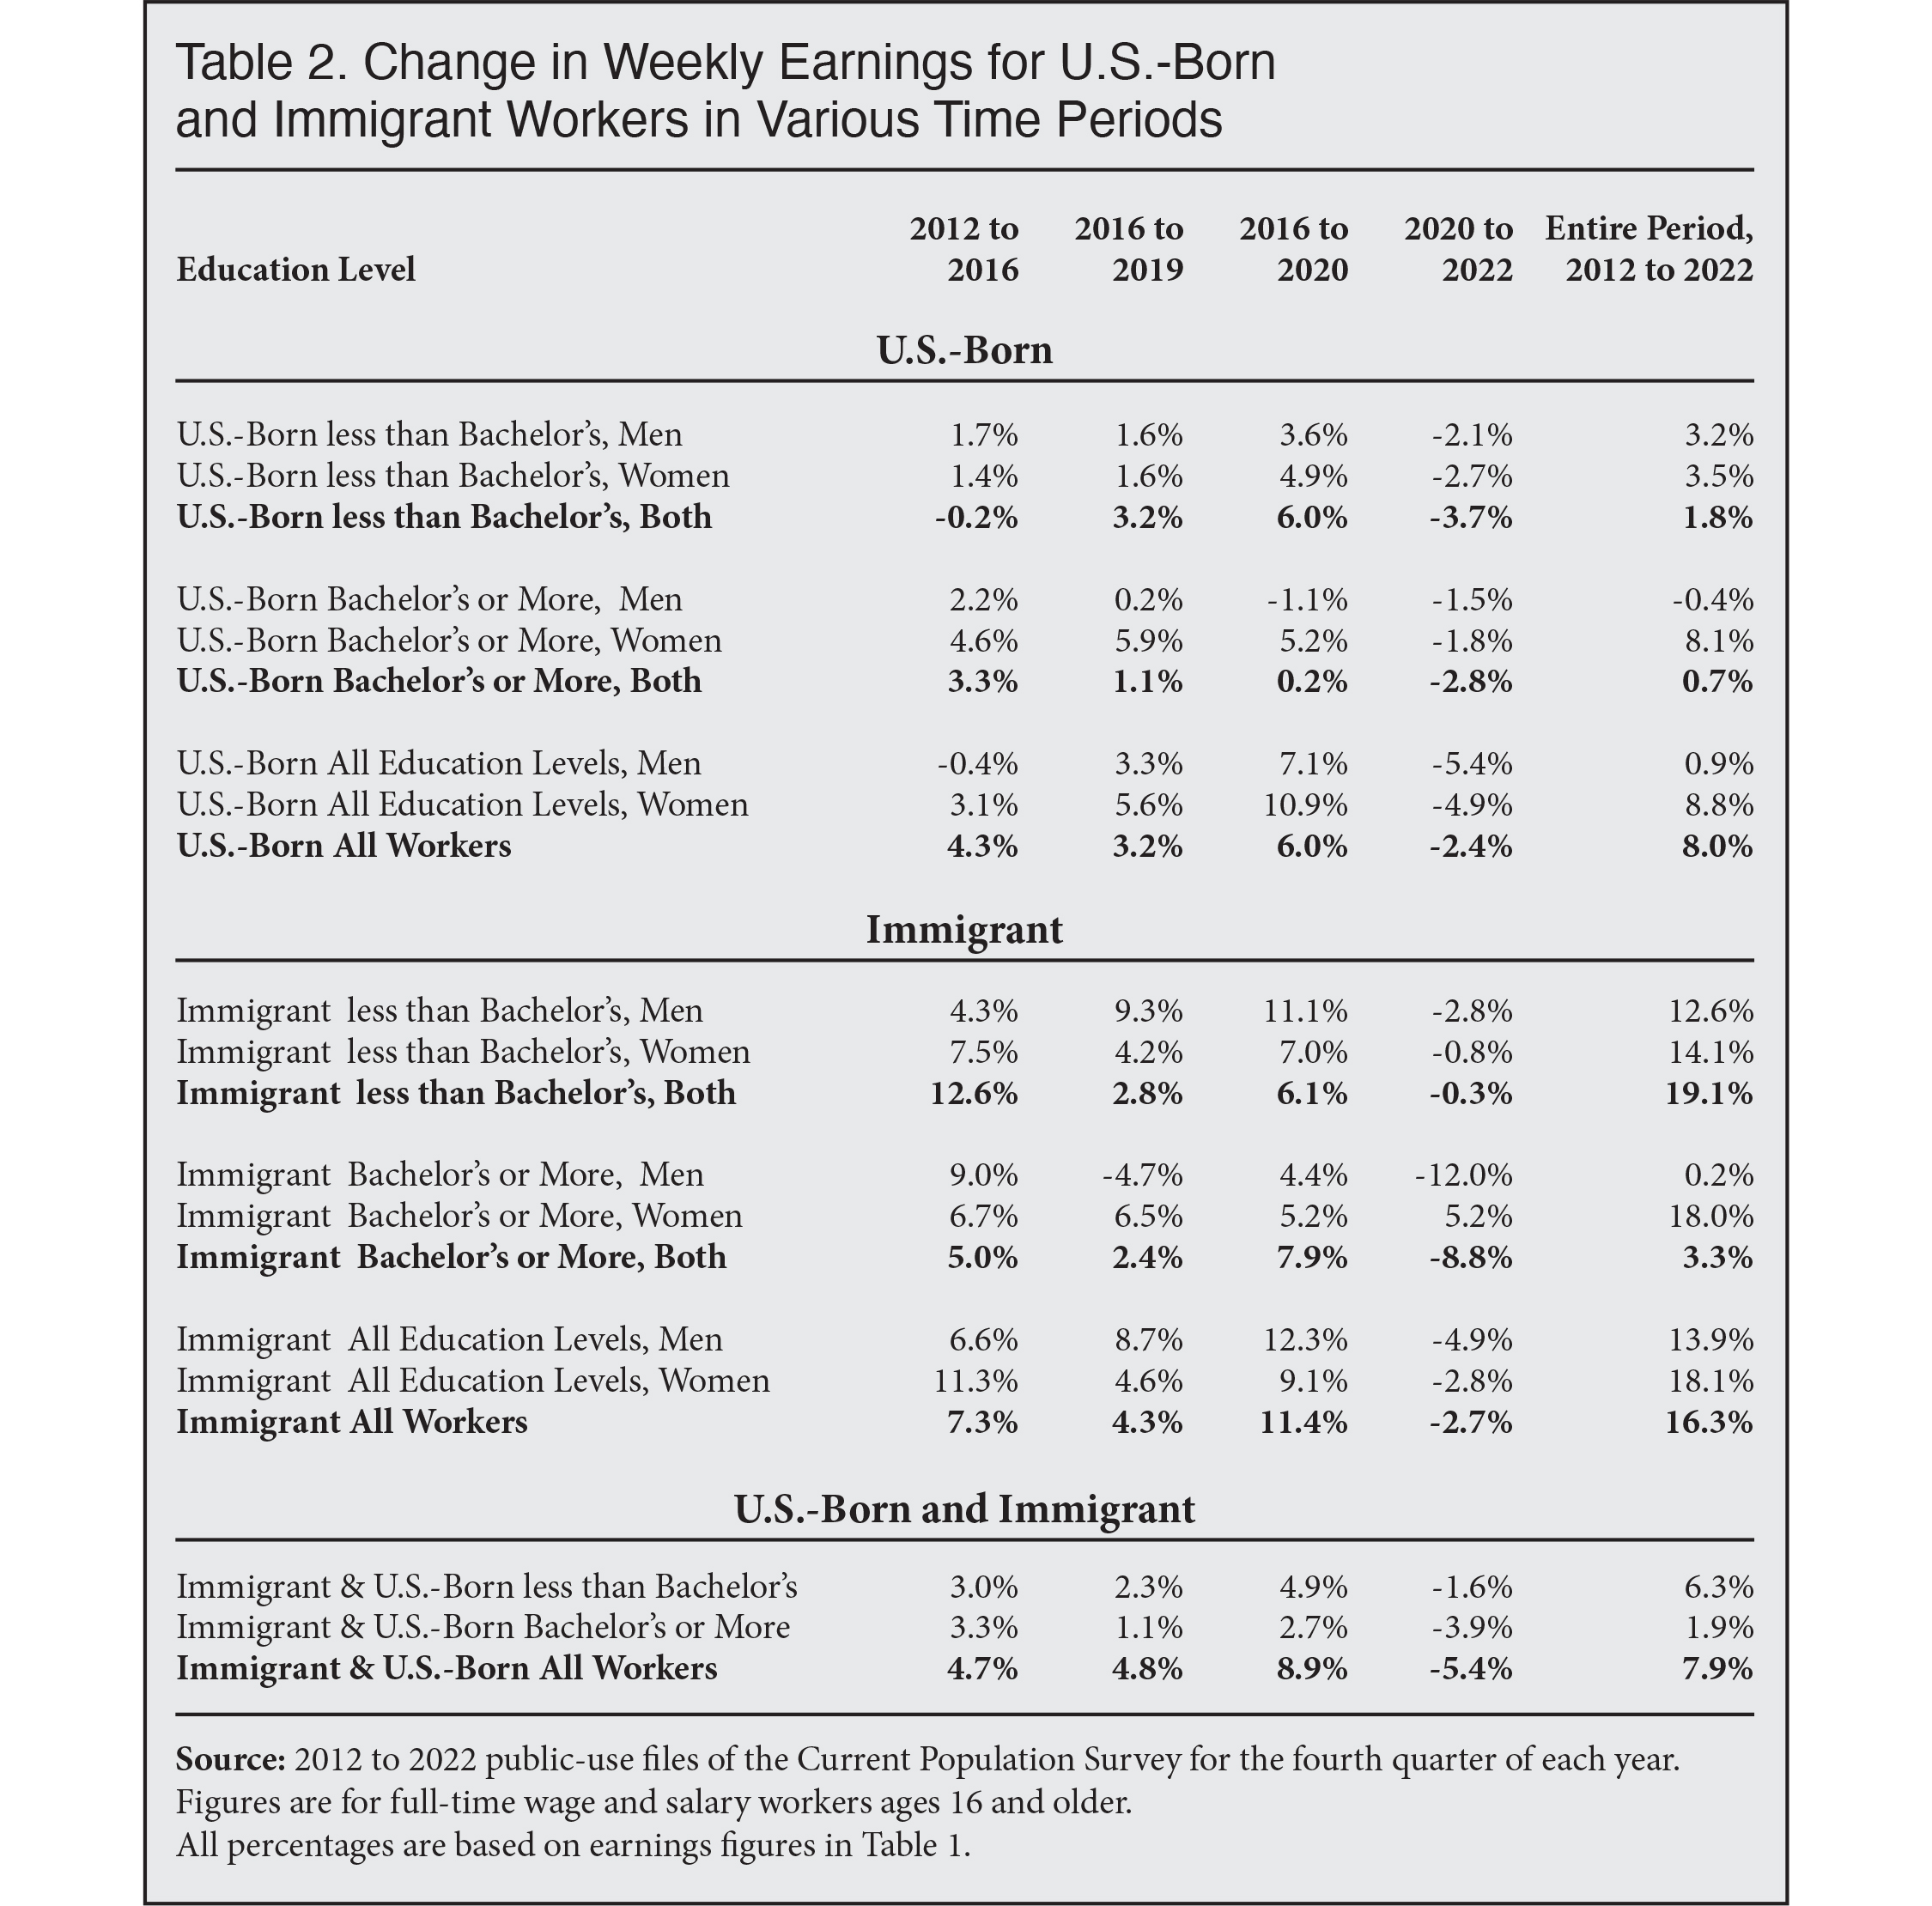
Table 1 shows real median weekly earnings for full-time U.S.-born and immigrant workers ages 16 and older with and without a bachelor’s degree and by sex from 2012 to 2022.8 All figures are for the fourth quarter and are in constant 2022 fourth-quarter dollars. Earnings data by more detailed educational attainment can be found in this table. Table 2 uses the wage figures in Table 1 to show the change in weekly earnings growth divided into four time periods. Figure 3 graphs median weekly earnings for the U.S.-born workers without a bachelor’s while showing the change in the size of the foreign-born population.
 |
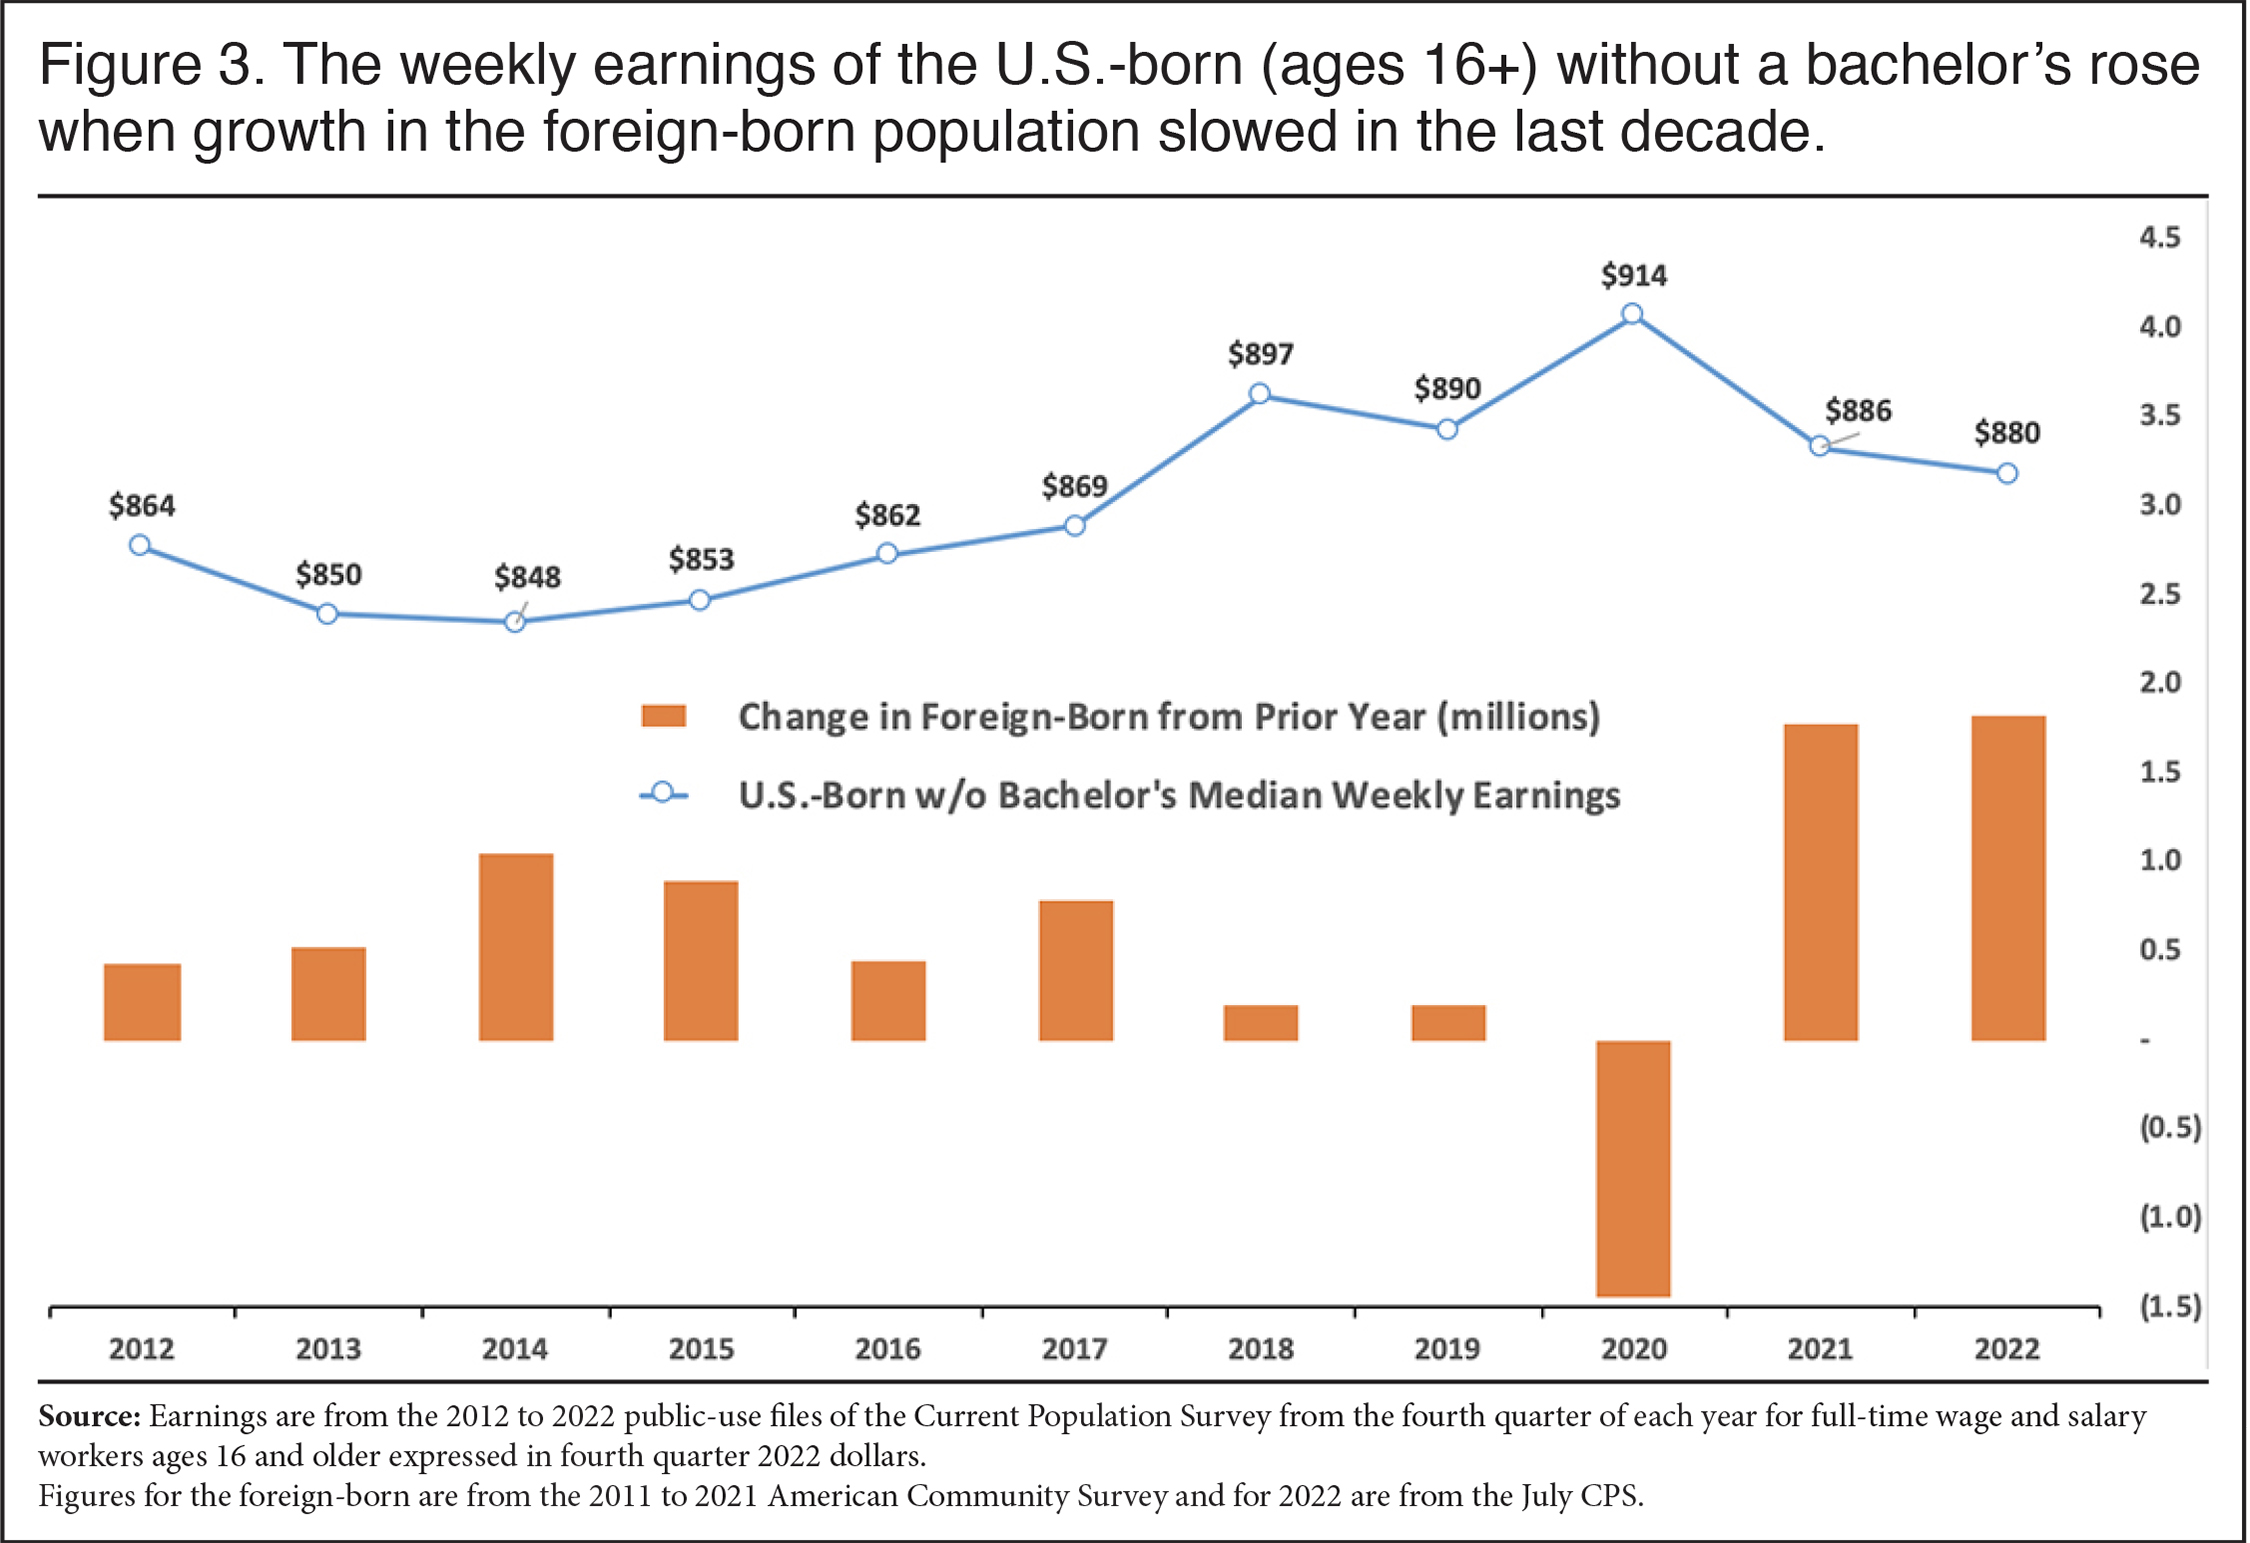 |
Earnings of the U.S.-Born Pre-Covid. Table 2 shows that for the U.S.-born without a bachelor’s, median weekly earnings grew a robust 6 percent from 2016 to 2020. Excluding the unusual year of 2020, the real earnings for the non-college-educated, U.S.-born increased 3.2 percent from 2016 to 2019.9 This is in contrast to the 0.2 percent decline in real earnings such workers experienced during the period of higher immigration, 2012 to 2016. As Figure 3 shows, the relatively rapid increase in earnings for the non-college-educated U.S.-born occurred when the growth in the immigrant population slowed considerably.10 This could be an indication that lower levels of immigration may help increase earnings for the U.S.-born, at least those who work full-time. However, it should not be seen as definitive proof that this the case as many factors impact earnings. For the U.S.-born with at least a bachelor’s, Table 2 shows that real earnings increased 1.1 percent from 2016 to 2019, during the lower period of immigration. However, earnings grew 3.3 percent from 2012 to 2016 for the more educated U.S.-born when immigration was higher. So their earnings growth is not really correlated with growth in the foreign-born population pre-Covid.
 |
Labor Force Participation of the U.S.-Born. Figure 4 shows labor force participation for those without a bachelor’s and the change in the size of the immigrant population from 2012 to 2022. As we show in a recent publication, labor force participation — the share of working-age people holding a job or looking for one — has declined for decades. In fact, labor force participation for men has declined since the 1960s. In the last two decades, participation fell during each recession and then recovered but never made it back to pre-recession levels during each expansion. Figure 4 shows that labor force participation fell until about 2013, which reflects the steep decline during the Great Recession. For 2013 to 2015, it changed little. It then improved from 2016 to 2019 as the pace of immigration slowed, until the big decline in 2020 caused by the pandemic. As with the rise in earnings for the less-educated, U.S.-born, the increase in labor force participation during the period of lower immigration is consistent with the possibility that the non-college-educated, U.S.-born may have benefited from the immigration slow-down.
 |
Why the Impact of Immigration May Differ by Education. Assuming that the improvement for the less-educated in earnings and labor force participation was at least partly explained by the fall-off in immigration, the question arises: Why didn’t more-educated, U.S.-born workers do better between 2016 and 2019 relative to the period of higher immigration from 2012 to 2016? There are several possible explanations for this situation. Table 3 shows weekly earnings by occupational categories in 2022. The right side of Table 3 shows that in occupations where a majority of workers do not have a bachelor’s, 22 percent of workers are immigrants compared to 16 percent in higher-skilled occupations. Since about three-fourths of all less-educated U.S. workers are in these lower-skilled occupations, it may simply be that U.S.-born workers without a bachelor’s are more likely to compete with immigrants than the more educated.11
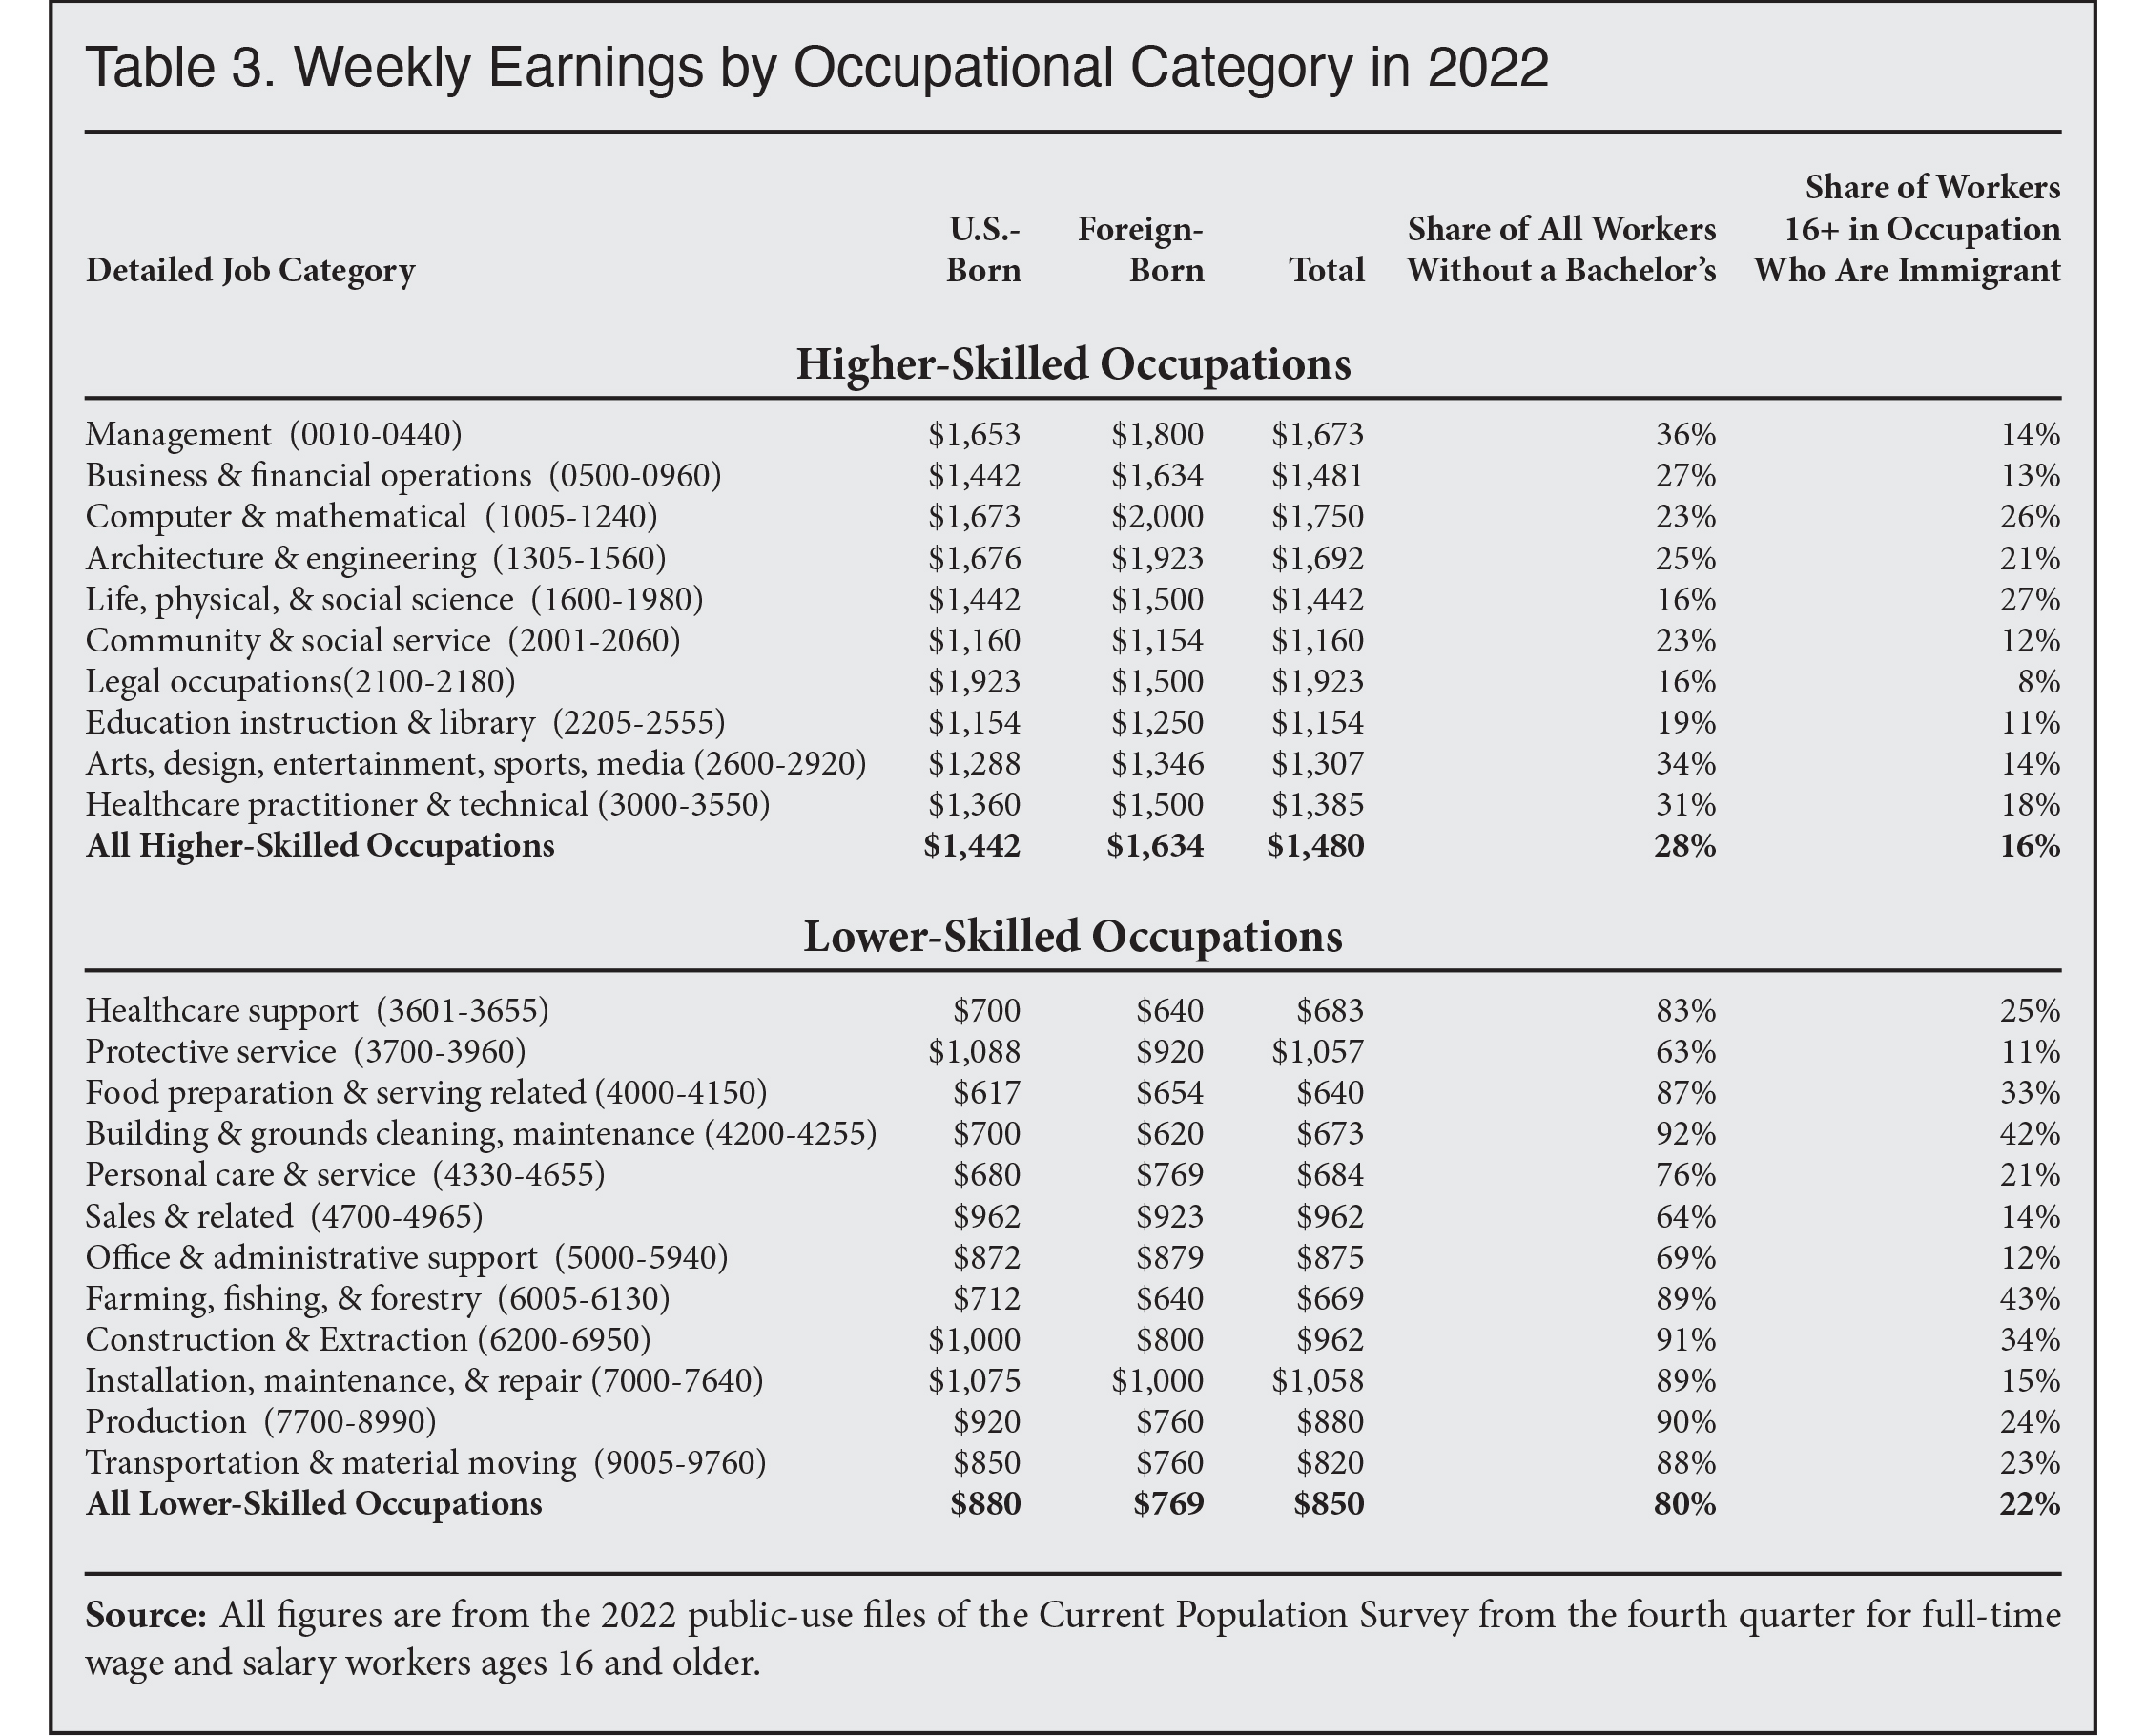 |
Another factor that may explain why more educated U.S.-born workers did worse during the period of lower immigration is that in lower-skilled occupations immigrants are willing to work for less than natives. Table 3 shows that in nine out of the 12 lower-skilled occupational categories, full-time immigrant workers have lower median weekly earnings than the U.S.-born. This is a possible indication that they work for less and thereby bid down earnings in these job categories.12 We do not see this pattern in higher-skilled occupations. It is also possible that more educated immigrants tend to complement the skills of more educated natives. So, for example, an immigrant doctor or computer programmer might impart skills to his U.S.-born counterparts that could increase their earnings. This is less likely to be true for immigrant dishwashers or janitors. The bottom line is that there is no reason to assume that immigration will necessarily have the same impact on the U.S.-born with different levels of education.
Earnings of Immigrants Pre-Covid. Turning to the foreign-born, those without a bachelor’s did very well from 2012 to 2016, with weekly median earnings growing by a robust 12.6 percent. Earnings also grew by 2.8 percent from 2016 to 2019 for these less-educated immigrants. For full-time immigrant workers with at least a bachelor’s, median weekly earnings increased by 2.4 percent when immigration was lower from 2016 to 2019, and grew 5 percent from 2012 to 2016 when immigration was higher. However, earnings for more educated immigrants jumped around a good deal from 2012 to 2019. It must be pointed out that the earnings figures for immigrants are based on a relatively modest-sized sample, unlike the figures for the U.S.-born, so there is more volatility in the earnings of the foreign-born, especially for those with a bachelor’s, who are less numerous than those without a bachelor’s.13
Earnings by Occupation. As discussed above, Table 3 reports median weekly earnings for full-time workers by broad occupational categories in 2022. Not surprisingly, workers in occupations done predominately by the less-educated tend to be lower paid than occupations predominately done by more educated workers. The median weekly earnings of $880 in the fourth quarter of 2022 for U.S.-born workers in lower-skilled occupations is well below the median of $1,442 for the U.S.-born in higher-skilled occupations. Earnings are especially low for workers in food preparation; personal care; healthcare support; building cleaning and maintenance; and farming, fishing, and forestry. It is worth remembering that the relatively low earnings in the jobs reported here are not due to the inclusion of those who are employed only part-time, as this analysis is confined to only full-time workers.
There is, of course, nothing surprising about the low earnings in many occupations that require modest levels of education. But it does mean that the numerous commentators, including prominent economists, business leaders, politicians, and immigration advocacy groups all calling for more immigration to hold down wages in order to slow inflation, including in lower-wage jobs generally done by the less-educated, are, in effect, advocating for making poor workers even poorer. This seems especially unwise given that earnings growth is already not keeping up with inflation.
Conclusion
There are three main takeaways from this analysis: First, real (inflation-adjusted) median weekly earnings increased more for full-time, U.S.-born workers without a bachelor’s in the period of lower immigration from 2016 to 2019 than in the years before or since when immigration levels were much higher. This is a possible indication that the slowdown in immigration in the first three years of the Trump administration, coupled with an expanding economy, helped raise earnings for these workers, who generally have modest earnings. The fact that the economy expanded and immigration fell from 2016 to 2019 is interesting because it shows it is possible for immigration to be reduced even as the economy expands. Clearly, it is not “inevitable” that immigration must rise during an expansion, as some have argued. Moreover, the combination of falling immigration and economic expansion seems to have been beneficial to less-educated workers, though at this point the evidence is only suggestive of that possibility.
The second key finding of this analysis is that the overall good economic conditions during the period of lower immigration from 2016 to 2019 contradict the often-made argument that the U.S. economy must have very high levels of immigration to prosper. Both new arrivals and net immigration (the difference between those coming and leaving) clearly fell significantly during this time period even as the economy expanded, the earnings of workers rose, and labor force participation increased, all without sparking high inflation.
The third key finding is that real earnings since 2020 for virtually all workers have fallen. Nominal earnings did grow, but by less than inflation, so American workers grew poorer. Almost certainly this is due to the rapid rise of inflation since 2020. However, it is true that since 2020 immigration has increased dramatically. The monthly Current Population Survey shows that the immigrant population increased by 3.7 million from the fourth quarter of 2020 to the fourth of 2022, so it is possible this huge increase also exerted some downward pressure on earnings. Equally important, the deterioration in real earnings since 2020 is especially concerning for those workers without a bachelor’s degree, who earn much less than more educated workers and who comprise the vast majority of working Americans who live in or near poverty. A large number of public figures have called for more immigration to lower wages in order to help check inflation. But those who wish to use immigration to further reduce earnings need to consider the impact on workers whose income is already not keeping pace with inflation, especially those whose income is low to begin with.
Data
The data for this analysis comes from the public-use files of the monthly Current Population Survey (CPS), colloquially known as the household survey. The CPS is a nationally representative sample of about 60,000 households collected by the Census Bureau for the Bureau of Labor Statistics (BLS) each month, primarily to collect data on the U.S. labor market. The survey is of the non-institutionalized, so it does not include inmates. Following the Bureau of Labor Statistics’ (BLS) example, all weekly earnings estimates in this report are for full-time workers, defined as those who usually work at least 35 hours a week.
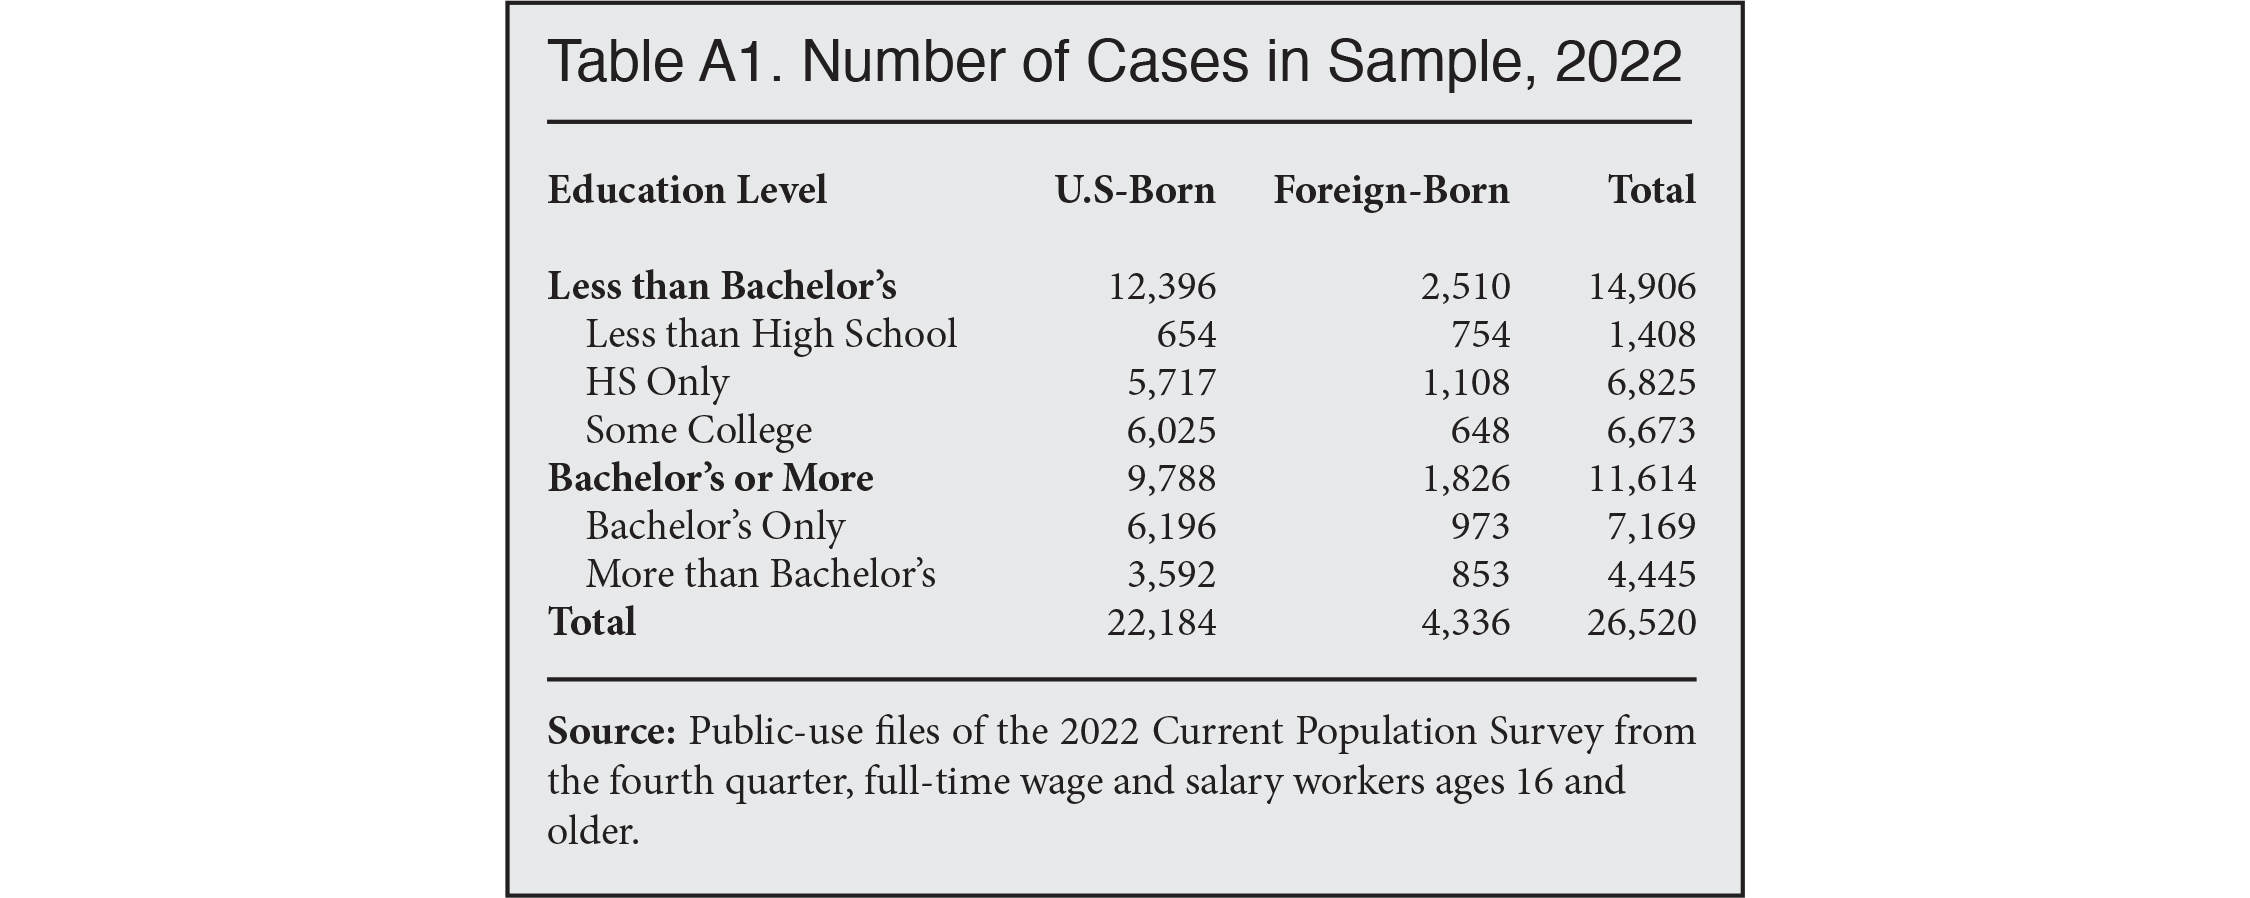
The earnings data is collected from one-third of the CPS monthly sample.14 This includes all workers in the public or private sector, but is limited to only those who receive wages, salaries, commissions, tips, payment in kind, or piece rates. Also, like BLS publications, our analysis reflects earnings from workers’ sole or principal full-time job. The limited population for whom earnings data is collected means the sample used for earnings data is much smaller than when the same survey is used to measure other labor market characteristics such as unemployment or labor force participation. Table A1 reports sample sizes in 2022 for immigrant and U.S.-born workers who are in the earnings universe.
We report all figures in constant dollars, reflecting prices in the fourth quarter of 2022. All figures are seasonally unadjusted. Immigrants include all those who were not U.S. citizens at birth, such as naturalized citizens, permanent residents, long-term visitors (e.g. guestworkers and foreign students), and illegal immigrants. Both the Census Bureau and the Bureau of Labor Statistics are clear that illegal immigrants, whom the government typically refers to as the foreign-born, are included in this data. Unadjusted figures are conceptually simpler and easier for other researchers to replicate. Also, the limited number of statistics on the foreign-born published in the BLS monthly “Employment Situation” (Table A-7) reports are, like those reported here, not seasonally adjusted. Finally, comparing the same quarter each year, as we do here, essentially controls for seasonality.
Appendix
 |
 |
End Notes
1 In this report, earnings or labor force participation statistics covering the “entire population”, such as median weekly earnings, closely match those published by the BLS, but not exactly. The reason is that the Census Bureau adds “perturbations” to the public-use microdata to protect respondent confidentiality. Fortunately, the Census Bureau states that any differences between published figures and those calculated from the public-use data will be so small that they “fall well within the sampling variability associated with CPS estimates”. For example, in its fourth quarter 2022 weekly wages report, BLS reports the nation’s median earnings for wage and salary employees as $1,084. We report it as $1,080 based on the public-use data, a 0.4 percent different.
2 The term “immigrant” has a specific meaning in U.S. immigration law, which is all those inspected and admitted as lawful permanent residents. In this analysis, we use the term “immigrant” in the non-technical sense of the word to mean all those who were not U.S.-citizens at birth.
3 They also comprise the overwhelming majority of those who can be said to have low income, earning less than 200 percent of poverty. Very roughly, 200 percent of poverty is the threshold for eligibility for many means-tested federal anti-poverty programs.
4 The figures only run through 2020 because the survey asks respondents the calendar year in which they came to the United States, but a full year’s worth of arrivals can only be discerned from the data for each year once the following year’s survey is completed. The 2021 ACS is the most recent year the survey is available at the time of this publication, so full-year arrival data from the survey is only available through 2020.
5 The figure for 2020 should be interpreted with caution because there were significant disruptions in the collection of the ACS due to Covid-19. The 2021 ACS is the newest version of the survey available at this time. The ACS reflects the population on July 1 of each year so the foreign-born number in Figure 2 is from the July 2022 CPS to maintain the continuity in the foreign-born estimates from the ACS.
6 We see the same pattern of growth if we look at workers rather than the total foreign-born population, where the number of immigrant workers increased roughly 50 percent faster from 2012 to 2016 than from 2016 to 2019.
7 Figure A1 in the Appendix looks at the size of the foreign-born population in the fourth quarter of each year using the monthly CPS (October, November, and December), the same data we use to measure median wages in this report. While the ACS is a larger survey and therefore produces more statistically robust estimates than the CPS, the ACS is released much more slowly. The 2021 ACS, which reflects the U.S. population in July, is the most recent data available from that survey at the time of this publication.
8 Excel Table A has figures for persons 25 and older, but it makes no meaningful difference to this analysis. One reason there is so little difference between looking at all workers and only those 25 and older is that a disproportionate share of young people (16 to 24) work part-time. Since we are examining earnings only for the full-time workforce, a large share of young people drop out of the analysis even when those 16 to 24 are included.
9 The BLS reports that response rates to the CPS after March 2020 were lower than prior to Covid-19, though rates have improved since hitting a low in June 2020. These lower rates increase the sampling error of the survey. However, in June 2020, when the problem was most pronounced, BLS stated that “Although the response rate was adversely affected by pandemic-related issues, BLS was still able to obtain estimates that met our standards for accuracy and reliability.” This is in contrast to the 2020 American Community Survey, which is the other large survey collected by the Census Bureau that identifies the foreign-born and provides most of the data in Figure 1. The Census Bureau encountered significant problems collecting the 2020 ACS due to disruptions caused by Covid-19. As a result, the bureau states that it was “unable to collect information from certain segments of the population” in 2020, particularly lower-income and less-educated individuals. So we do not have a clear picture of the foreign-born population in 2020 based on the ACS. The bureau has published a detailed analysis showing some of the problematic results in the 2020 ACS. Although the Census Bureau published very little data from the 2020 ACS, the public-use files of the 2020 ACS were released and used in this analysis. Another potentially unusual thing about 2020 is that the Covid-19-related spike in unemployment and people leaving the labor force may mean that those who remained employed were somewhat better paid even among the less-educated, while the more marginally attached to the labor force disproportionately lost their jobs. If this is the case, then the rise in earnings between 2019 and 2020 may reflect this situation rather than a general increase in earnings.
10 It is also possible to just examine workers rather than the overall foreign-born and the same general pattern holds. Table 6 in our prior analysis shows that between 2012 and 2016 the number of immigrant workers 18 and older without a bachelor’s increased by 1.3 million. In contrast, from 2016 to 2019, the number of less-educated immigrant workers actually declined by nearly 180,000. Thus, the number of less-educated immigrant workers roughly parallels the total number of immigrants.
11 Of more educated U.S.-born workers, 76.2 percent are employed in an occupation done predominantly by more educated people.
12 The primary problem with this argument is that while the analysis is confined to 16 and older full-time workers in the same occupation, it does not control for all of the other factors that might impact earnings, such as age or gender. The second problem with simply assuming that immigrants work for less is that the occupations in Table 3 are highly aggregated due to the limitations of the data. This means there are specific occupations within each broad job category that might vary differently with immigrants heavily employed in those that pay more modestly.
13 For example, in 2022 the sample of U.S.-born workers without a bachelor’s for whom earnings data is available is nearly seven times larger than the sample of immigrants with at least a bachelor’s. See Table A1 for sample size by educational attainment in 2022.
14 Earnings data is from the incoming and outgoing rotation groups of the CPS, which constitute one-third of the survey’s six rotation groups.