Download a PDF of this Backgrounder.
Jason Richwine, PhD, is a public policy analyst based in Washington, D.C., and a contributing writer at National Review. Steven A. Camarota is the director of research and Karen Zeigler is a demographer at the Center.
Advocates of expanding the number of refugees admitted to the United States have lately portrayed their position as a win-win — refugee resettlement not only assists the refugees themselves, it also allegedly improves our nation's fiscal health. The fiscal claim is unsupportable. Although refugees from earlier generations were often well educated, today's refugees have fewer than nine years of schooling on average. Because of their low earning power and immediate access to welfare benefits, recent refugees cost the government substantially more than they contribute in taxes, even over the long term.
Our best estimate of the average refugee's lifetime fiscal cost, expressed as a net present value, is $60,000, with those entering as adults (ages 25 to 64) costing $133,000 each. Perhaps this is a price that the United States should be willing to pay to further its humanitarian goals. However, resettlement in the United States may not be the most cost-effective means of aiding displaced people.
Key points:
- The National Academies of Sciences, Engineering, and Medicine developed a model that estimates the lifetime fiscal impact of new immigrants, counting all taxes paid and services consumed at the federal, state, and local levels. Educational attainment is the most important predictor in the model. Generally speaking, highly educated immigrants will contribute more in taxes than they consume in services, while immigrants with low levels of education will contribute less than they consume.
- Based on data from the Annual Survey of Refugees, one-third of refugees between the ages of 25 and 64 completed no more than the sixth grade before their arrival in the United States. About 53 percent have less than a high school diploma. Only 18 percent have education beyond high school.
- When we apply the education levels of refugees to the National Academies' fiscal model, we find that the average refugee will cost about $36,000 in net present value over his or her lifetime. (Conceptually, "present value" means that all of the lifetime costs have been consolidated into a single upfront payment.)
- Because the National Academies model is based on all immigrants at each education level, some adjustments are required for refugees who, unlike most immigrants, impose administrative costs for resettlement and can access welfare payments immediately. After these adjustments, our cost estimate rises to $60,000 per refugee.
- Although the fiscal impact of refugees is negative overall, it differs significantly across age groups. Refugees who enter as adults (age 25 and over) have a large negative impact under every plausible model. Refugees who enter as children may have a positive impact, although this requires optimistic assumptions about mobility.
- Policymakers need to consider whether resettlement in the United States is the best way to help displaced people. Perhaps overseas assistance would be a more efficient use of limited public resources.
Introduction
According to the 2016 Annual Survey of Refugees, one in three recent refugees between the ages of 25 and 64 arrived in the United States with no education beyond the sixth grade. Some 53 percent lacked a high school diploma, compared to 7 percent of U.S. natives in the same age range. Similarly, only 18 percent of refugees had a four-year college degree, compared to 34 percent of natives. Despite the disparity, just 7 percent of recent refugees between the ages of 25 and 64 were currently pursuing a degree of any kind.
Why is education relevant? Because under the U.S. government's progressive taxation and spending structure, high-earning Americans tend to receive less in public benefits than they pay in taxes, while lower-earners receive benefits that exceed the taxes they contribute. Given their low education levels, today's refugees are unlikely to possess the earning power necessary to become net fiscal contributors. This is not a reflection of their character; it is simply a reality of economic life in the United States. In fact, common sense tells us that the public sector would not be struggling every year with budget deficits if even its least-educated citizens were somehow paying their own way.1
Nevertheless, advocates claim that refugees do, indeed, pay their own way. They cite two major studies. The first is a working paper by William Evans and Daniel Fitzgerald finding that each refugee pays an average of $21,000 more in taxes than he or she receives in benefits over the first 20 years in the United States.2 The second is an unpublished (and apparently unfinished) report from the Department of Health and Human Services (HHS) finding that refugees created a net fiscal benefit of $63 billion between 2005 and 2014.3 Both studies have two fundamental problems: First, they exclude major cost categories, and, second, they are based on the experience of older refugees who are altogether different from today's refugees.
As to the first problem, anyone could appear to be a net fiscal contributor if enough costs are excluded. Evans and Fitzgerald count all (or nearly all) taxes paid by refugees, but reduce the services they receive to six social programs — cash welfare, SSI, Social Security, food stamps, Medicare, and Medicaid. All other costs that governments might incur from immigration — housing, infrastructure, education, law enforcement, and so on — do not count. They also fail to adjust for the underreporting of the social programs in Census data. The HHS report is more comprehensive, but it still excludes "congestible" public goods, such as police protection and road maintenance.4 As a result, the HHS study comes to the odd conclusion that almost everyone is a net fiscal contributor — even though the federal government has been running a deficit, and most states are perpetually cash-strapped.5
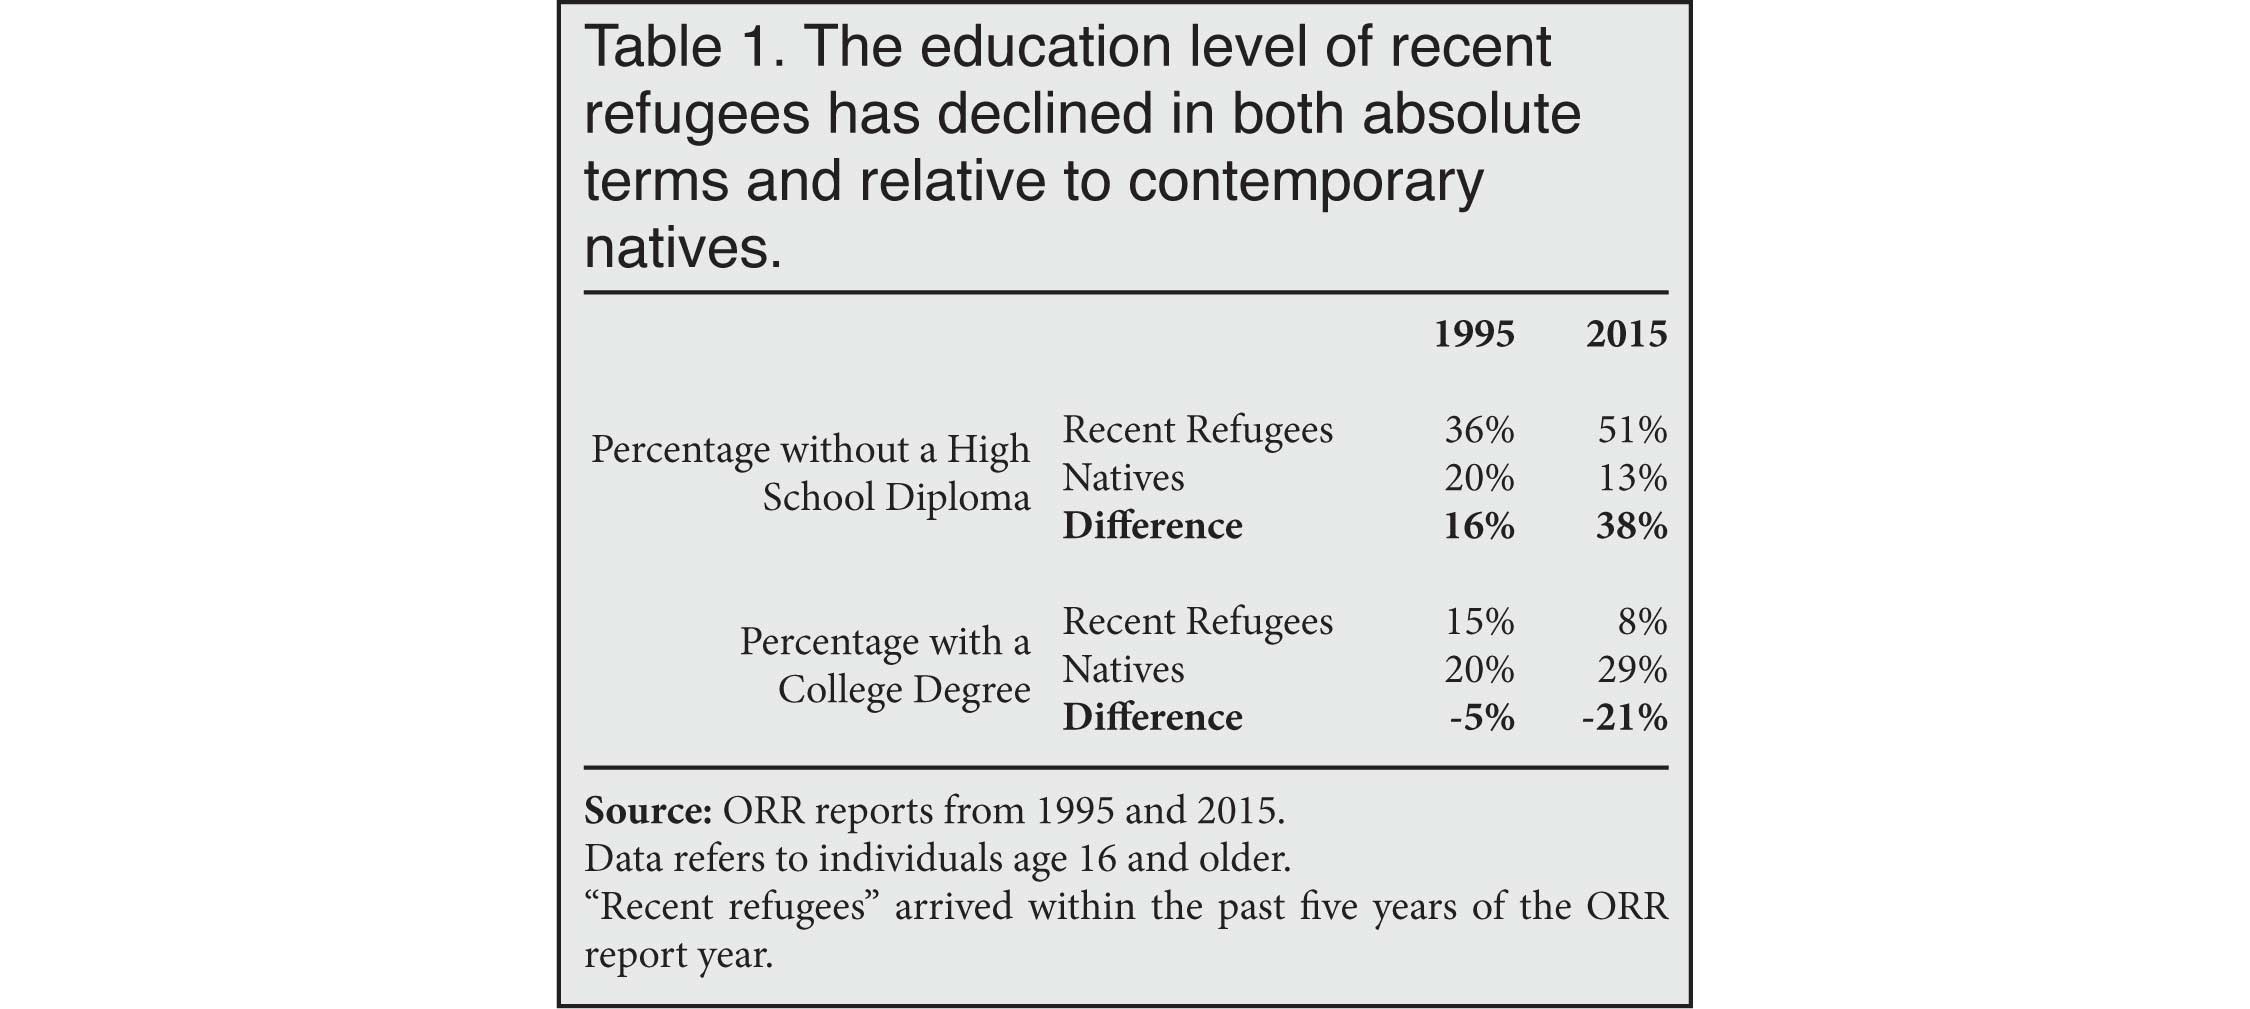
The second problem is one of interpretation. In order for either study to be relevant to current policy, one must assume that today's refugees are just like yesterday's. In the 20th century, the United States took in several groups of higher-skill refugees — for example, Cubans after Castro's takeover, South Vietnamese after the fall of Saigon, Soviet dissidents in the 1980s, Eastern Europeans in the 1990s, and so on. Today, refugees come mainly from less developed parts of the Middle East, Africa, and South Asia. The difference is evident in the education data published by the Office of Refugee Resettlement (ORR) in 1995 vs. 2015. As Table 1 indicates, the education level of refugees declined both in absolute terms and relative to natives. For example, the fraction of refugees without a high school diploma increased from 36 percent to 51 percent between 1995 and 2015, while the rate decreased from 20 percent to 13 percent for natives over the same time period.6
It is unrealistic to imagine that the current group of refugees, or those who are likely to be admitted in the near future from places such as the Middle East or Africa, will be as economically productive as the prior group of refugees. For that reason, we project the fiscal impact of refugees based on their own characteristics as new immigrants, not on the characteristics of a different group of refugees from the past.
Finally, we emphasize that our analysis is intended to be comprehensive. The popular press often circulates collections of factoids — e.g., how quickly refugees learn English, or how much disposable income they have — that are insufficient to assess the fiscal impact of refugees.7 There is no substitute for an analysis that takes all taxes and spending into account.
Results
Table 2 has three main rows. The first row, "National Academies' Model", gives the lifetime fiscal impact of immigrants who have the educational profile of refugees, categorized by their age of entry into the United States. We did not make any adjustments for refugee-specific costs in this row. Because the National Academies created eight separate scenarios using different budgetary assumptions, we report the fiscal impacts that are highest (best for taxpayers) and lowest (worst for taxpayers), as well as the median impact, which is our preferred estimate. A positive number in the table means a gain for taxpayers; a negative number means a loss.
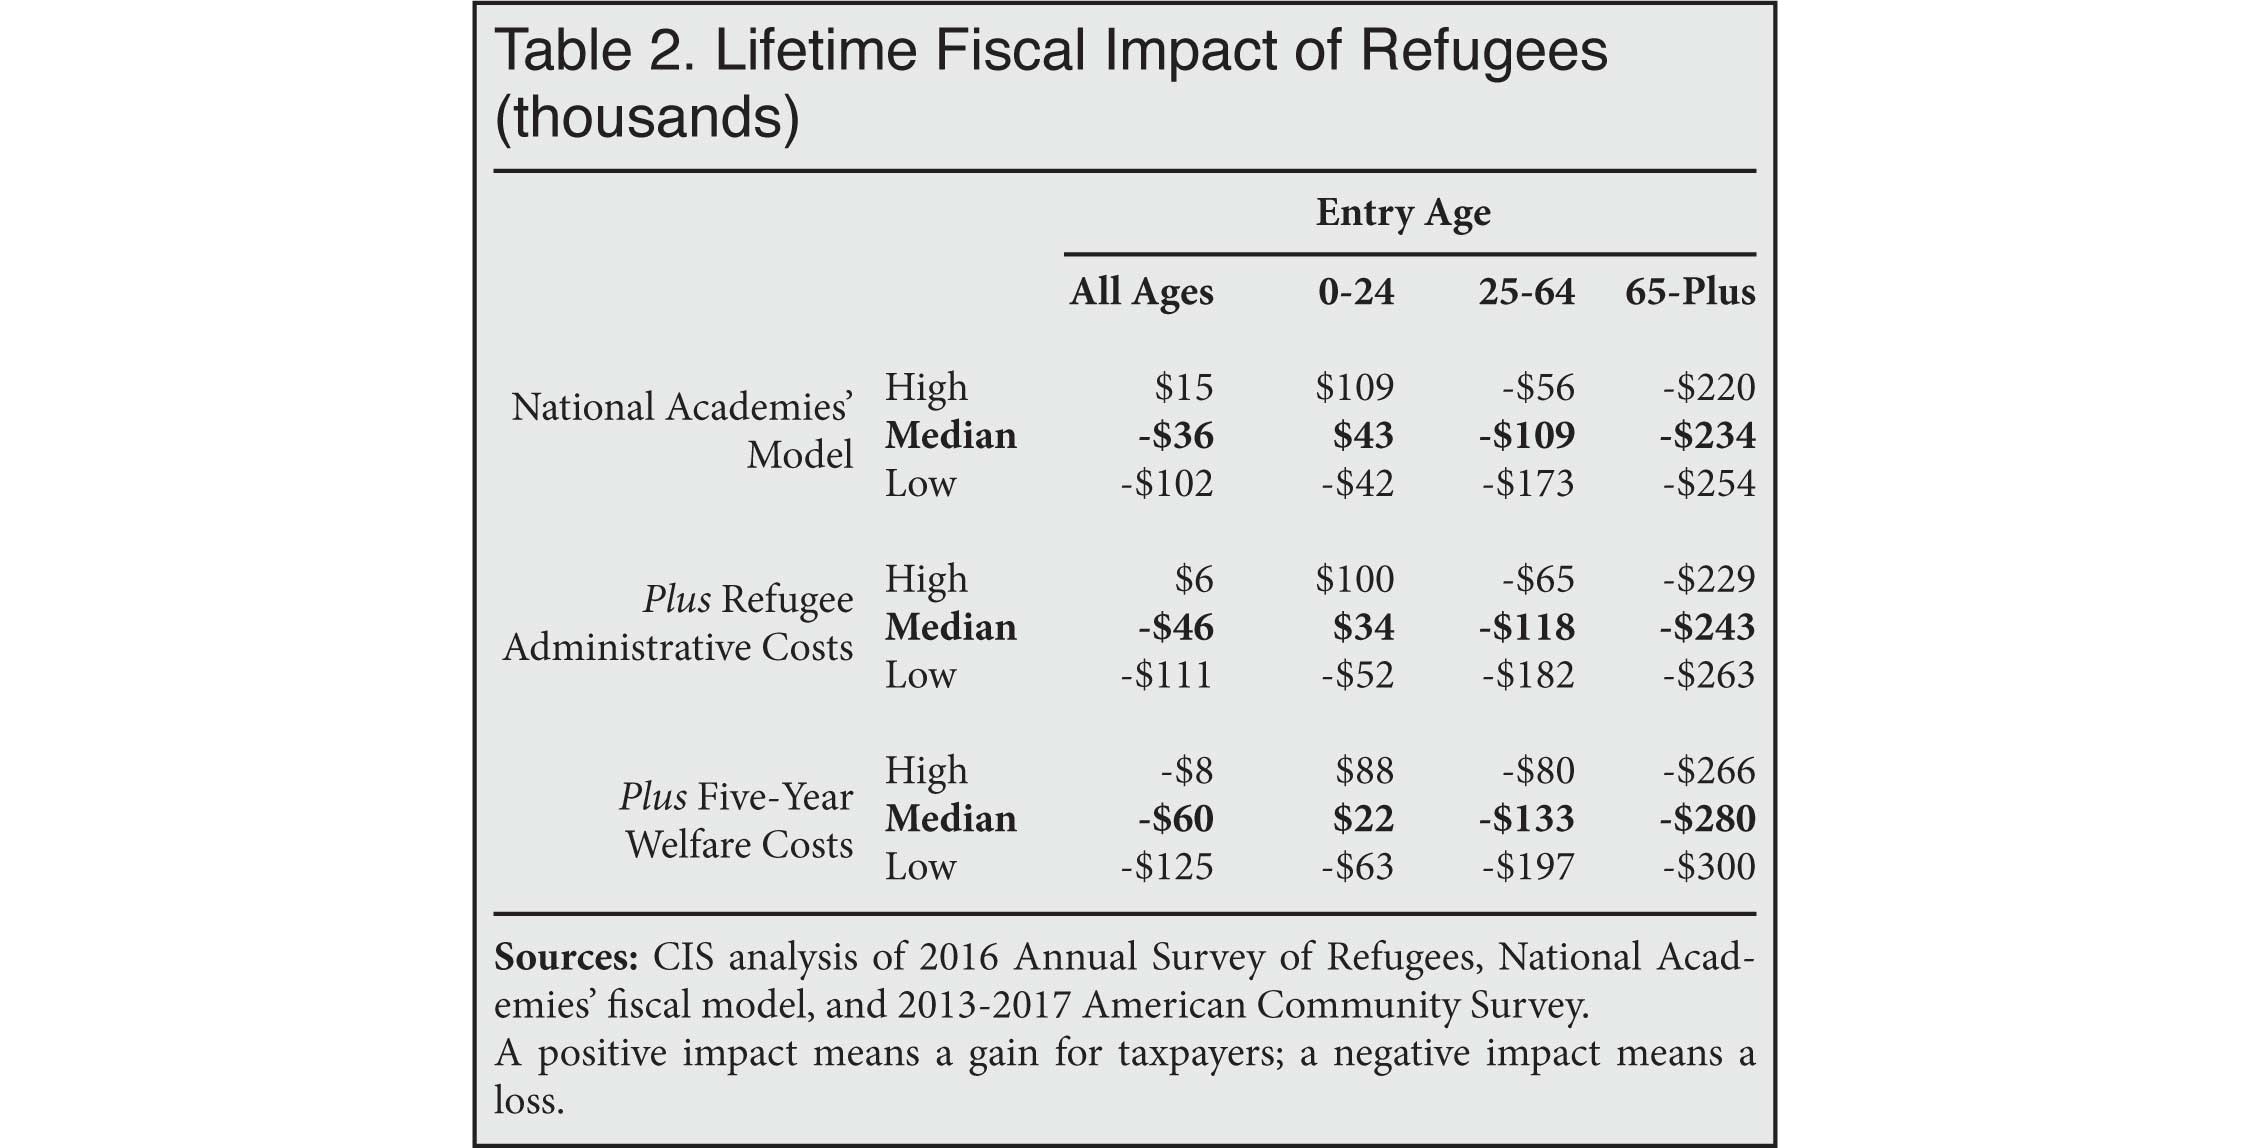
The National Academies' model is based on all types of immigrants, not refugees in particular, so we make additional adjustments in the next two rows. The second row, "Plus Refugee Administrative Costs", adds $9,230 to reflect per-refugee administrative expenditures by the State Department and ORR.
The third row, "Plus Five-Year Welfare Costs", adds additional costs based on refugees' immediate access to welfare programs. (Most other immigrants cannot access programs such as Medicaid and food stamps until they have established five years of legal permanent residency.)
As the median estimate in the "Plus Five-Year Welfare Costs" row and "All Ages" column indicates, the average refugee imposes a cost of roughly $60,000 in net present value over his or her lifetime. In the most optimistic scenario, that cost falls to $8,000. In the most pessimistic scenario, it rises to $125,000.
No plausible model, not even the National Academies’ best-case scenario, comes close to suggesting that refugees who enter as adults will be net fiscal contributors. Refugee-specific costs add about 22 percent over and above the cost of other immigrants, but low education by itself is enough to push adult refugees' estimated fiscal impact well into negative territory. The National Academies is more optimistic about the children of low-skill adult immigrants, whom the model assumes will surpass their parents' education levels. But even with favorable assumptions about refugee children, the overall impact (all age groups combined) is still clearly negative.
Detailed Methods
The one-sentence version of our method is that we used the National Academies' fiscal model as a base estimate, and then we made adjustments to reflect added refugee costs within the first five years of their arrival. The base model and the adjustments are reflected in the three major rows of Table 2 above, and we explain them in greater detail below.
National Academies' Model. This model, which includes all taxes and spending at all levels of government, projects immigrant fiscal impacts for eight different budgetary scenarios.8
Each of those scenarios contains estimates for five education categories — less than high school, high school, some college, college, and more than college — and three age-at-arrival levels — 0-24, 25-64, and 65 and over. These estimates are "net present values", meaning future values have been discounted (reduced) to reflect the time value of money. In essence, the entire stream of future costs and benefits has been consolidated into a single upfront payment.9
We use these estimates to assign each recent refugee a lifetime fiscal cost based on his or her entry age and education.10 For example, if a refugee entered at age 39 and has 10 years of education, we assign that refugee the cost of an immigrant who arrived between the ages of 25 and 64 and who has less than a high school diploma. Summing over all refugees produces the results in the "National Academies' Model" row in Table 2. Because there are eight budgetary scenarios, we report the high, low, and median fiscal impacts from that set of eight.
Information on the age and education of refugees comes from the 2016 Annual Survey of Refugees (ASR). Conducted by ORR, the ASR samples from a cross-section of refugees who arrived between 2011 and 2015, and it covers the period of refugee resettlement before the restrictions imposed by the Trump administration.11 It is the first version of the ASR for which the microdata are available to researchers.
Although the ASR provides a valuable set of data, it does have two significant limitations. First, 23 percent of recent refugees speak languages so obscure that none of the 16 foreign-language versions of the interview were suitable for them.12 Because speakers of obscure languages tend to come from remote areas, and because secondary schools usually offer instruction in a more popular language, most of the excluded refugees must have arrived with education levels well below the average of the 77 percent who were covered. The survey designers attempted to adjust for this problem using the sampling weight, but missing such a large and non-random subset of the population could reduce the sample's precision.
A second limitation of the ASR is that responses to the education questions do not map neatly on to the five education categories used by the National Academies. Table 3 below explains how we derived the familiar five education categories from the ASR questions on the highest degree obtained and years spent in school.

Refugee Administrative Costs. According to previous CIS research, refugee resettlement costs the State Department $4,433 per refugee, while ORR pays $4,797 per refugee, for a total of $9,230.13 The "Plus Administrative Costs" row in Table 2 displays the sum of the $9,230 value and the estimates from the "National Academies' Model" row. Because administrative costs occur at arrival, no time discounting is necessary.
Five-Year Welfare Costs. Although refugees may differ in several ways from the average immigrant modeled by the National Academies, we focus on the clearest legal difference — namely, that refugees are immediately eligible for federal welfare programs, while most other immigrants must be legal permanent residents for five years before accessing benefits. The "Plus Five-Year Welfare Costs" row in Table 2 includes the added cost of Medicaid, cash assistance, food stamps, and housing benefits that refugees consume in excess of what the average immigrant consumes within the first five years. Refugees may continue to consume more welfare dollars than the average immigrant in their age and education group beyond the first five years, but we do not attempt to estimate that difference due to data limitations.
To estimate five-year welfare costs, we first identify "high-refugee countries", meaning places that send primarily refugees to the United States rather than other types of immigrants. These countries are Bhutan, Burma, Congo/Zaire, Iraq, Somalia, Sudan, and Eritrea, which accounted for 86 percent of all refugees between 2010 and 2015.14 We use the 2013-2017 American Community Survey (ACS) to estimate the cost of food stamps, cash assistance, and Medicaid among immigrants from these countries who arrived in the prior five years.15 Because the ACS lacks information on housing benefits, we use a combined three-year sample of the Current Population Survey (CPS) to identify those in public or rent-subsidized housing. Following the National Academies example, we adjust for undercount of welfare expenditures in Census surveys by adjusting the totals to match administrative data.16
To ensure that we are capturing only added costs associated with refugee status, we subtract the welfare costs associated with all recent immigrants from the costs associated with immigrants from the high-refugee counties.17 We sum these excess costs over five years of welfare eligibility, discounting at 3 percent in accordance with the National Academies. The net present value of the five-year welfare costs, broken down by age and education, are displayed in Table 4.
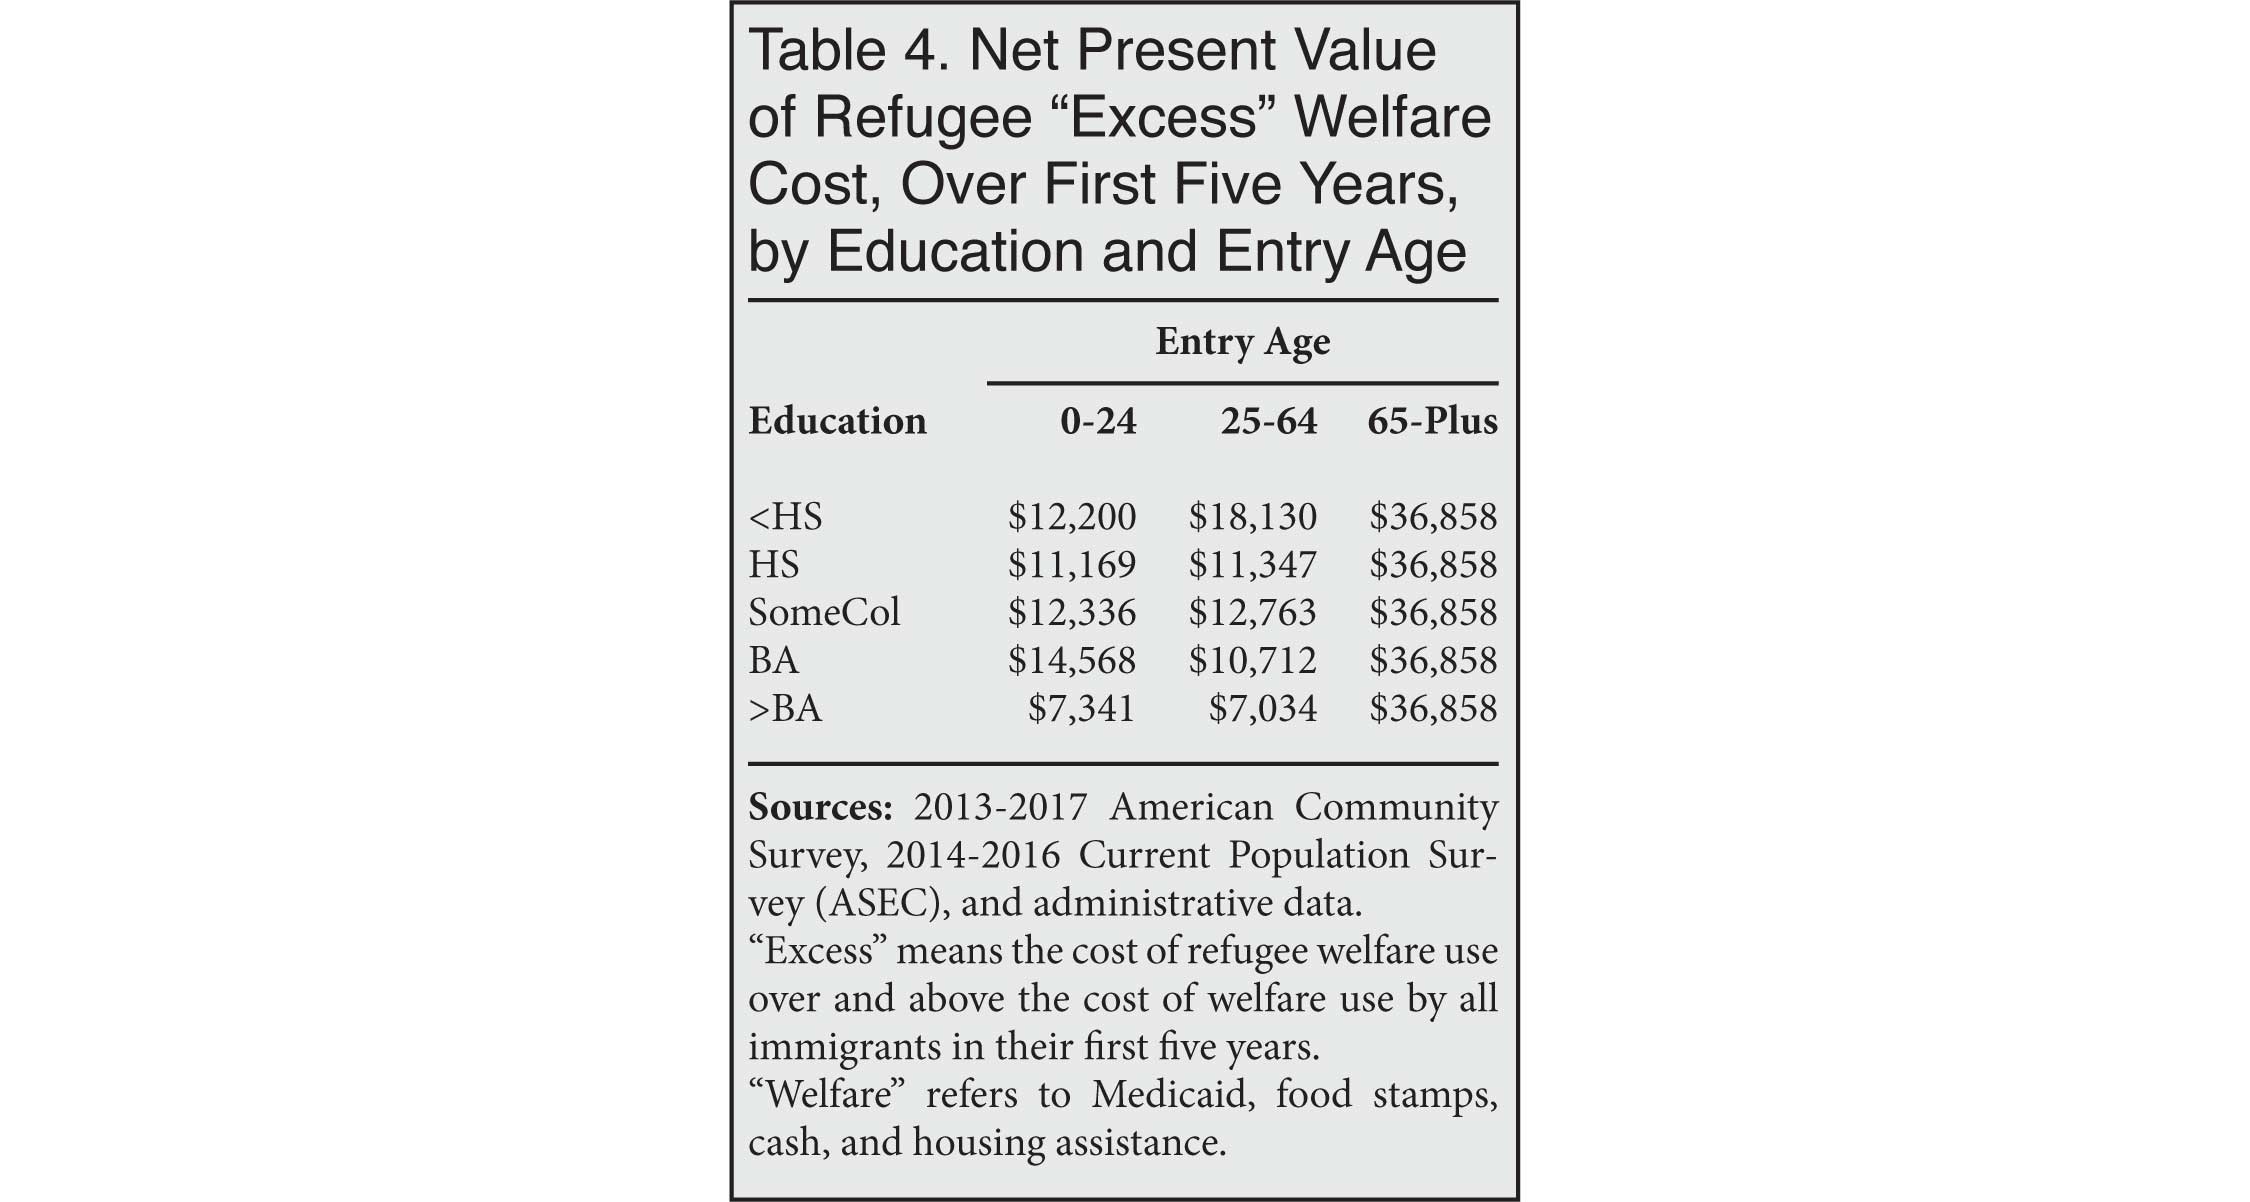
Because so few refugees are elderly — only about 2.5 percent of refugees in the ASR were 65 or older upon arrival — our sample of age-65-plus immigrants from high-refugee countries in the ACS was too small to divide by education. We instead assigned the age-65-plus refugees the average cost of all education levels within their age group.
Conclusion
There is a tendency for partisans on both sides of the immigration debate to believe that their values are always reflected in economic data. For example, advocates have asserted that accepting refugees is not only a moral imperative but also a fiscal boon. Similarly, when concerns arise about the cultural compatibility of refugees with American communities, opponents insist the economic cost must be enormous.
In reality, the fiscal impact of refugee resettlement is just one aspect of a more complex issue involving economic, social, and political considerations. The purpose of this report is not to argue that all refugee resettlement is wrong, but rather to remind policymakers that there are costs associated with the program. Specifically, we find that the average refugee will cost around $60,000 in net present value over his or her lifetime, with adult refugees costing upwards of $133,000. These costs are due mainly to the low levels of education possessed by refugees upon their arrival.
Most refugees admitted to the United States have "no immediate medical, social, or security concerns which would merit expedited processing."18 Given the costs, it may be possible to help a greater number of displaced people overseas rather than paying to settle them here. Overseas assistance could allow some refugees to eventually resettle in countries where they have stronger cultural or historical ties than they do with the United States.19 In addition, many refugees are in temporary camps near their homes. Assisting host governments, NGOs, and the U.N. High Commissioner for Refugees with supporting these individuals until they can return home is another way the United States may be able to more effectively leverage its resources.
End Notes
1 Outside of a U.S. context, most media outlets seem to understand that low-skill migrants strain government resources. For example, the New York Times uncritically cited the "dire" economic consequences predicted by Mexican officials if their country became the last resort for refugees and asylees. (Michael D. Shear and Azam Ahmed, "Mexico and the U.S. Have Made Progress Toward Averting Tariffs", The New York Times, June 6, 2019.) Yet the Times also trumpeted the HHS study discussed below claiming refugees are net fiscal contributors in the United States. ("Rejected Report Shows Revenue Brought In by Refugees", The New York Times, September 19, 2017.)
2 William N. Evans and Daniel Fitzgerald, "The Economic and Social Outcomes of Refugees in the United States: Evidence from the ACS", NBER Working Paper No. 23498, June 2017.
3 "The Fiscal Costs of the U.S. Refugee Admissions Program at the Federal, State, and Local Levels, from 2005-2014", unfinished draft, Department of Health and Human Services, July 29, 2017.
4 Excluding public goods is sensible when considering the fiscal impact of adding a few refugees, but adding large numbers of people creates new costs for services such as road maintenance and law enforcement, particularly in small towns with high concentrations of newcomers.
5 In fairness to the author (or authors) of the HHS study, revisions may have been intended for a final version that was never completed.
6 Note that we use 2015 in Table 1 rather than 2016. The refugee survey was revamped in 2016, breaking comparability with past years. ("Annual Report to Congress: Fiscal Year 2016", Office of Refugee Resettlement, p. 70.) Also note the age range of 16 and older – it is the only age range for which ORR published information on education before 2016.
7 See, for example, "From Struggle to Resilience: The Economic Impact of Refugees in America", New American Economy, June 19, 2017.
8 National Academies of Sciences, Engineering, and Medicine, The Economic and Fiscal Consequences of Immigration, Francine D. Blau and Christopher Mackie, Eds., Washington, DC: The National Academies Press, 2017, Table 8-12.
9 The National Academies used a 3 percent "discount rate" to calculate present values. Applying a 3 percent discount rate converts the value of $103 paid next year to $103/(1 + 0.03) = $100 today. Similarly, $103 paid two years from now has a present value of $103/(1 + 0.03)2 = $97.09 today. Discounting is simply a means of making costs comparable when they occur at different points in time. Without discounting, the total dollars spent on refugees over their lifetimes will obviously be greater than the present value. For example, in the calculation above, $103 is to be paid next year, and another $103 is to be paid the year after that. By discounting, we can see that stream of payments is equal to a single upfront payment of $100 + $97.09 = $197.09. The actual outlays, of course, will still be $103 + $103 = $206 over two years.
10 In the 25-64 and 65-plus age columns, education refers to the education level of the immigrants themselves. In the 0-24 age column, however, some new immigrants are still in school, so education refers to the education of the immigrants' parents. The National Academies generally expects the education of a child immigrant to be higher than the level of his or her parents. That assumption of educational gains allows the projected fiscal impact of young immigrants to be positive in some scenarios even when their parents do not have high school diplomas.
It is reasonable to expect immigrants who arrive before their late teenage years to continue their education upon arrival. (Indeed, the National Academies modeled educational improvement by selecting immigrants who were between the ages of 10 and 16 and comparing their education 15 years later with the education of their parents.) It is less reasonable, however, to assume that immigrants who arrive between the ages of 19 and 24 will make large educational gains. About 13 percent of refugees ages 0 to 24 in the ASR are immigrants whom we call "independent youths" — between the ages of 19 and 24, not currently in school, and either head of their own household or the spouse of a household head. The National Academies overstates the fiscal impact of these independent youths by assuming educational gains that are not realistic given their age and life circumstances. For the analysis in this report, we considered an adjustment that would shift independent youths into the age 25-64 column for cost purposes. However, we felt that would be an over-correction, as independent youths do at least have more working years ahead of them than their counterparts in the 25-64 column.
11 The Trump administration has lowered the annual number of refugees resettled in the United States from 85,000 in FY 2016 to 30,000 in FY 2019. The cap for FY 2020 has been set at 18,000. See Jens Manuel Krogstad, "Key Facts About Refugees to the U.S.", Pew Research Center, October 7, 2019.
In addition, the White House is setting more of its own priorities rather than relying on the UN when selecting which refugees to resettle. This year, religious minorities and Iraqis who assisted the U.S. military have a high preference. See Nayla Rush, "The Trump Administration's Long Overdue Revision of the Refugee Resettlement Program", Center for Immigration Studies, September 30, 2019.
12 One could hardly accuse the ASR designers of being inattentive to translation needs. Included among the 16 foreign-language versions of the survey were Sgaw Karen, Tedim, Tigrinya, Lai, Kinyarwanda, and Chaldean — dialects that are, of course, rarely heard in the United States. Attempting to cover the remaining 191 languages spoken by refugees would have been cost-prohibitive. (Timothy Triplett and Carolyn Vilter, "2016 ASR Annual Survey of Refugees Data File User's Guide: A Technical Research Manual", Department of Health and Human Services, July 2018, p. 8.)
13 Steven Camarota, "The High Cost of Resettling Middle Eastern Refugees", Center for Immigration Studies Backgrounder, November 4, 2015, Table 1.
14 "Yearbook of Immigration Statistics", Department of Homeland Security, years 2012 and 2015, Table 14.
15 Medicaid costs per individual enrollee reflect age and disability status as reported in the ACS. "Medicaid Spending Per Enrollee (Full or Partial Benefit): FY2014", Kaiser Family Foundation, undated.
16 We match total expenditures found in the "Historical Tables" published by the Office of Management and Budget.
17 One may wonder how recent immigrants who are not refugees can consume welfare, given the five-year residency requirement. There are other special categories of immigrants — asylees, spouses eligible for expedited naturalization, children in certain states, etc. — who are also exempted from the five-year rule. In addition, food stamps and housing subsidies are household-level variables that may be received by an eligible resident even when the household head is ineligible. Finally, some immigrants may simply misreport their year of arrival or their welfare use.
18 Nayla Rush, "For Most Refugees, Resettlement Is Not a Matter of Life and Death", Center for Immigration Studies, July 25, 2018.
19 Burma's Rohingya people, who are Muslims from a predominantly Buddhist country, have resettled in Muslim Bangladesh. Bantu tribesmen, whose ancestors were brought to Somalia by Arab slave traders, have resettled in parts of their tribal homeland in Tanzania and Mozambique.