Download a PDF of this Backgrounder.
Steven A. Camarota is the director of research and Karen Zeigler is a demographer at the Center.
Newly released public-use data from the Census Bureau's 2018 American Community Survey (ACS) shows 1.45 million new legal and illegal immigrants settled in the United States in 2017, fewer than the 1.75 million in 2016 or the 1.62 million in 2015.1 It should be pointed out that the 2018 ACS reflects the population on July 1, so it would not capture most of the surge in illegal immigrant families and unaccompanied minors released into the United States at the southwest border in all of 2018. The ACS was also collected before the even more dramatic increase in families and children arriving in 2019.2 The falloff in arrivals in 2017 may be due to increased enforcement efforts, lower refugee admissions, and more robust vetting of applicants undertaken by the Trump administration.
On November 14, the Census Bureau made available the public-use data from the ACS, allowing researchers a more detailed look at the nation's demographics, including the individual year of arrival for immigrants. This information was not available from the more generalized ACS information released by the Bureau last month. Newly arrived immigrants in the ACS include new green card recipients as well as long-term "temporary" visitors (e.g. guestworkers and foreign students) and illegal immigrants.
Among the findings:
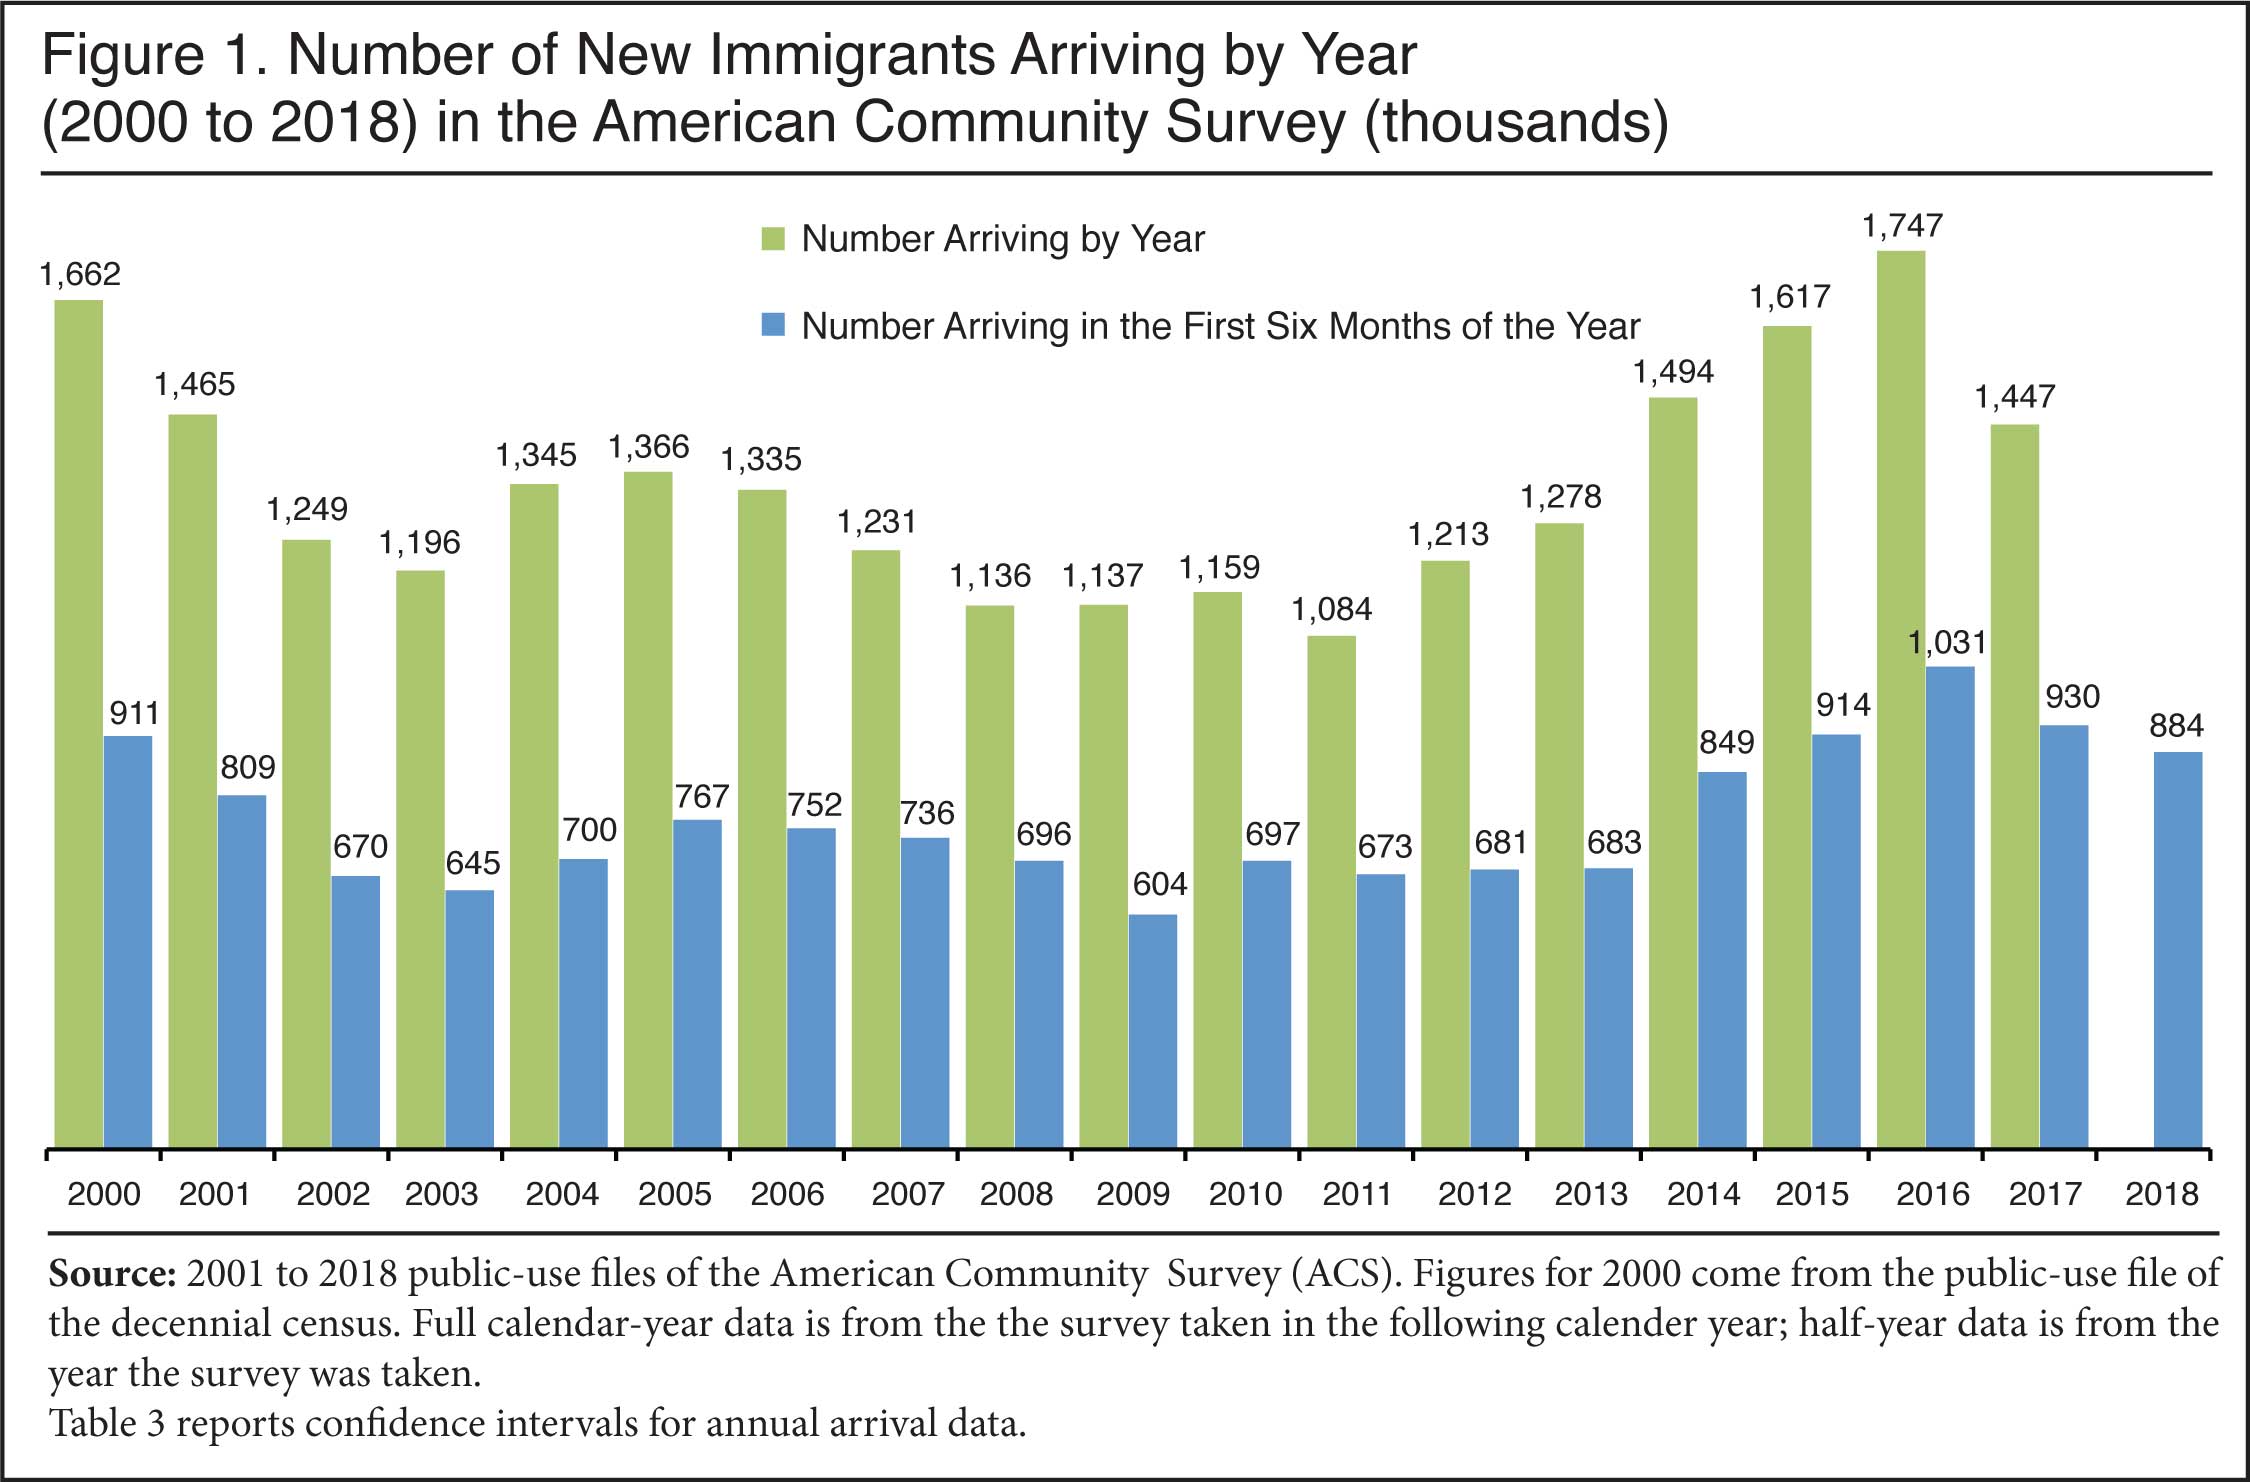
- Newly released data from the 2018 American Community Survey (ACS) shows 1.45 million immigrants (legal and illegal) arrived in 2017. This may indicate an end to the post-2011 surge in new arrivals. Between 2011 and 2016, the number of new immigrants arriving annually increased steadily from 1.08 million immigrants to 1.75 million immigrants. (Figure 1)
- While lower than in 2016 and 2015, the 1.45 million immigrants who came in 2017 roughly matches the level in 2014 and was higher than any year between 2002 to 2013. (Figure 1)
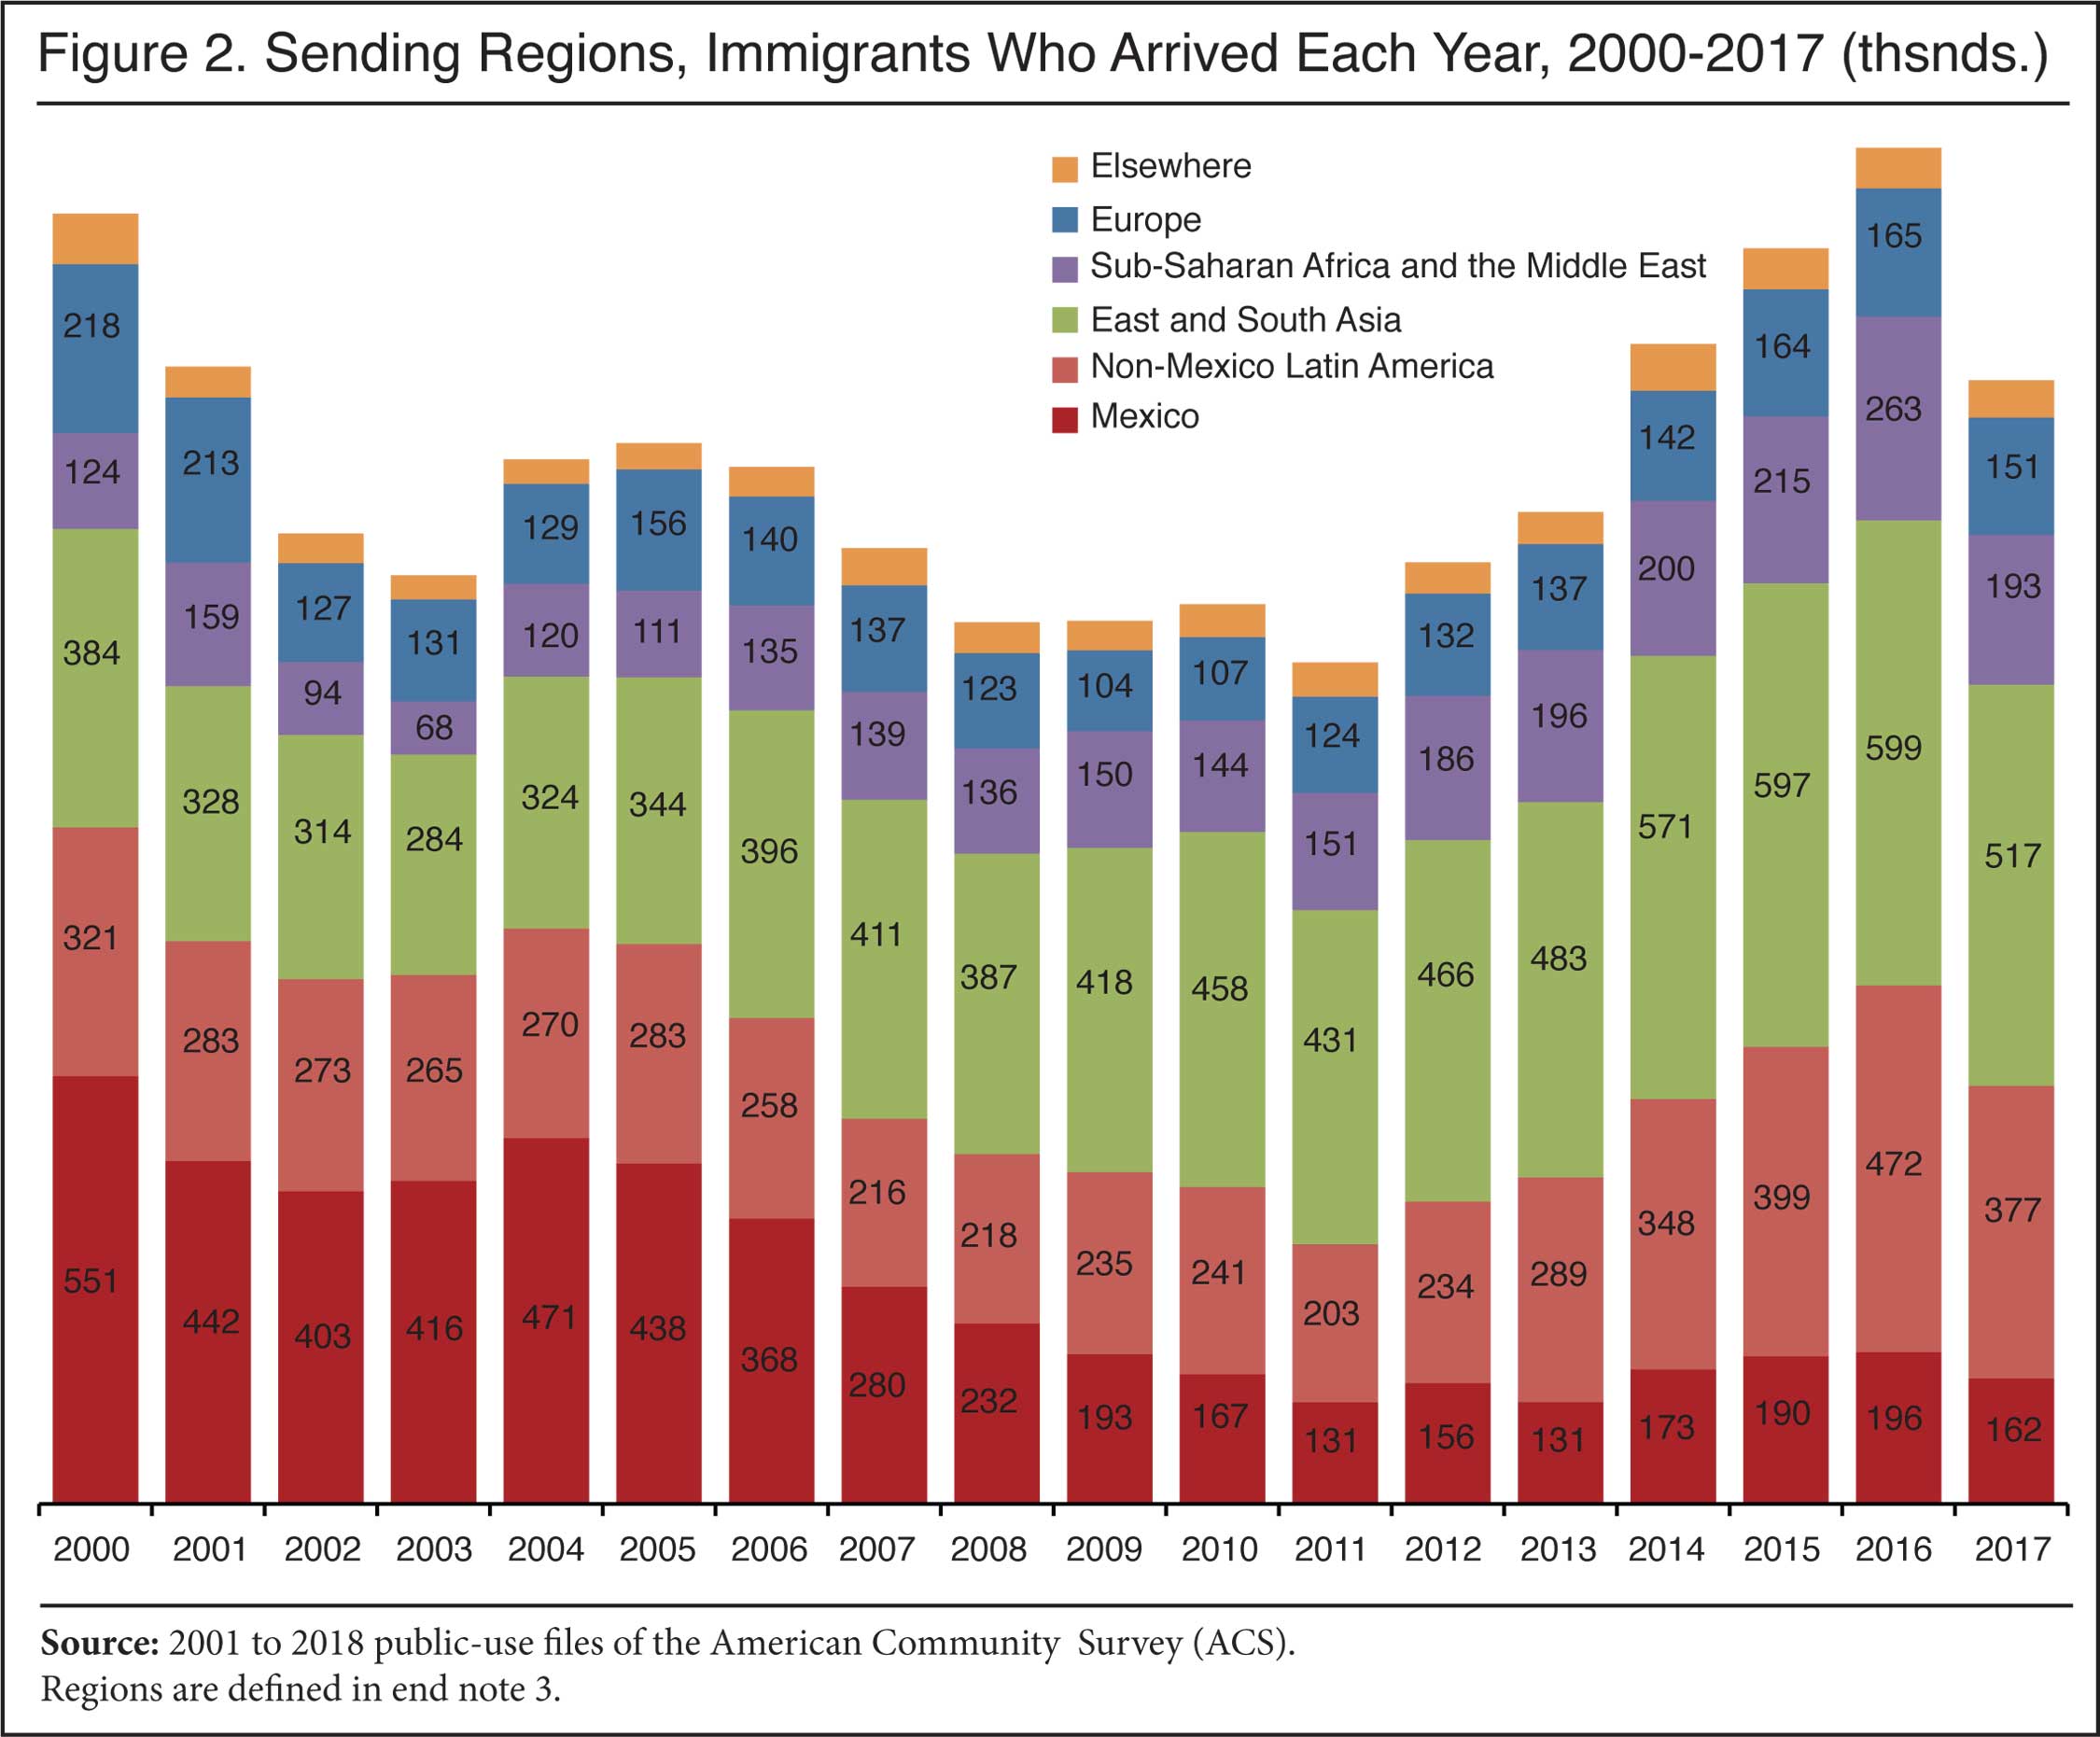
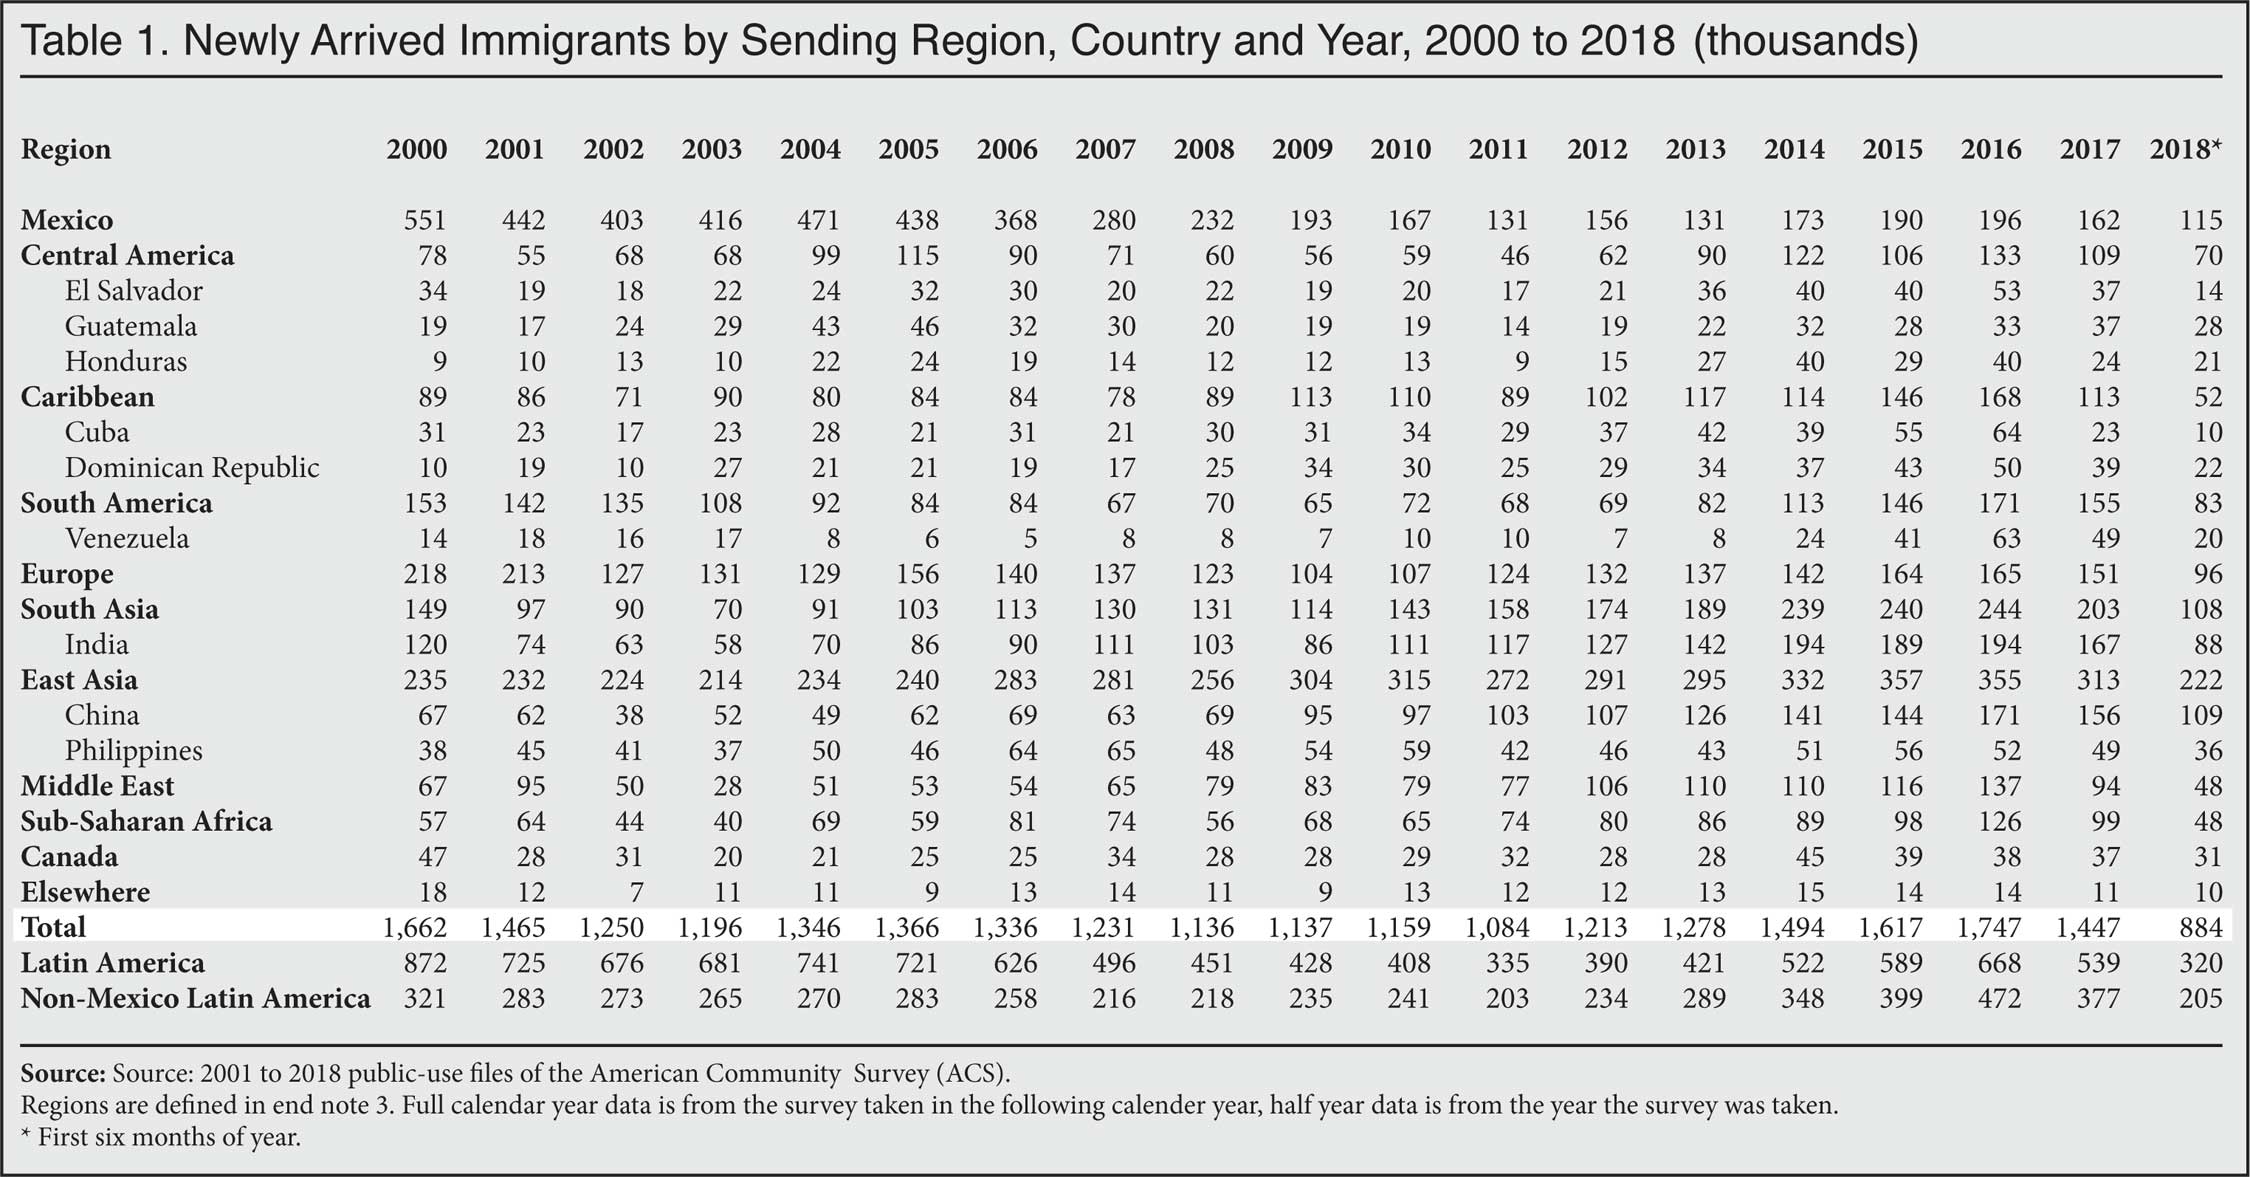
- The decline in new arrivals was very broad, impacting ever major sending region. As a result, the relative shares that each region accounted for held roughly constant between 2016 and 2017. (Figure 2, Table 1)
- As was the case in 2016, Latin America (37 percent) was the top sending region, accounting for a slightly larger share of new immigrants than East and South Asia (36 percent) combined. East and South Asia accounted for the largest share of new immigrants from 2010 to 2015.3 (Figure 2, Table 1)
- While the number of arrivals in 2017 from every region was lower than in two prior years, the number coming from just about every part of the world was still higher in 2017 than it was between 2002 and 2013. (Figure 2, Table 1)
- Data for the first six months of 2018 indicates that the number of new arrivals may be similar to 2017, however this number is only preliminary. (Figure 1)
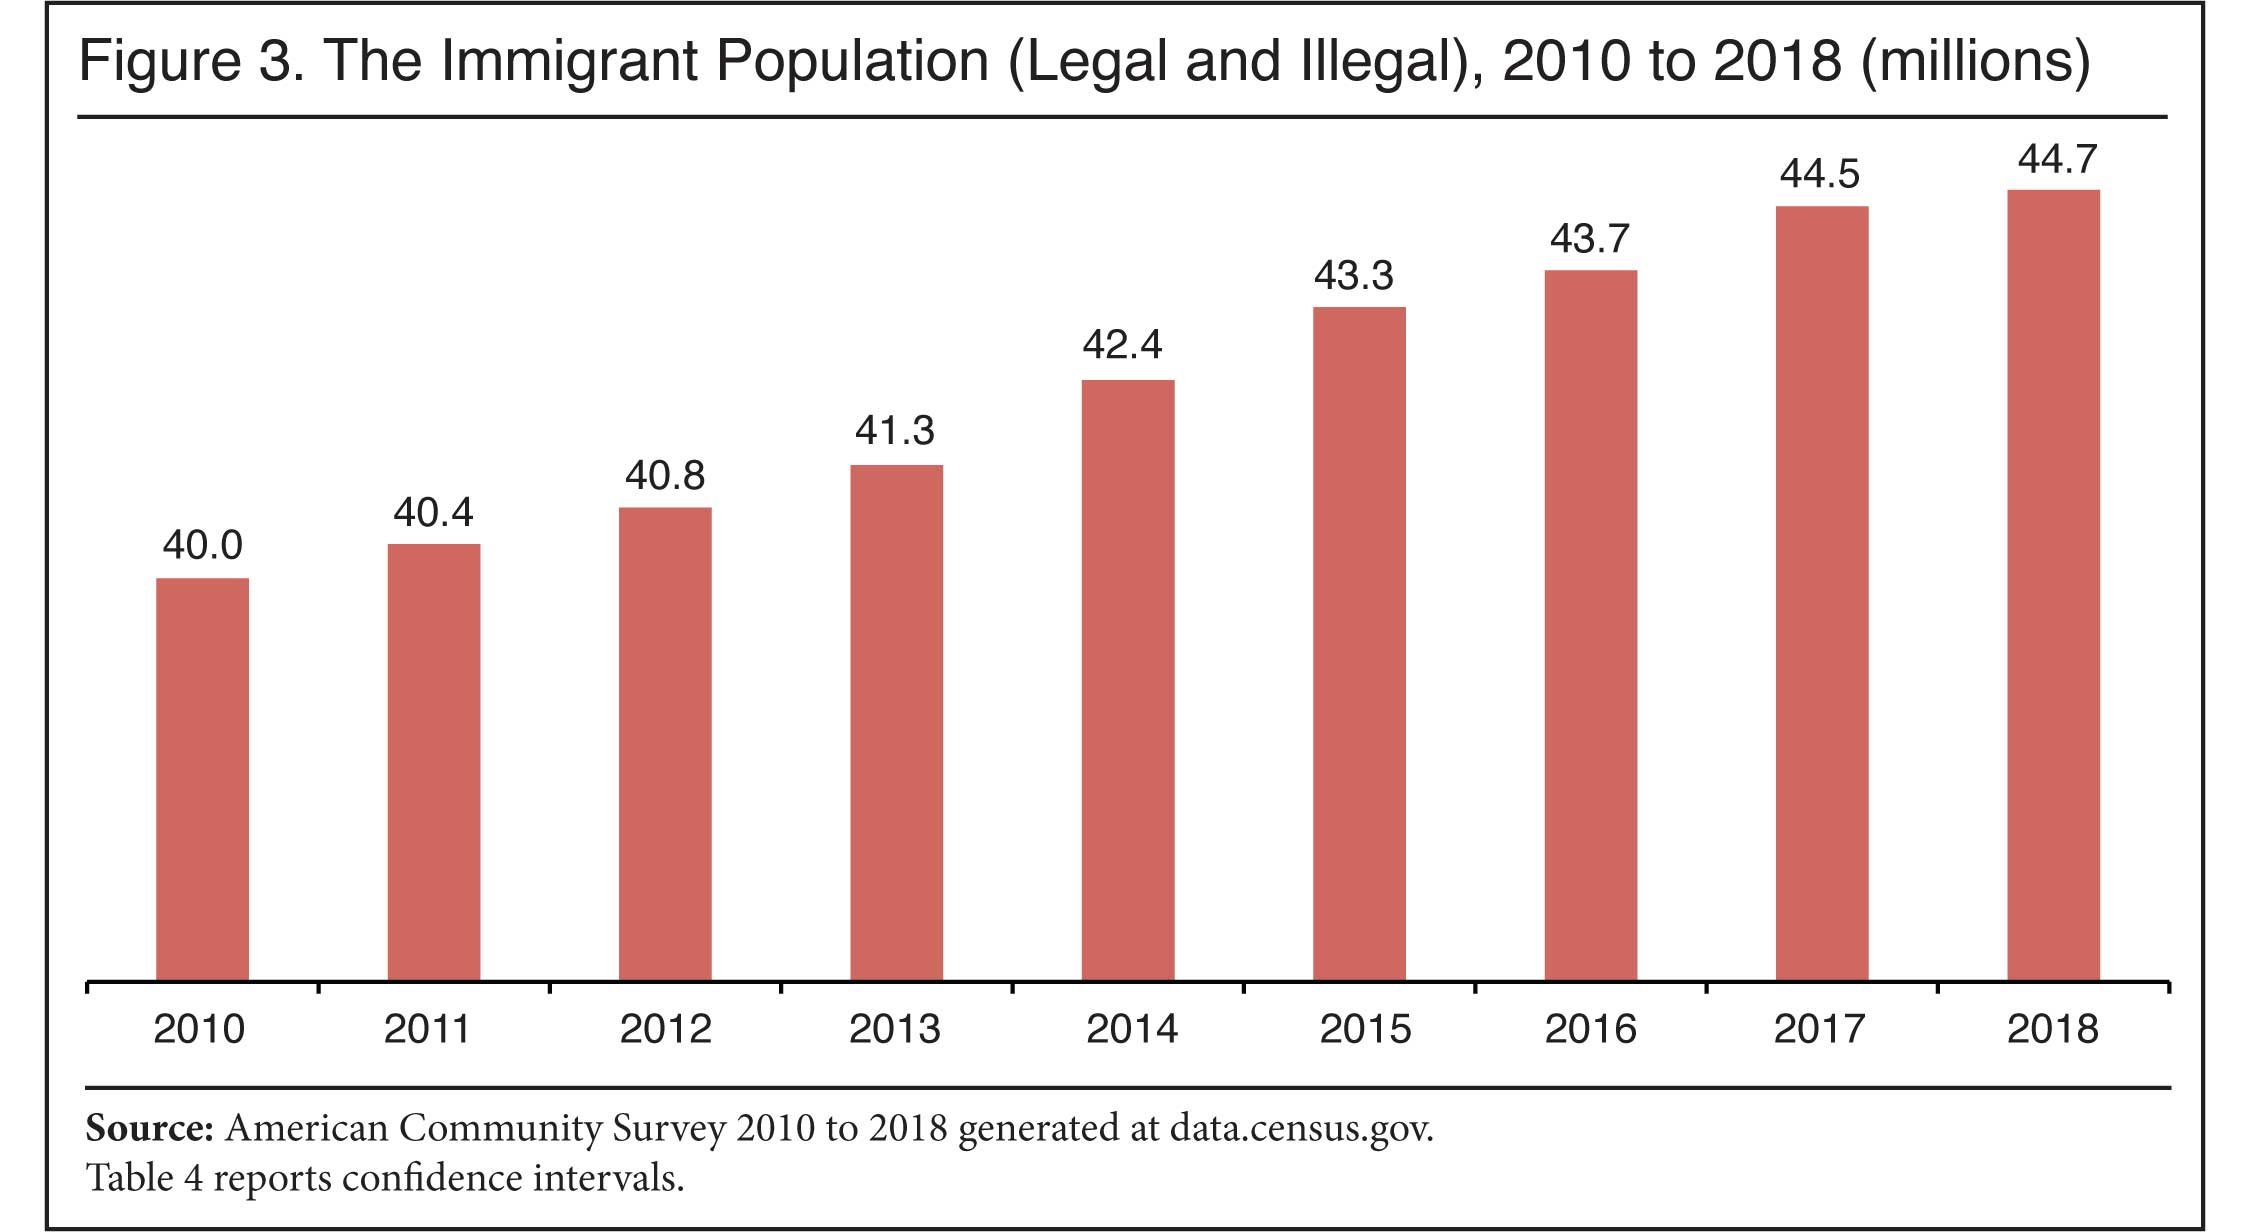
- In an analysis published last month, the Center for Immigration Studies reported that the Census Bureau's other large survey that measures immigrants, the Current Population Survey (CPS), showed a significantly larger total number of immigrants in 2018 (45.8 million) vs. the total shown in the ACS (44.7 million); it is not clear why the two surveys do not agree.4
- In addition to showing a larger total immigrant population in 2018 than the ACS, the CPS also shows significantly more growth between 2017 and 2018 than the ACS — 200,000 vs. 1.6 million. Unfortunately, the CPS does not report individual year of arrival, so it is not directly comparable to the ACS in this regard.5
- The much larger growth in the CPS from 2017 to 2018 could be an indication that the level of new immigration was higher than shown in the ACS. However, at this point there is no clear indication that this is the case.
Data Source. On November 14, the Census Bureau released the public-use data from the 2018 American Community Survey (ACS). The survey reflects the U.S. population as of July 1, 2018. The ACS is by far the largest survey taken by the federal government each year and includes over two million households. Last month, the Bureau posted some of the results from the ACS at data.census.gov. However, only by downloading the newly released public-use micro data from the ACS and analyzing it is it possible to determine an individual's year of arrival. The tables generated from data.census.gov do not allow this level of detail.
Immigrants, including recent arrivals, are typically referred to as the "foreign-born" by the Census Bureau. These are individuals who were not U.S. citizens at birth. It includes naturalized citizens, legal permanent residents (green card holders), temporary workers, and foreign students. It does not include those born to immigrants in the United States, including to illegal immigrant parents, or those born in outlying U.S. territories such as Puerto Rico. In addition, prior research by the Department of Homeland Security and others indicates that some 90 percent of illegal immigrants respond to the ACS.6 Thus all the figures reported above are for both legal and illegal immigrants.
Newly arrived immigrants captured in the Census Bureau's ACS include the foreign-born as described above. It does not include those who come to the United States for short stays such as tourists or business travelers. The ACS uses a two-month rule to determine who will be included in the survey. That is, the survey counts anyone residing for at least two months at an address. While there are very few newly arrived immigrants in institutions, the ACS does include that population as well, which includes prisons and nursing homes. Since the survey represents the population at mid-year, it is necessary to wait until next year's ACS is released to get a complete picture of the total number of immigrants for the year. So, for example, the total number of new arrivals in 2017 became available once the 2018 public-use data was available.
 |
 |
 |
 |
 |
 |
End Notes
1 The ACS reflects the population of the United States on July 1 of each year. Immigrants are asked when they came to the United States in the survey. To obtain a full calendar year of arrival data, it is necessary to use the following year's survey. So the 2018 ACS provides information on the number of immigrants who arrived in all of 2017, but only the first six months of 2018. The 2019 ACS will provide the total number of arrivals in 2018.
2 The total number of apprehensions and inadmissible persons on the Southwest border increased from 416,000 in FY 2017, to 521,000 in FY 2018, and to 978,000 in FY 2019. The total number of unaccompanied minors and individuals in family units, subgroups of all those apprehended or turned away at the border, was 117,000 in 2017, 157,000 in 2018, and 550,000 in 2019. Some minors and individuals in family units were turned away and others were subject to the "Remain in Mexico" policy. However, the overwhelming majority of these individuals were released into the United States in all three years.
3 The regions in this report are defined in the following manner: Countries that can be identified in the public-use 2018 ACS file are coded as the following regions: Mexico; Central America: Belize, Costa Rica, El Salvador, Guatemala, Honduras, Nicaragua, and Panama; South America: Argentina, Bolivia, Brazil, Chile, Colombia, Ecuador, Guyana, Paraguay, Peru, Uruguay, Venezuela, and South America not specified; Caribbean: Bermuda, Cuba, Dominican Republic, Haiti, Jamaica, Antigua-Barbuda, Bahamas, Barbados, Dominica, Grenada, St. Lucia, St. Kitts-Nevis, St. Vincent, Trinidad and Tobago, and Caribbean and West Indies and Americas not specified; South Asia: India, Bangladesh, Pakistan, Sri Lanka, Bhutan, and Nepal; East Asia: China, Hong Kong, Taiwan, Japan, Korea, Cambodia, Indonesia, Laos, Malaysia, Philippines, Singapore, Thailand, Vietnam, Burma, Mongolia, Asia not specified; Europe: Denmark, Finland, Iceland, Norway, Sweden, England, Scotland, United Kingdom, Ireland, Belgium, France, Netherlands, Switzerland, Albania, Greece, Macedonia, Italy, Portugal, Azores, Spain, Austria, Bulgaria, Czechoslovakia, Slovakia, Czech Republic, Germany, Hungary, Poland, Romania, Yugoslavia, Croatia, Bosnia, Serbia, Kosovo, Belarus, Montenegro, Cyprus, Latvia, Lithuania, Byelorussia, Moldova, Ukraine, Armenia, Georgia, Russia, USSR not specified, and Europe not specified; Middle East: Afghanistan, Azerbaijan, Kazakhstan, Kyrgyzstan, Uzbekistan, Iran, Iraq, Israel/Palestine, Jordan, Kuwait, Lebanon, Saudi Arabia, Tunisia, United Arab Emirates, Syria, Turkey, Yemen, Algeria, Egypt, Morocco, Libya, Sudan, and North Africa not specified; Sub-Saharan Africa: Cape Verde, Ghana, Guinea, Liberia, Nigeria, Senegal, Sierra Leone, Ethiopia, Kenya, Somalia, Tanzania, Uganda, Zimbabwe, Eritrea, Cameroon, South Africa, Zaire, Congo, Zambia, Togo, Gambia, Rwanda, Ivory Coast, South Sudan, and Africa and Western and Eastern Africa not specified; Canada; Oceania/Elsewhere: Australia, New Zealand, Fiji, Tonga, Marshall Islands, Micronesia, Elsewhere. The above list is for 2010 to 2018; in prior years several smaller sending countries cannot be identified individually in the ACS.
4 In this analysis we discuss at length the differences in the two surveys and how until 2018 the CPS showed fewer immigrants than the ACS.
5 The CPS Annual Social and Economic Supplement, which reflects the population in March of each year, only reports year of arrival grouped into multiple-year cohorts. The size of each arrival cohort in the public-use CPS data is 2.25 years in the odd numbered years and 3.25 years in the even numbered years. While the CPS is a very large survey, it is still much smaller than the ACS. In particular, the number of newly arrived immigrants in the CPS is modest, making it much less statically robust than the ACS. This fact coupled with the grouping of year of arrival data in different size groups every other year makes it very difficult to discern changes from year to year in the number of new immigrants in the CPS.
6 The Department of Homeland Security uses the ACS as the basis for its estimates of illegal immigrants. See A1-1 of their most recent estimate of the unauthorized immigrant population: Bryan Baker, "Estimates of the Unauthorized Immigrant Population Residing in the United States: January 2015", Department of Homeland Security, Office of Immigration Statistics, December 2018.