While the Trump administration was not widely known for its efforts to reduce discrimination against women, a mild pro-female reform started years ago by one mid-level DHS political appointee has started to pay off in the male-dominated H-1B field.
That appointee, Kathy Nuebel Kovarik, asked that DHS add a line to its H-1B application forms and pay an additional ten cents per form to record the answer about the gender of the H-1B workers. She secured the agreement of her colleagues and we now have information — albeit largely hidden — on the women and men in the H-1B workforce.
In sum, H-1B women in FY 2022, turned out to be better educated than their male peers, but were less likely to be hired in the first place, were paid 10 percent less than the men, and then were less likely to be retained for a second round of work than the men.
Here are the basic numbers as extracted from the report.
|
|
||
| Women | Men | |
| Percentage with advanced degrees* | 58.9% | 50.2% |
| Percentage of initial hires | 35.6% | 64.2% |
| Annual salaries, 2022 approvals | $118,000 | $130,000 |
| Percentage of retentions or second visas | 26.0% | 36.0% |
|
* When level of education is known; see Table 6 of report cited below. |
||
The hiring-by-country data is also revealing. While the new hires from China, the second-largest supplier of new H-1Bs, was pretty even-handed: 9,550 men to 9,274 women (see the report’s Table 4b), there were almost 2.5 men hired from India for every woman; there were 54,076 of the former and 23,451 of the latter. The male/female ratios for new hires is even worse in Pakistan.
American applicants for tech jobs, often held by H-1Bs from India, tell me time and again that their applications are routinely handled by Indian males in HR positions; one said recently that when he applied for a programmer’s position he was connected to an Indian male who spoke no English.
To an extent unknown in other foreign worker programs, Indian labor brokers and/or Indian HR people working for American firms control the process, which results in biased hiring practices favoring young males from the right castes and from the southern, more Hindu, part of that nation; for more on this subject, see here and here.
As a result, the H-1B worker population, generally, is largely shaped by these biases, something rarely mentioned in the U.S. media.
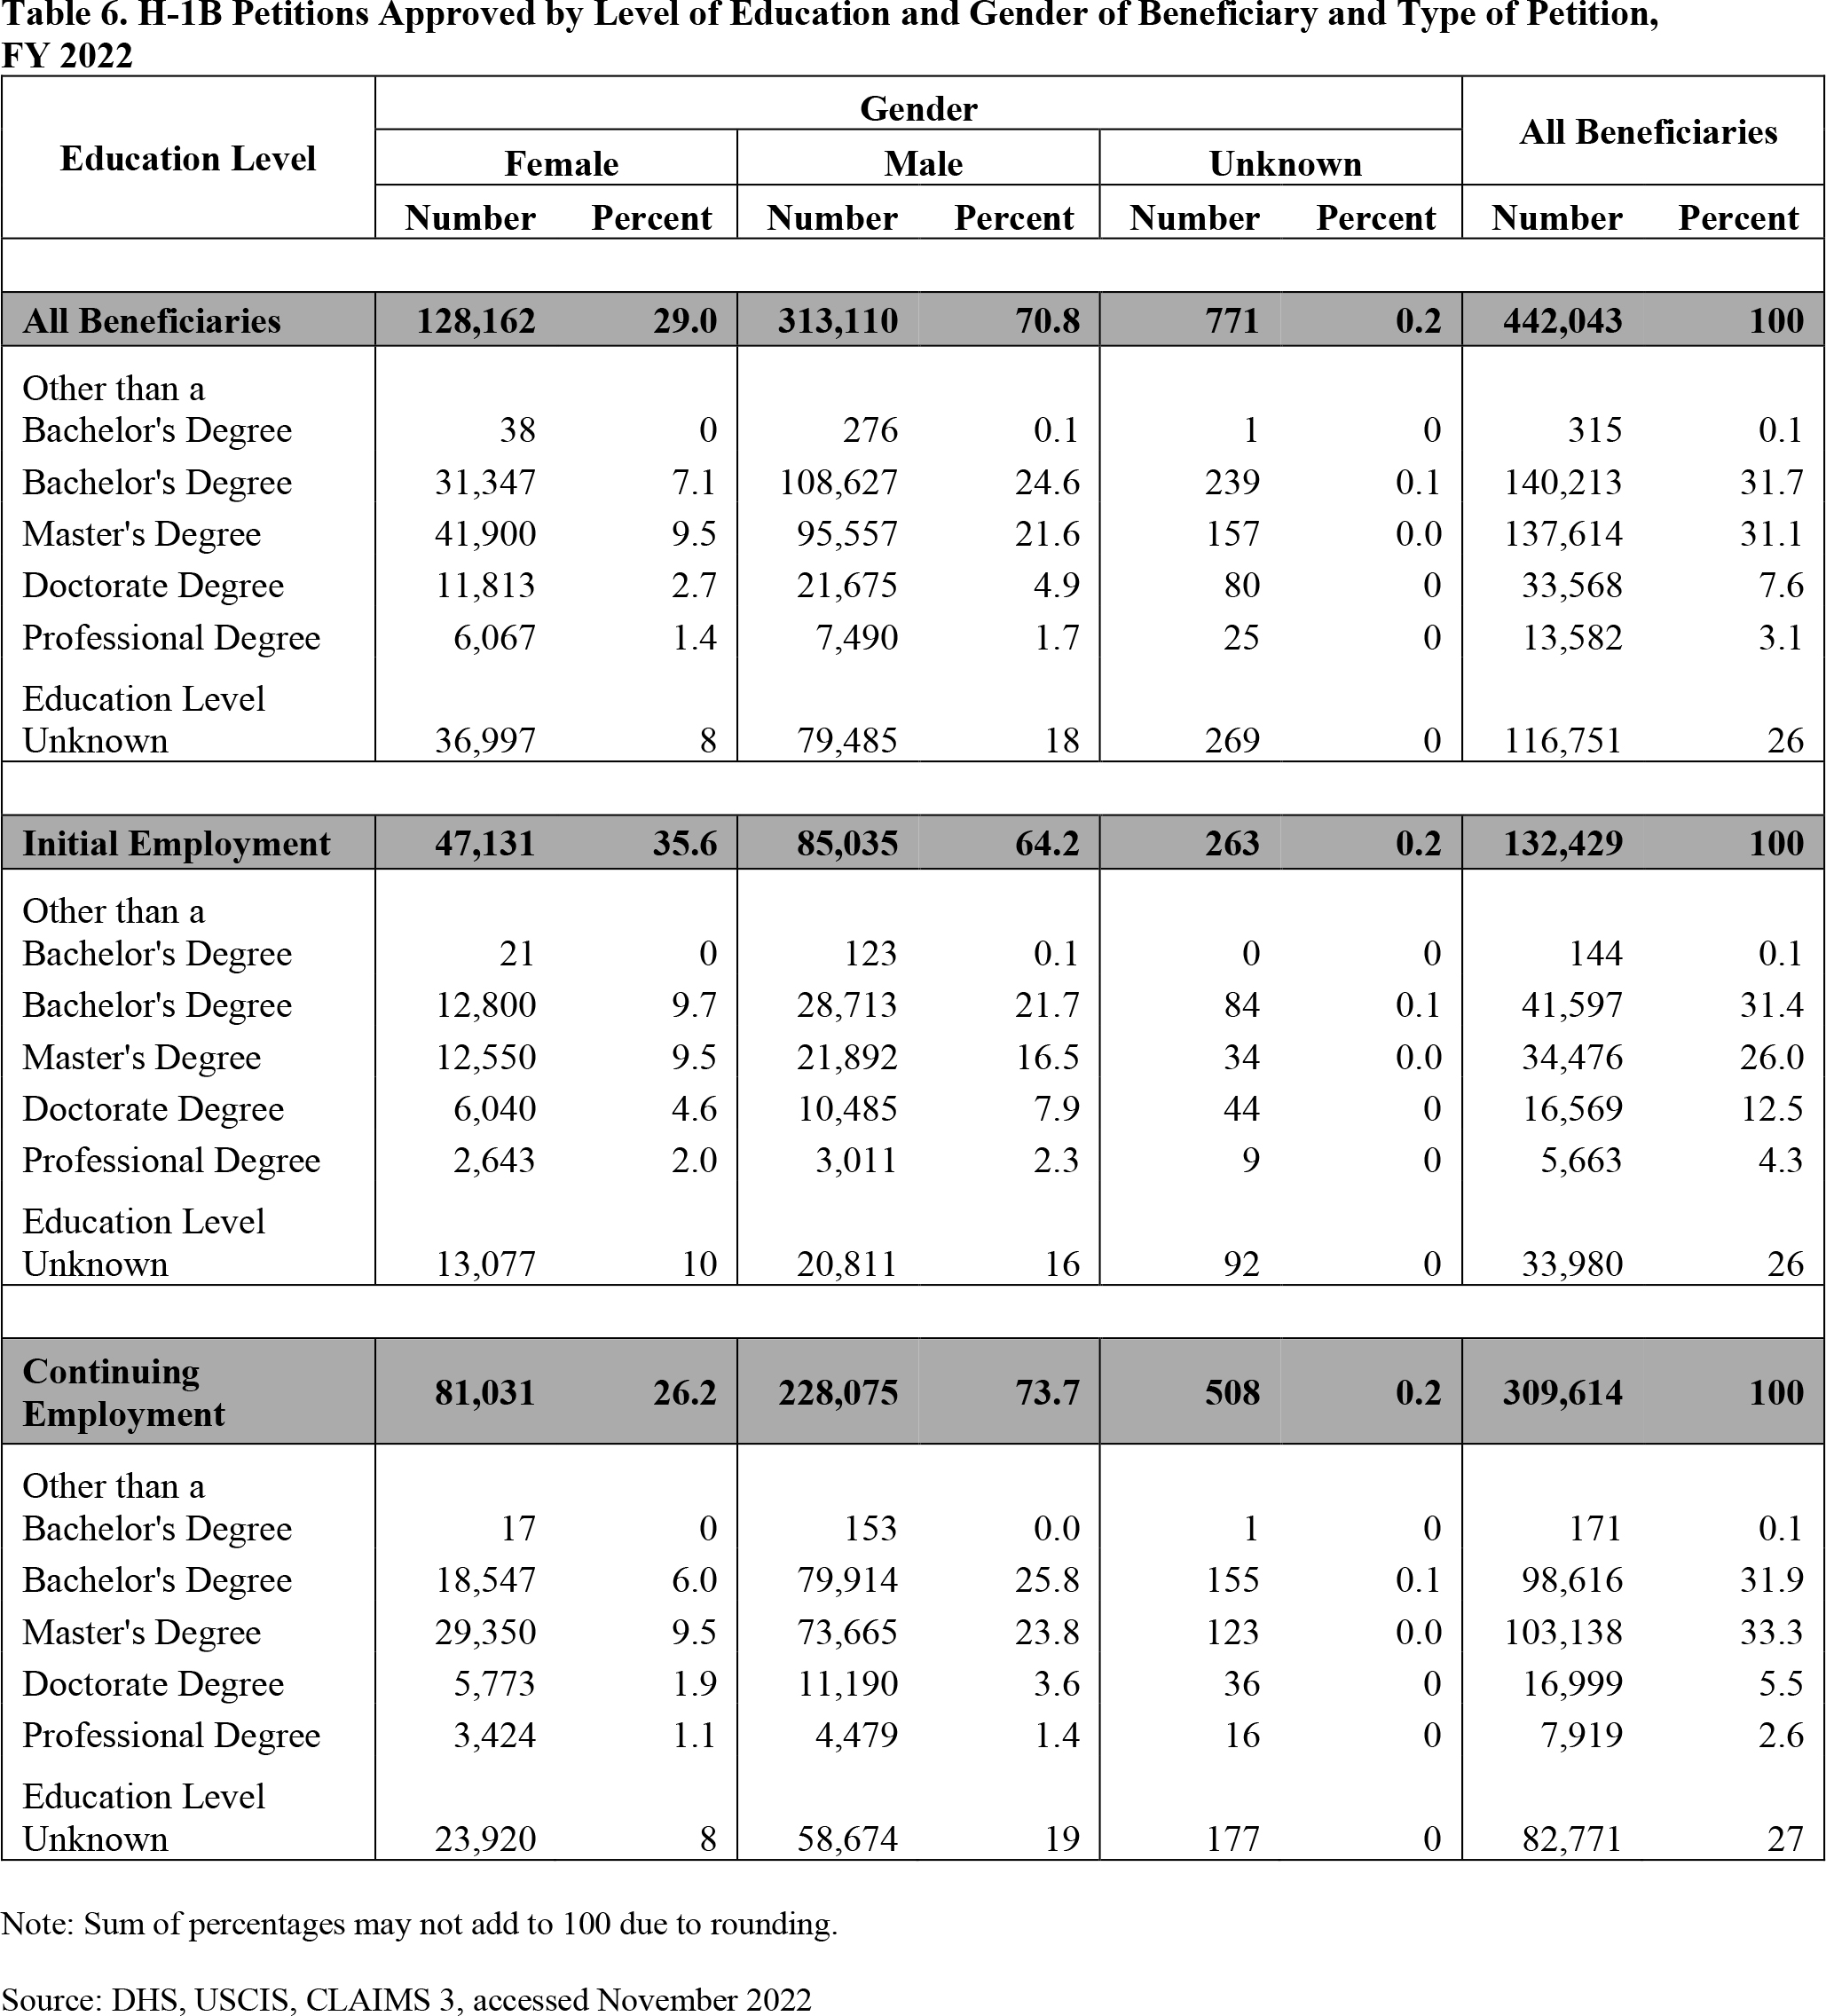
Now, while the basic numbers cited above can be found in the annual DHS report on the H-1B program, “Characteristics of H-1B Specialty Occupation Workers; Fiscal Year 2022 Report to Congress”, the previous paragraphs are not quotations from that report, they are based on painfully dredging data out of that report’s turgid text and often bewildering tables.
It is as if the Trump administration made it possible to learn the truth about the program, and then the Biden administration took great pains to hide it either deliberately or out of sheer incompetence, in a statistics-based role reversal. The reader, for example, is invited to examine the 225-cell Table 6 (from p. 47) of the annual report, just cited, which looks like it was prepared to confuse rather than to clarify.
|
One rule of statistics-bending (while being nominally truthful) is to avoid brief meaningful summaries, and to provide (as in the case of Table 6) 225 numbers and concepts; this means that the type is too small and the comparisons are too numerous to be easily comprehended.
Another rule is to give lots of information about a tiny portion of the population to further confuse; in this case there are 45 cells of useless information on the 0.2 percent whose gender is unknown. Table 6 does both of these things.
But Table 6's cardinal sin is to provide percentages on an odd and non-helpful basis; instead of noting that 58.9 percent of the newly hired women have advanced degrees, as opposed to 50.2 percent of the men, a meaningful comparison, we are told that women with advanced degrees constitute 12.2 percent of the total population (I am doing some adding here), while 26.5 percent of that population were men with these degrees; the latter is an apples-to-oranges comparison.
That 18 percent of the men’s files do not show the level of education (it is only 8 percent of the women) does not lead to much credence; if this is a program for people with advanced education, why we do not know the level of education of so many of them?
I have trouble believing that this awkward treatment was not deliberate. Statistics should be presented so that the average reader can understand them without extra digging. This is often not the case with this report.
But, thanks to Kovarik, we have the basic tools to understand the situation.