Newly examined data on the controversial EB-5 (immigrant investor) program continue to show the program's long-term decline, something we have noted in the past.
The program rewards the families of immigrant investors with a set of green cards if they invest in a DHS-approved investment, usually in high-end urban real estate projects. For 25 years, the minimal investment was $500,000; last November, that minimum moved up to $900,000.
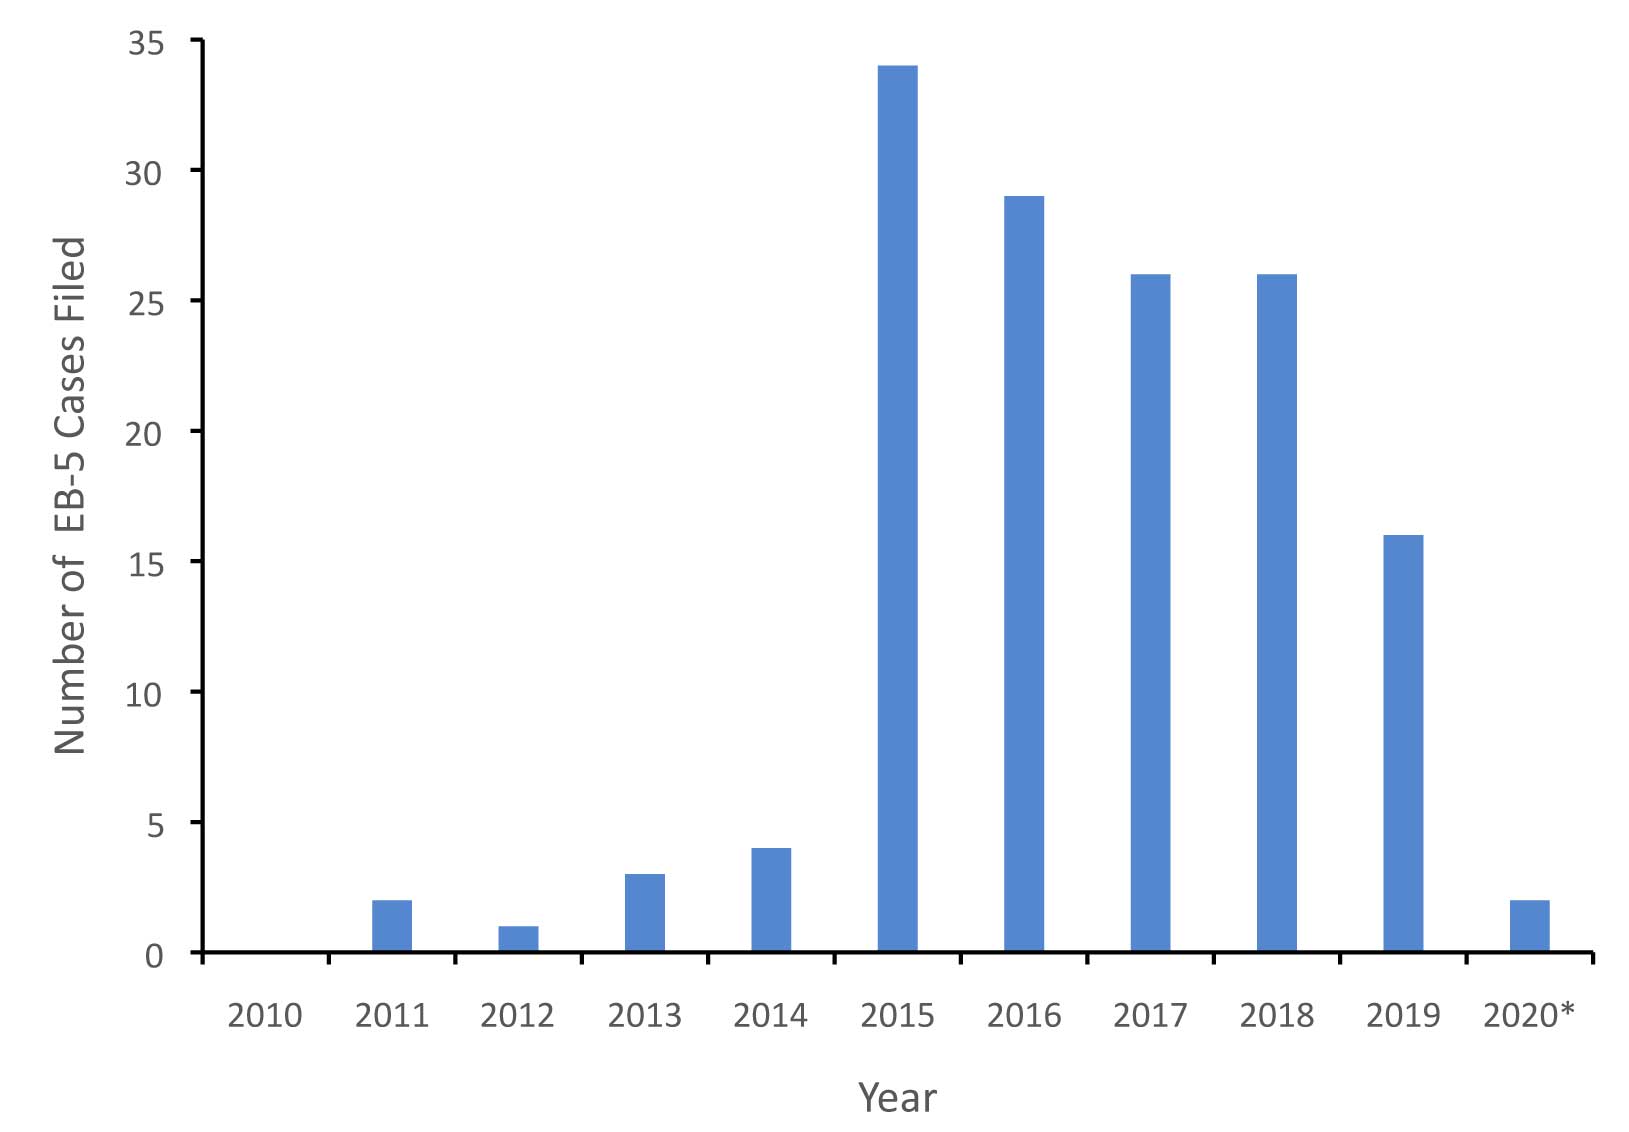
One measure of the interest in the program (or in its perceived corruption-level) is the number of lawsuits filed each year. This is based on an industry group's calculations of EB-5 litigation, which we assume is pretty comprehensive. The listing has 143 cases in it, with the number of cases a year varying from none in 2010 to a high of 34 in 2015 and back down to two for the first eight months of this year. Most of these cases stem from an alien investor's sense that he or she has been cheated by a DHS-recognized regional center or one of the latter's allies. The investors themselves are rarely sued. Sometimes the government is.
The increase, and then the decrease, in the number of filings are illustrated below:
Number of EB-5 Cases Filed, 2010–2020 |
 |
|
|
EB-5 program defenders can argue that the decline in court cases is simply an indication that the program is getting to be cleaner over time. Perhaps. One could also argue that the courts' slow motion treatment of these cases — over a period of 10 years these records show that only 39 cases were resolved, and 103 were pending — discouraged the filing of new suits. Both of these factors may well be present, as well as a general decline in interest in the program.
Meanwhile, there can be no doubt that the total number of regional centers, all operated by U.S.-resident middlemen, continues to fall. Births of new centers appear to be outnumbered by the terminations of existing ones. U.S. Citizenship and Immigration Services, helpfully, includes frequent tabulations of the number of existing regional centers, which it regulates:
|
|
|
| December 2018 | 880 |
| September 16, 2019 | 822 |
| January 15, 2020 | 792 |
| July 10, 2020 | 711 |
| September 4, 2020 | 685 |
|
|
|
The regional center net death rate averages 9.3 a month over the 21 months since December 2018. The rate of decline appears to be pretty steady.
Currently, USCIS reports that 519 regional centers have been terminated; at the current monthly net death rate of 9.3, the number of terminated centers will equal the number of active ones in about 18 months, or in about February 2022.