The combination of immigration from abroad and the resettlement of immigrants from one state to another has increased the concentration of the foreign-born in the top four states of settlement — California, New York, Florida, and Texas. High educational attainment and English fluency increased the probability that an immigrant would move between states, while those same characteristics decreased the probability that a foreign-born migrant would choose California, New York or Florida as his destination. Foreign-born migrants in general were strongly attracted to states that already had large immigrant populations from the same country, but highly educated immigrants tended to move within the United States without regard to the presence of other immigrants.
Introduction
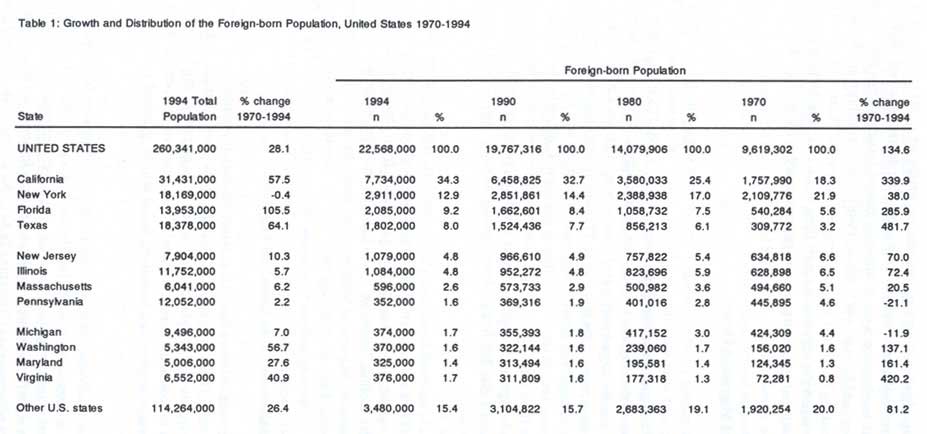
In the past 25 years, growth in the foreign-born population of the United States has been phenomenal. Between 1970 and 1994, the foreign-born population more than doubled from 9.6 million to 22.6 million. During the same period, the U.S. population as a whole increased by less than 30 percent (see Table 1). Within certain states, the growth of the foreign-born population has been even more dramatic. The foreign-born populations of California, Texas, Virginia, and Florida grew by over 250 percent. This growth exacerbated the skewed distribution of the foreign-born population across the states. In 1970, the four states with the largest immigrant populations (California, New York, New Jersey and Illinois) accounted for 53 percent of all foreign born. But by 1994, Florida and Texas had risen in rank to third and fourth, while the total share of foreign born in the top four states rose to 64 percent; those same four states accounted for only 28 percent of the native-born population.
In all states, new arrivals of immigrants are fueling the growth of the foreign-born population. For a few states though, the latest flow of immigrants does not come from abroad. Rather, many "new" immigrants come from other parts of the United States, resettling after their initial arrival. Although discussions about the impact of immigration and "new" immigrants often focus exclusively on immigration from abroad, secondary migration of foreign-born within the United States may be another factor leading to growth and increased concentration of the foreign-born population within particular states.
Since immigration from abroad has been the focus of traditional research on the foreign born, very little information has been previously available on the number or characteristics of foreign-born persons who migrate within the United States.1 This Backgrounder addresses that lack of information by providing an estimate of the volume of foreign-born internal migration, a demographic and socio-economic profile of the resettlers, and an analysis of their destination choices.
A Note About the Data
Since the foreign-born population is extremely heterogeneous, a large sample size is necessary to make meaningful comparisons across origin groups, individual characteristics, current residence and previous residence. Although it is preferable to use the most recent data available, the 1990 Census of Population and Housing is the only U.S. data collection effort in the last five years with a large enough sample size to represent adequately the diversity of the foreign-born population and to provide the detailed information needed for this study.
When the 1990 Census was conducted, approximately 20 percent of the U.S. population received a "long-form" questionnaire that requested detail about the respondents' demographic, socio-economic and housing characteristics. In addition to basic questions about the respondents' sex, age, race and place of current residence, the long-form questionnaire asked for the respondents' place of birth, educational attainment, income and place of residence in 1985. After the census was completed, an anonymous subset of the long-form responses (named the Public Use Microdata Sample or PUMS) was made available to researchers. Because persons under the age of five in 1990 weren't born as of 1985 (the reference year for the census migration question), this study is limited to the 912,277 foreign-born individuals in the PUMS that were 5 years of age and older in 1990. These sampled respondents represent a weighted U.S. foreign-born population of 19.4 million. It should be noted that the "foreign-born" do not include persons born abroad to American parents.
For the purposes of this study, any foreign-born respondent whose 1985 and 1990 residences were in different U.S. states is designated to be a "foreign-born reset tier" or "foreign-born internal migrant." Any foreign-born respondent who lived outside of the United States in 1985 is designated a "migrant from abroad." A "non-migrant" is a foreign-born respondent whose 1985 and 1990 residences were in the same U.S. state.2
In order to make this analysis more manageable, results are collapsed across categories in some instances. For example, rather than attempt to analyze migration flows of only a few foreign born, the results are reported only for states with the largest flows; flows involving the remaining states are aggregated into an "other" category. Additionally, although most variables are calculated for the entire sample and are defined in a standard manner, the operationalization of a few variables requires explanation. Four personal characteristics (level of education, marital status, personal income and labor force participation) were calculated only for those foreign born that were age 20 and older in 1990. This criteria excluded young people who may not have completed the majority of their education and who are not old enough to marry, generate significant personal income, or participate in the labor force.
For this study, education is treated as a series of categorical variables measuring degrees attained rather than years of education because the return to education is not continuous; instead, income jumps significantly with each degree attained (Hashimoto and Raisian, 1985; Weiss, 1988). The foreign born are defined as fluent if they self-reported only speaking English or speaking English very well. There is evidence that persons with the smallest language repertoire may overestimate their skills, so it was decided to define fluency as a dichotomous variable with only the most proficient persons coded as fluent (Kirsch, Jenkins, Jungeblut and Kolstad, 1993).
Size of the Foreign-born Internal Migration Flows
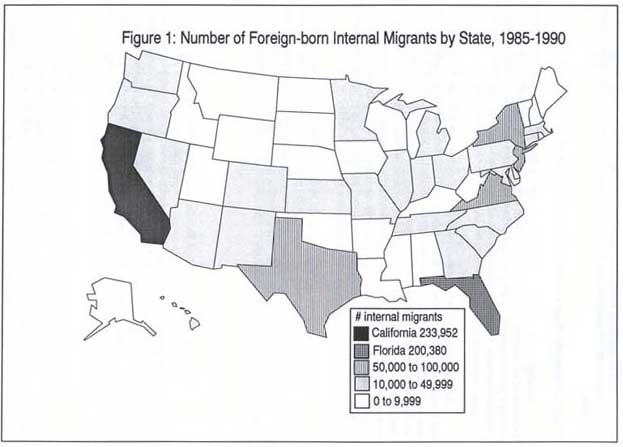
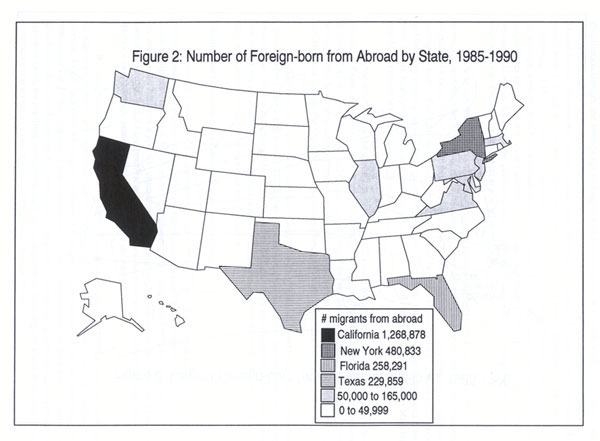
As a first step towards estimating flows of foreign born between states, the total number of 1985-1990 foreign-born migrants to each state was calculated During 1985-1990, an estimated 1,368,342 foreign born resettled from one U.S. state to another; in the same period, 3,489,423 foreign born migrated to the United States from abroad (see Figures 1 and 2). Not surprisingly, California, the state with the most foreign born in 1990, was also the largest recipient of foreign-born migrants. California was the destination for 1.5 million foreign-born persons; the majority (1.27 million) were migrants from abroad, while an estimated 233,952 were foreign-born internal migrants. New York was the destination for more than half a million foreign born, second only to California; similar to California, the majority of New York's arrivals were migrants from abroad. In contrast, Florida was the destination for almost half a million foreign born, but Florida's migrants were more evenly divided between internal migrants and migrants from abroad; Florida gained 200,380 foreign-born internal migrants and 258,291 migrants from abroad.
Almost half of the states (23) received fewer than 10,000 resettlers. Another twenty-two states received between 10,000 and 50,000 resettlers. Ten of the smaller states actually received more new immigrants in 1985-1990 due to resettlement than due to direct migration from abroad. Four of the ten states were in the Southeast (North Carolina, Tennessee, South Carolina and West Virginia), three states were in New England (New Hampshire, Maine and Vermont), and three states were in the Mountain region (Nevada, Wyoming and South Dakota). Although none of these ten states received more than 30,000 resettlers, resettlement had a large impact on these states' total foreign-born population. Over 20 percent of the 1990 foreign-born population of North Carolina, Nevada, Tennessee and South Carolina were resettlers who had lived elsewhere in the United States in 1985.
Of all the states, only nine received more than 100,000 foreign-born newcomers, i.e., resettlers and migrants from abroad combined. These nine states (California, New York, Florida, Texas, New Jersey, Illinois, Massachusetts, Virginia and Maryland) were home to 79 percent of the U.S. foreign-born population in 1990. In order to reduce the number of small flows, analysis by specific origin and destination will be limited to these nine states; all remaining states will be grouped into an "other" category.
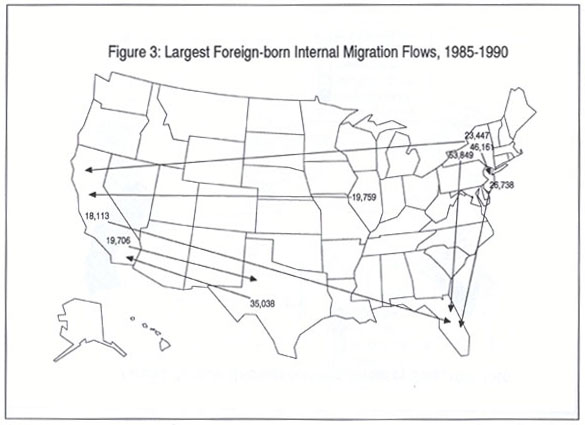
Inflows to these nine states are diverse; each state received at least 75 persons from every origin and the median flow volume ranged from a low of 1,887 for Virginia to a high of 19,338 for California. Figure 3 displays the eight largest internal migration flows by origin and destination. California and Florida each received three of the eight flows, while both Texas and New Jersey received a single flow. New York contributed large flows of resettlers to California (23,447), New Jersey (46,161) and Florida (63,849). New Jersey was the origin for the second largest (26,738) flow to Florida. California was the origin of 18,113 resettlers to Florida and the destination for almost 20 thousand foreign-born resettlers from Illinois and 35,038 resettlers from Texas. On the other hand, Texas received 19,706 resettlers from California.
Which States Are the Biggest Gainers or Losers of Resettlers?
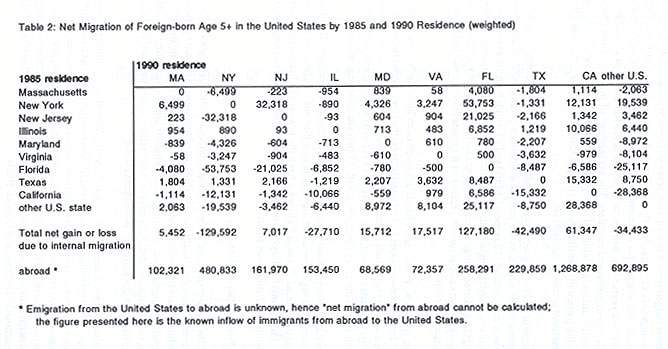
Looking only at inflows to a state does not give a complete picture of the migration streams. Estimates of net migration, i.e., volume of the migration flow adjusted for outflows as well as inflows, provide a better measure of a state's true gain or loss. Regrettably, net migration cannot be adjusted for outflows from states to abroad because the United States lacks emigration data. Instead, the net migration figures presented in Table 2 show only the known gain or loss between states.
After adjusting for 1985-1990 outflows to other states, six states still posted a positive increase due to foreign-born resettlement. The gains ranged from fewer than ten thousand (5,452 for Massachusetts and 7,017 for New Jersey) to more than 127,000 for Florida; Maryland (15,712), Virginia (17,517) and California (61,347) were the other three states with gains. On the other hand, New York, Illinois, Texas and "other" parts of the United States all experienced net losses after their inflows of resettlers were adjusted for outflows. With a loss of almost 130,000, New York had the largest net loss of any state due to secondary migration of the foreign born. Second to New York, Texas had a net loss of over 42,000 resettlers. The third biggest loss of net resettlers was from the "other" agglomeration of states (-34,433). Illinois was the only other state to experience a net loss (-27,710).
Florida is the only one of the nine states to have all positive net exchanges. Florida's single largest net gain was from New York. In fact, the 53,753 net foreign-born internal migrants the resettled from New York to Florida comprised the largest net exchange between any origin-destination pair. California followed Florida as the second largest recipient of net migrants mainly due to positive exchanges with seven of the states. California's largest gains were from Texas (15,332) and other parts of the United States (28,368).
Characteristics of the Resettlers
Along with an estimate of the flow volume, a demographic and socio-economic profile of the migrants is an important indicator of the potential impact that a flow has on a destination. A basic description of migration flows in terms of demographic characteristics, economic status and human capital level is needed before the affect of a migration flow can be assessed. For example, flows consisting mainly of working age, well-educated migrants may insert vitality and skills into a local economy. On the other hand, the costs and benefits of flows with large numbers of the very young, the elderly, or less educated migrants may need to be carefully scrutinized; those groups are often ineligible to participate in the labor market or may face stiff competition for employment (Borjas, 1990).
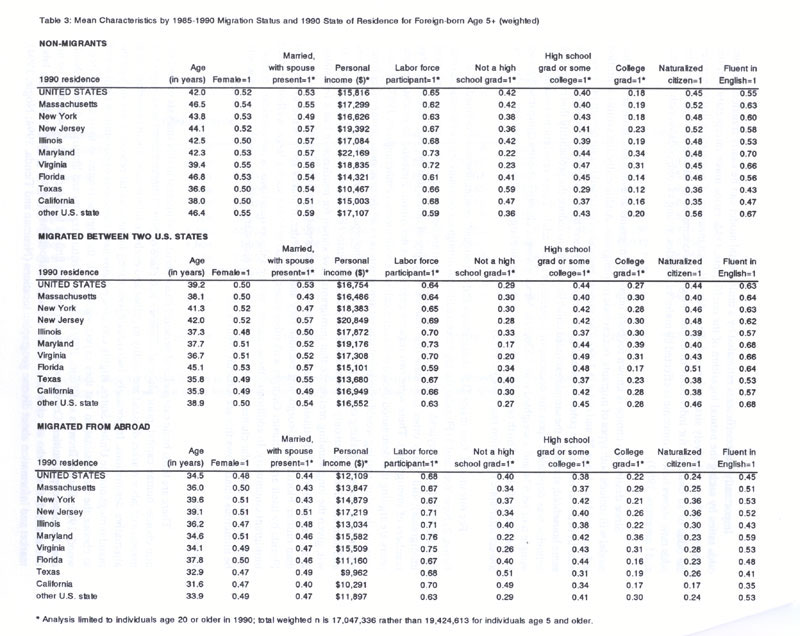
Personal characteristics varied across foreign-born migration flows. Mean characteristics are presented in Table 3. Migrants and non-migrants were almost evenly distributed by gender. Of all U .S. foreign-born non-migrants, 52 percent were female, while 50 percent of resettlers and 48 percent of migrants from abroad were female. Gender distribution across the states was very similar to the national average; no state deviated from the U.S. average by more than 3 percentage points. Unlike the gender distribution though, the average age of migrants and non-migrants was considerably different by state.
The average age of non-migrants ranged from a low of 36.6 years in Texas to a high of 46.5 years in Massachusetts; the national average was 42 years. Resettlers to Texas (35.8 years) and California (35.9 years) were younger than the national average for resettlers (39.2 years). Resettlers to Florida had an average age of 45.1 years, almost six years older than the national average. Migrants from abroad were, on average, younger than both non-migrants and resettlers. The average age of migrants from abroad ranged from a low of31.6 years in California to a high of39.6 years in New York. Although the average age differed across the states, the pattern of resettlers being younger than non-migrants but older than migrants from abroad was consistent across all the states.
As with age, the education of level of migrants and non-migrants varied significantly by state. On average, resettlers have a higher level of education (27 percent are college graduates) than either non-migrants (18 percent) or migrants from abroad (22 percent). Maryland's foreign born far exceeded the average in terms of educational attainment though. With 39 percent being college graduates, resettlers to Maryland were the most highly educated group. The second and third most highly educated groups were also in Maryland; college graduates comprised 36 percent of migrants from abroad to Maryland and 34 percent of Maryland's non-migrants.
At the other end of the spectrum, Texas's and Florida's foreign born have the lowest levels of education. Only 12 percent of Texas's non-migrants had college degrees, the lowest level for any group or state. Florida's non-migrants and migrants from abroad had the second and third lowest educational levels, 14 and 16 percent college graduates respectively. Resettlers to Florida and migrants from abroad to California tied for the fourth worst educated groups, each with 17 percent college graduates.
English fluency and personal income closely followed the trends found in education. Resettlers report greater English proficiency and higher personal incomes than either non-migrants or migrants from abroad. Within each migration status, Texas or California have the lowest English fluency levels and lowest personal incomes. Immigrants in Maryland or New Jersey reported the highest English fluency and personal incomes within each migration status.
Destination Choice for the Foreign Born: Methodology
Although a profile of the demographic and socio-economic characteristics of migrants is very useful, a descriptive profile cannot depict the simultaneous influences of numerous personal characteristics on migration behavior. Multivariate regression models of migration behavior allow one to focus on the association between a specific characteristic and migration behavior while controlling for other identified factors. In this case, multivariate models help answer the question: which personal characteristics are most strongly associated with the particular destination choice?
Because potential destinations are discrete, exclusive and unordered entities, multinomial logistic regression methods are appropriate for estimating the model of destination choice (Kennedy, 1992; Greene, 1990). Ordinary least square regression is inappropriate because of the unordered nature of destinations and binary logistic or probit regressions are also inappropriate because there are numerous destination choices. Multinomial regression estimates sets of equations equal to the number of categories minus one; the resulting coefficients show the probability of choosing one alternative relative to an alternative that serves as a benchmark (Hoffman and Duncan 1988).
Importantly, the coefficients estimated by a multinomial model can be easily transformed into odds ratios by taking the natural logarithm of the coefficients. Odds ratios make interpretation of the variables' effects relatively straightforward. The odds ratio is a measure of association that compares the odds of an outcome for individuals from one category as compared to another category; i.e., the odds ratio shows how an outcome is effected by males vs. females, young vs. old, poor vs. rich (Hosmer and Lemeshow 1989).
Since destination choice is known for both inter-state migrants and migrants from abroad, this model will include both types of migrants, but exclude non-migrants. Additionally, the sample is limited to household heads age 20 and older in 1990. The sample had to be restricted to one person per household in order to reduce the potential interdependence of migration behavior between members of the same household; similarly, the sample excluded children in order to reduce the probability that migration behavior was dependent upon the decision of a parent or other adult. These restrictions resulted in a sample n of 68,674 and a weighted n of 1,520,016. Mexicans were chosen to be the comparison group for the effect of place of birth on destination because they are the largest origin group and they have the lowest inter-state migration rate (Nogle, 1995).
For this model, four major U.S. destinations and a "residual" destination were defined: 1) California, 2) New York and 3) Florida (the top three traditional immigrant destinations); 4) Massachusetts, New Jersey, Illinois, Maryland, Virginia or Texas (all states that are beginning to attract large numbers of immigrants); and 5) any other U.S. state (the residual category of states that are not attracting large numbers of immigrants). There were two reasons guiding this definition. First and foremost, geographers are arguing that destination choice is hierarchical, not simultaneous (Fotheringham, 1987). Simultaneous decision-making would give equal weight and attention to all destinations. On the other hand, hierarchical decision-making clusters potential destinations into groups based on weighted preferences and then attention is given only to the members of preferred cluster (Fik, Amey and Mulligan, 1992). To wit, given the long-standing preference that immigrants have shown for residence in just a few states, this analysis clustered destinations based on the foreign-born population in each of the states. Rather than cluster Florida and Georgia just because they share a border, it makes more sense to consider Florida by itself and to cluster Georgia with other states that do not have such a large, well-articulated immigrant community. In addition to these clusters having a theoretical basis in hierarchical decision-making, these particular clusters are also methodologically necessary. Without clustering, there would be numerous small flows that are difficult to analyze.
Hypotheses
There are three basic categories of personal characteristics of interest to this analysis of destination choice: human capital, prior place of residence and place of birth. Human capital is an important measure of labor market demand and ability to gather and evaluate information about opportunities at alternative destinations. Importantly, individuals with strong human capital resources are in high demand throughout the United States. Highly educated persons have numerous opportunities from which to choose the one destination that they expect will provide the highest returns to their skills (Greenwood, 1985; Borjas, Bronars and Trejo, 1992). Similarly, naturalization and language fluency should also increase opportunities. Compared to immigrants with limited language skills or who may be undocumented, those who are citizens or fluent in English should have better access to the U.S. labor market and information about diverse geographic locations (Neuman and Tienda, 1994; Nogle, 1994).
On the other hand, persons with limited human capital resources may have fewer choices about destinations. Without the human capital resources that underwrite economic success, immigrants with low human capital skills are expected to choose destinations with strong ethnic communities. Within ethnic communities, friends or relatives often help new migrants with assistance finding employment, child care, temporary housing or small loans (Caces, 1986; Portes and Bach, 1985). When choosing a destination, the presence of compatriots and their potential for assistance can be a strong attraction for poorly skilled immigrants (Dunlevy, 1991; Saenz, 1991). It is expected that foreign born with lower human capital will choose traditional "immigrant" states (such as California, New York or Florida) that have large, established ethnic communities as their destination. High levels of human capital are expected to increase the likelihood of an immigrant choosing a destination in some other part of the United States. Highly skilled immigrants are not necessarily as reliant on ethnic communities for support and, hence, can choose a "frontier" destination if they perceive that location to have the highest rewards.
Prior place of residence is the second major class of variables added to the model of destination choice. Examination of prior residence controls for the variation in preferences between persons who have been in the United States for more than five years (i.e., the resettlers) and persons who have arrived in the United States in the five years prior to the census (i.e., the migrants from abroad) (Kritz and Nogle, 1994a). An international move is a major undertaking. Migrants from abroad may be more likely than resettlers to need the assistance of ethnic communities upon arrival. For example, new migrants from abroad may face daunting language barriers and bureaucratic obstacles (enrolling children in schools or getting a driver's license) for the first time. With at least five years experience in the United States, resettlers have already dealt with those complicated issues; even if resettlers still have difficulties with language or other barriers, they are probably less in need of ethnic assistance than they were when they initially arrived. It is expected that migrants from abroad will be more likely than resettlers to choose traditional immigration states as their destinations.
Place of birth is an important indicator of the effect of ethnicity, regardless of human capital or U.S. experience, on destination choice. For example, White, Biddlecom and Guo (1993) argue that belonging to a particular group may overshadow the effect of personal characteristics; in their research, they found that even after controlling for personal traits, being Chinese, Japanese or Filipino increased the likelihood that the respondent lived in a highly concentrated ethnic community. Some groups, such as Greeks and Koreans, have high levels of self-employment and are very entrepreneurial; this entrepreneurial spirit may lead members of those groups from traditional areas of immigrant settlement to other parts of the United States (Kritz and Nogle, 1994a). Cubans have developed a particularly strong residential and economic enclave in the Miami, Florida metropolitan area (Portes and Jensen, 1989; Massey and Denton, 1989). Since most Cubans entered the United States as refugees rather than economic migrants, many still maintain a strong interest in the politics and economics of their homeland. The close-knit Cuban community in Miami, Florida may be a very attractive destination for Cubans because it emphasizes Cuban issues and it is less than 100 miles from Cuba. Settling in Miami allows Cuban immigrants to be as close as possible to their place of birth. Similarly, it is expected that Mexican immigrants will prefer to settle in Texas or California. Both of those states were at one time part of Mexico and their cultures include elements reflecting the Spanish/Mexican historical influence (Vazquez and Meyer, 1985). In sum, it is expected that groups with strong historical trends of settlement to a particular destination or reasons for entry that create a strong network will most likely choose traditional areas of immigrant settlement. Members of other groups will be less affected by their ethnicity and will be more likely to choose destinations in other parts of the United States.
Controls for demographic characteristics (age, gender and marital status) and economic status (income and labor force participation) are also added to the model (Bartel, 1989; Greenwood, 1985).
Findings
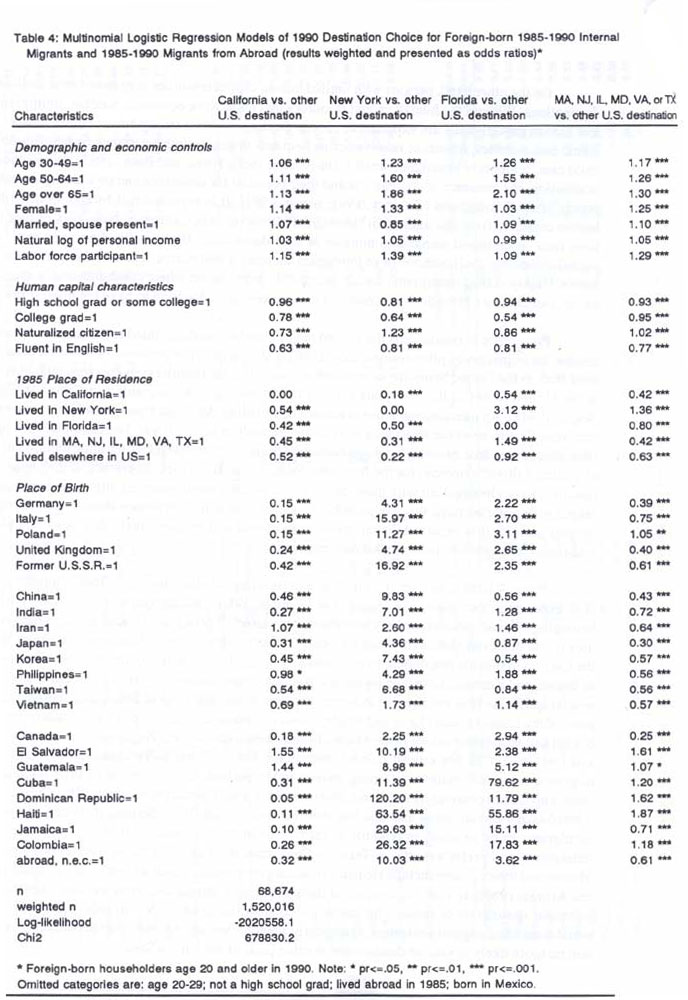
Results of the destination choice model are presented in Table 4. There is strong support for the hypothesis that the foreign born with the most human capital resources are less likely to choose traditional immigration states (i.e., California, New York or Florida). Compared to persons who did not graduate from high school, high school graduates are 4-19% less likely to choose the traditional destinations. The effect of college graduation on destination choice is much more dramatic. Compared to persons who didn't graduate from high school, college graduates are 22% less likely to choose California, 36% less likely to choose New York and 46% less likely to choose Florida. The likelihood of choosing any state in the fourth destination set (Massachusetts, New Jersey, etc.) is only slightly lower for better educated immigrants than for non-high school graduates.
English fluency follows the same pattern as education. Immigrants who are fluent in English are less likely than those who are not fluent to choose the traditional immigrant destinations. For example, immigrants who are fluent are 37% less likely to choose California, 19% less likely to choose New York, 19% less likely to choose Florida, and 23% less likely to choose any state in the fourth destination. The pattern for citizenship is not as clear-cut as that for education and fluency. Being a naturalized citizen reduces the likelihood that the immigrant will choose California by 27% and Florida by 14%. In the opposite direction though, naturalization increases the likelihood of choosing New York by 23% or any state in the fourth destination by 2%.
In general, resettlers were much less likely than immigrants moving from abroad to choose traditional immigration states as their destinations. Resettlers from any part of the United States were about half as likely as migrants from abroad to choose California; for example, resettlers from New York and Florida were 46% and 58%, respectively, less likely than migrants from abroad to choose California. Compared to migrants from abroad, resettlers showed even less preference for New York than they did for California. Notably, resettlers from California were 82% less likely than migrants from abroad to choose New York.
It is not surprising that Florida is the only one of the traditional states that is more popular with some resettlers than migrants from abroad. For decades, sunny Florida has been a mecca for all kinds of migrants, especially retirees. In this case, resettlers from New York were 212% more likely than migrants from abroad to choose Florida as their destination. Resettlers from the smaller immigration states (Massachusetts, New Jersey, etc.) were 49% more likely than migrants from abroad to choose Florida.
When comparing the effects of place of birth on destination choice, the attractiveness of large ethnic concentrations is very apparent. Migrants were most likely to choose a state that was already known to contain large concentrations of persons from the same place of birth. For example, only Iranians, Salvadorans and Guatemalans are more likely than Mexicans to choose California as a destination; California is known to have large populations from all four of these origins. Six groups (Germans, Italians, Poles, Dominicans, Haitians and Jamaicans) were at least 85 percent less likely than Mexicans to choose California as a destination.
New York, which does not have a large Mexican population, was a more popular destination for every single group compared to Mexicans. The attraction of Dominicans to New York is very strong; Dominicans were 120 times more likely than Mexicans to choose New York as their destination. Haitians were also very likely to choose New York, over 60 times more likely than Mexicans. Two other Western Hemisphere groups, Jamaicans and Colombians, were at least 25 times more likely than Mexicans to choose New York over alternative destinations.
Florida was also popular with many of the groups compared to Mexicans. All the European and Latin American groups were at least 100 percent more likely to choose Florida than Mexicans. The Asian groups were split in their preference for Florida. Four of the Asian groups (Chinese, Japanese, Koreans and Taiwanese) were slightly less likely than Mexicans to choose Florida, while the other four groups (Indians, Iranians, Filipinos and Vietnamese) were slightly more likely. Cubans and Haitians showed the strongest preference for Florida; they were 78 and 54 times, respectively, more likely than Mexicans to choose Florida as a destination.
Policy Implications
Although the volume of 1985-1990 foreign-born internal migration flows is smaller than flows from abroad (1.3 million versus 3.4 million), resettlement of the foreign born still has significant impacts on the destination states. "New" foreign-born resettlers outnumbered migrants from abroad in ten states (North Carolina, Tennessee, South Carolina, West Virginia, New Hampshire, Maine, Vermont, Nevada, Wyoming and South Dakota). Resettlement has also contributed to the increasing concentration of the foreign-born in California and Florida. Florida gained over 125,000 net internal migrants and California gained about 61,000 due to secondary migration. Even though they gained migrants directly from abroad, New York (-130,000), Texas (-42,000) and "other" parts of the United States (-34,433) were big losers of net resettlers.
Perhaps even more important than the sheer number of foreign-born internal migrants is the composition of the flows. Compared to non-migrants, resettlers are younger, better educated, more fluent in English and have higher incomes; resettlers are also more highly skilled than migrants from abroad. On average, the foreign-born resettlers have a positive impact on the skill-level of recipient state's immigrant population. For example, the educational level of resettlers to California (28 percent are college graduates) partly offsets the low educational level of California's non-migrants and migrants from abroad (16 percent and 17 percent college graduates, respectively). Similarly, 39 percent of resettlers to Maryland are college graduates; although Maryland's immigrant population is already highly educated, the resettlers augmented the skills and qualifications of that state's foreign born. Notably, the traditional immigration states do not exert an attraction on highly skilled immigrants; highly skilled immigrants choose where they want to live based more on where their skills will be most rewarded and less on the need for ethnic support structures.
The effect of internal migration of the foreign born has distinct policy implications. States that receive large numbers of foreign-born resettlers, especially California and Florida, need to plan for continued inflows of resettlers. Although immigration planning is usually focused on populations external to the United States, states also need to consider the potential impact that immigrants living in other areas of the United States could have if some of they decided to relocate. Even if all immigration could be stopped today, resettlement would continue to affect both the number and composition of each state's foreign-born population well into the future.
Since resettlers are, on average, younger than non-migrants, today's resettlers will be in the labor force for many years to come. Additionally, the young resettlers will be creating and/or expanding their families in the years to come. Although resettlers often have a positive impact on the skill level of the immigrant labor force, their children will increase the number of young people dependent upon the economically active population for support. Projected plans for family and children's services, construction of new schools, development of housing and workforce training programs may need to accommodate many new foreign-born clients. Services and programs for immigrants will need to expand in those places where resettlers are relocating. Even though a majority of resettlers report fluency in English, many resettlers still do not have strong English skills. Provision of additional language-training programs or multi-lingual services may be needed in many places.
Population projections used for planning may need to consider the impact of resettlement on the state's foreign-born population. Growth of the immigrant population in a state is not limited to migration from abroad. Assuming that migration from abroad is the only source of growth for the foreign-born population may result in large differences between the projected population and the actual population at some future date. Importantly, states that are losing foreign-born resettlers, mainly New York, Texas and Illinois, shouldn't project the loss to result in a direct decrease in requests for social services, etc. Resettlers are among the most highly skilled foreign born. Losing them will not reduce the requests for services by the most needy.
The probability is slim that immigrant resettlement will abate in the near future. In addition, chain migration of family and friends, rejoining earlier migrants, could cause resettlement to become a tidal wave. If resettlement patterns continue into the future, the immigrant population is expected to become more concentrated in a few of the largest states. In some of the smaller states, resettlers may become the major source of "new" immigrants. In the next century, the resettlement of immigrants may have as large an impact on many states as immigration directly from abroad.
End Notes
1 For related research, please see Greenwood and Ragland (1991), Frey (1994), Saenz (1991), and Kritz and Nogle (1994a; 1994b).
2 State boundaries, rather than county boundaries, were chosen to demarcate migration to insure that "migrations" were major changes in place of residence (White and Mueser, 1988). For example, while many moves within a single Metropolitan Statistical Area cross-country boundaries, the movers need not experience disruptions in place or work, shopping patterns, or circle of friends. Moves within an MSA that cross a country boundary are more similar to the concept of local mobility than to migration (Bartel and Koch, 1991; Kritz and Nogle, 1994b). Since the foreign-born population is so highly concentrated in metropolitan areas (94% compared to 76% of natives in 1990), the necessity for using state boundaries is particularly strong in this case (1990 Census, CP-2-1, Table 27).
Sources for Figures and Tables
Table 1: Census Bureau Press Release CB94-204; Current Population Survey report P20-486 and associated tables 1 and 3 from the Census Bureau Home Page; 1990 Census report CPH-L-98 tables 1 and 9; 1980 Census General Social and Economic Characteristics, U.S. summary, table 236; 1970 Census U.S. Summary PC(1)-A1, table 8.
Figures 1-3, Tables 2-4: Special tabulation of the 1990 Census 5% Public Use Microdata Sample
References
Bartel, A. P. (1989). Where Do the New US Immigrants Live? Journal of Labor Economics, 7(4), 371-391.
Bartel, A. P., & Koch, M. J. (1991). Internal Migration of US Immigrants. (eds) J. M. Abowd, & R. B. Freeman, Immigration, Trade, and the Labor Market, (pp. 121-134). Chicago: The University of Chicago Press.
Borjas, G. J. (1990). Friends or Strangers: The Impact of Immigrants on the U.S. Economy. New York: Basic Books.
Borjas, G. J., Bronars, S. G., & Trejo, S. J. (1992). Self-Selection and Internal Migration in the United States. Journal of Urban Economics, 32(2),159-185.
Caces, F. (1986). Immigrant Recruitment into the Labor Force: Social Networks Among Filipinos in Hawaii. Amerasia, 13(1), 23-38.
Dunlevy, J. A. (1991). On the Settlement Patterns of Recent Caribbean and Latin Immigrants to the United States. Growth and Change, 22(1),54-67.
Fik, T. J., Amey, R. G., & Mulligan, G. F. (1992). Labor Migration amongst Hierarchically Competing and Intervening Origins and Destinations. Environment and Planning A, 24(9), 1271-1290.
Fotheringham, A. S. (1987). Hierarchical Destination Choice: Discussion with Evidence from Migration in the Netherlands, Working Papers of the NIDI. The Hague, Netherlands: Netherlands Interuniversity Demographic Institute.
Frey, W. (1994). The New White Flight. American Demographics, 16(4),40-48.
Greene, W. H. (1990). Econometric Analysis. New York: Macmillan Publishing Company.
Greenwood, M. J. (1985). Human Migration: Theory, Models, and Empirical Studies. Journal of Regional Science, 25(4),521-544.
Greenwood, M. J ., & Ragland, S. E. (1991 ). Measuring the Net Migration of Immigrants to US Metropolitan Areas. Journal of Economic and Social Measurement, 17(3-4),233-248.
Hashimoto, M., & Raisian, J. ( 1985). Employment Tenure and Earnings Profiles in Japan and the United States. American Economic Review, 75(Sept), 721- 735.
Hoffman, S. D., & Duncan, G. J. (1988). Multinomial and Conditional Logit Discrete-Choise Models in Demography. Demography, 25(3),415-427.
Hosmer, D. D., & Lemeshow, S. (1989). Applied Logistic Regression. New York: John Wiley & Sons.
Kennedy, P. (1992). A Guide to Econometrics. Cambridge: MIT Press.
Kirsch, I. S., Jenkins, L., Jungeblut, A, & Kolstad, A. (1993). Adult Literacy in America: A First Look at the Results of the National Adult Literacy Survey. Washington, DC: Educational Testing Service.
Kritz, M. M., & Nogle, J. M. (1994a). Nativity Concentration and Internal Migration among the Foreign-Born. Demography, 31(3),509-524.
Kritz, M. M., & Nogle, J. M. (1994b). Internal Migration Among the Foreign-Born: Human versus Social Capital. A paper presented at the Population Association of America Meetings.
Massey, D. S., & Denton, N. A. (1989). Residential Segregation of Mexicans, Puerto Ricans, and Cubans in Selected US Metropolitan Areas. Sociology and Social Research, 73(2), 73-83.
Neuman, K. E., & Tienda, M. (1994). The Settlement and Secondary Migration Patterns of Legalized Immigrants: Insight from Administrative Records. B. Edmonston, & J. Passel, Immigration and Ethnicity: The Integration of America's Newest Immigrants, (pp. 187-226). Lanham, MD: Urban Institute Press.
Nogle, J. M. (1994). Internal Migration for Recent Immigrants to Canada. International Migration Review, 28(1),31-48.
Nogle, J. M. (1995). Internal Migration Patterns of the Foreign-born, 1985-1990: A Factor in the Increasing Geographic Concentration of the Foreign-born, A Technical Report to the Immigration and Naturalization Service. Gainesville, FL: University of Florida.
Portes, A., & Bach, R. L. (1985). Latin Journey: Cuban and Mexican Immigrants in the United States. Los Angeles: University of California Press.
Portes, A, & Jensen, L. (1989). The Enclave and the Entrants: Patterns of Ethnic Enterprise in Miami before and after Mariel. American Sociological Review, 54(6),929-949.
Saenz, R. (1991). Interregional Migration Patterns of Chicanos: The Core, Periphery, and Frontier. Social Science Quarterly, 72(1),135-148.
Vazquez, J., & Meyer, L. (1985). The United States and Mexico. Chicago: University of Chicago Press.
Weiss, A. (1988). High School Graduation, Performance, and Wages. Journal of Political Economy, 96( 4), 785-820.
White, M. J., & Mueser, P. R. (1988). Implications of Boundary Choice for the Measurement of Residential Mobility. Demography, 25(3),443-459.
White, M. J., Biddlecom, A. E., & Guo, S. (1993). Immigration, Naturalization, and Residential Assimilation among Asian Americans in 1980. Social Forces, 72(1),93-117.
June Marie Nogle is a research demographer at the University of Florida's Bureau of Economic and Business Research.