Jason Richwine, PhD, is an independent public policy analyst based in Washington, D.C., and a contributing writer at National Review.
Panel Media
Panel Announcement: Immigration and Less-Educated American Workers
Panel Video: Immigration and Less-Educated American Workers
Panel Transcript: Immigration and Less-Educated American Workers

It is well known that lower-skilled men in their prime working years — ages 25 to 54 — have left the labor force in increasing numbers over the past several decades. Experts have been reluctant to acknowledge, however, that the work problem has afflicted native-born men almost exclusively. Harnessing both labor-force participation rates and total hours worked per year, this study presents evidence that immigrants are replacing low-skill native-born men in the workforce. All of the following results refer to prime-age men who are not incarcerated:
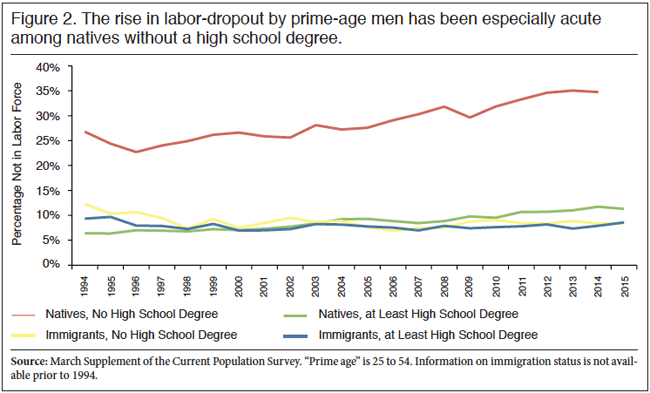
- Among natives without a high school degree, the fraction who were neither working nor looking for work rose from 26 percent in 1994 to 35 percent in 2015. Over the same period, the fraction of their immigrant counterparts who were out of the labor force actually declined from 12 percent to 8 percent.
- Turning to hours spent working, native-born high school dropouts worked an average of 1,391 hours (the equivalent of about 35 full-time weeks) per year between 2003 and 2015, while immigrant dropouts worked 1,955 hours (or 49 full-time weeks) per year.
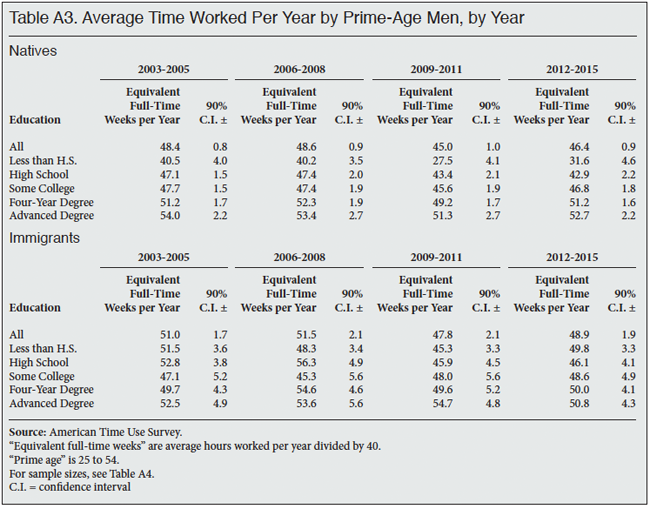
- Native-born dropouts have seen their work time decline from 41 equivalent full-time weeks in the 2003-2005 period to 32 weeks in 2012-2015, while immigrant dropouts declined only from 52 weeks to 50 weeks.
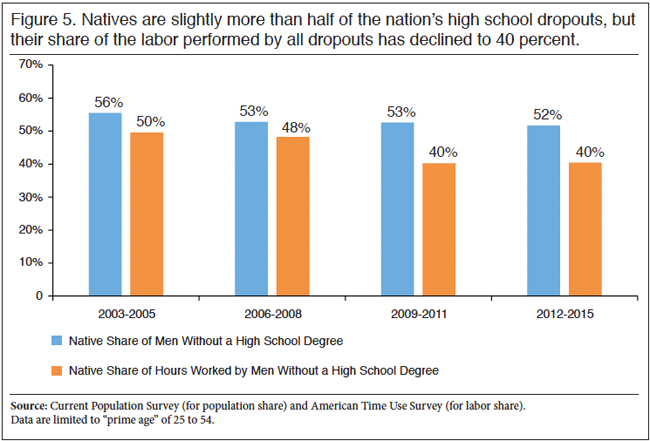
- While natives fell from 56 percent of the nation's high school dropouts to 52 percent, their share of the labor performed by all dropouts declined much faster — from 50 percent in the 2003-2005 period to 40 percent in 2012-2015.
- Among men with more than a high school degree, there are no significant differences in work time between immigrants and natives.
In summary, the United States has been a magnet for low-skill immigration even as low-skill natives have worked less and less. This does not necessarily imply that immigrants push out natives from the workforce, but it does mean that immigrants replace natives, causing economic and social distress in the communities most affected. As natives leave the workforce — whether because of competition from immigrants, insufficient wages, overreliance on welfare, distaste for manual labor, or some other reason — employers turn increasingly to immigrants.
Regardless of the extent to which immigration has caused the decline of work in lower-class American communities, immigration functions as a band-aid over the problem. Instead of searching for ways to get natives back to work — through higher wages, less access to welfare, or social pressure — government and business leaders have brought in immigrants to do the work instead. Limiting immigration would not solve all the problems facing low-skill natives, but it would provide the incentive to get them back to work and back into the mainstream of society.
Introduction
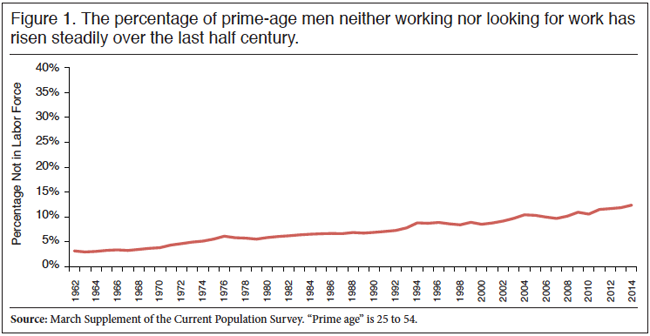
The steady decline in work among able-bodied men is one of the most important social problems facing the United States. Even men in their prime working years — ages 25 to 54 — are much less likely to be in the labor force today compared to 50 years ago. To illustrate, Figure 1 shows that the percentage of prime-age men who are "out of the labor force" — neither working nor looking for work — was just 3 percent in the 1960s. Years of slow but steady labor-force dropout have quadrupled the figure to 12 percent today. These numbers refer to the non-institutional population, meaning the decline in work is not an artifact of more men going to prison.
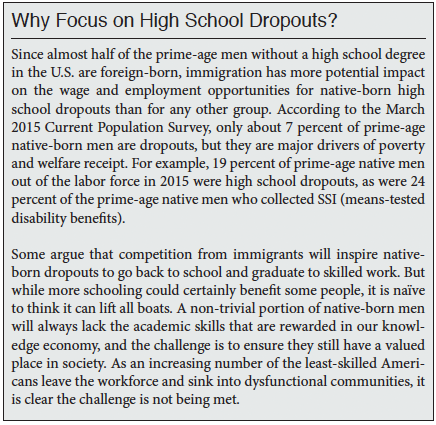
Although prime-age men across the socioeconomic spectrum have been dropping out of the workforce, the problem is most acute among native-born high school dropouts. Figure 2 shows that over one third of men in this group were not even looking for work in 2015, and that percentage has risen sharply in the last two decades. (Annual labor-force data separating natives from immigrants are not available prior to 1994.) By contrast, just 11 percent of native-born men with at least a high school degree in 2015 were out of the labor force, and the increase has been less steep. Notably, immigrant men of all education levels have remained at work. The difference between immigrant high school dropouts and native-born high school dropouts is particularly striking.
The decline in labor-force participation among low-skill men is well known, having been recently discussed, among other places, in a report by the White House,1 a paper published by the American Enterprise Institute,2 and an article for the Conservative Reform Network's "Room to Grow" series.3
This study makes two contributions to that literature. First, it goes beyond mere participation rates to quantify the actual hours worked per year by immigrants and natives of varying skill levels. The differences turn out to be stark. Native-born high school dropouts worked the equivalent of only 35 full-time weeks per year during the 2003-2015 period, while immigrant dropouts worked 49 equivalent weeks. Native-born dropouts saw their work time decline from 41 weeks in 2003-2005 to 32 weeks in 2012-2015, while immigrant dropouts fell only from 52 weeks to 50 weeks. And although natives remain slightly more than half of the nation's high school dropouts, their share of the labor performed by all dropouts declined from 50 percent in 2003-2005 to 40 percent in 2012-2015.
This study's second contribution is to explicitly link immigration to the problems experienced by low-skill natives. None of the papers cited above emphasize that the decline in work is a problem experienced chiefly by natives, nor do any mention that immigrants compete with low-skill natives in the job market.4 The evidence presented in this study does not speak to whether immigrants push out natives from the workforce, but it does show that immigrants replace low-skill natives. As natives leave the workforce — whether because of competition from immigrants, insufficient wages, overreliance on welfare, distaste for manual labor, or some other reason — employers turn increasingly to immigrants.
Without immigration to use as a band-aid5 over the economic and social problems suffered by low-skill natives, employers and politicians would be forced to confront the underlying causes of native idleness, finally taking seriously the goal of restoring work for prime-age men of all skill levels.
Why Does It Matter How Much Low-Skill Natives Work?
When prime-age men leave the workforce in large numbers, it creates problems both for individual families and for communities. At the most basic level, people who do not work do not earn money. Healthy prime-age men have traditionally been expected to provide for their families and contribute to the community, but jobless men cannot provide even for themselves, putting a strain on family members and on the taxpayer. A recent report from the Brookings Institution simulated several anti-poverty measures — e.g., raising the high school graduation rate, encouraging marriage, increasing the minimum wage, etc. — and found that large gains in family income would come only from getting household heads back to work.6
Out-of-work men lose not only current income, but also the future income that prior work experience generates. Measuring the economic return to experience is complicated, but a recent study found that an added year of experience can be worth around 3 to 6 percent of wages for low-skilled workers who recently entered the labor force.7 This is especially important for unemployed men in their 20s who are experiencing what has been euphemistically called "extended adolescence".8 They will be at a disadvantage when they do eventually look for work.9
Working also imparts psychological benefits that go beyond money. Taking pride in one's work is a significant determinant of happiness even in non-prestigious occupations,10 and job loss is associated with depression and physical ailments.11
The costs of labor-force dropout are magnified when non-working men are geographically concentrated. "Many of today's problems in the inner-city ghetto neighborhoods — crime, family dissolution, welfare, low levels of social organization, and so on — are fundamentally a consequence of the disappearance of work," according to the sociologist William Julius Wilson.12 Work fosters the social and economic capital that help communities thrive. In any community where such capital weakens — whether it is predominantly black inner cities or predominantly white Appalachia — dysfunction sets in.13 People in these communities struggle to lead the kind of satisfying lives available to the rest of the country's citizens. Addressing the problem should be one of the most important tasks of social policy.
Methodology
The empirical contribution of this study is to compare immigrant and native work time using actual hours worked during a calendar year, not simply participation in the labor force. One might be skeptical that we could ever know how much time people spend working, since answers to open-ended questions such as, "How many hours do you usually work per week?" are susceptible to subjectivity and exaggeration. To avoid that problem, this study employs the American Time Use Survey (ATUS), in which respondents give detailed accounts of their activities on a given day.
American Time Use Survey.14 The ATUS is sponsored by the Bureau of Labor Statistics (BLS) and has been collected yearly by the Census Bureau since 2003. Its sample is a representative subset of the Current Population Survey, totaling about 26,000 households each year. (Prisoners and other people in institutions are not included.) Respondents are notified in advance of the interview and are explicitly reminded to describe activities that occurred on the day prior to the interview, not activities on a typical or normal day. Interviewers go through the entire 24-hour period, listing all of the activities mentioned by the respondent.
A major strength of the ATUS is that it does not undercount working at home vs. working at an office, or working evenings rather than regular business hours. Another advantage of the interview process is that it asks for specific activities rather than broad generalizations about time use. This makes respondents less likely to inflate time spent on socially approved activities.15 To further reduce subjectivity, BLS researchers place the respondents' raw answers into a detailed set of activity categories that are standardized across all respondents.16
Data Presentation. Each ATUS respondent is interviewed only once, but interviews are spread throughout the year, ensuring that individual responses can be aggregated into a representative picture of the population (or of a subgroup) over the full calendar year. For example, to calculate how many total hours the average person in a given subgroup works throughout the year, researchers can take each respondent's work time for his given day, average across all respondents in that subgroup, then multiply by 365 days.17
Since the total number of hours that a group works in a whole year is not easily interpretable, the main analysis in the next section reports total annual work time in "equivalent full-time weeks", meaning the total number of hours worked in a year divided by 40 hours per week. For example, if a group works 2,000 hours per year on average, that time would be reported as 2,000 hours / (40 hours/week) = 50 weeks.
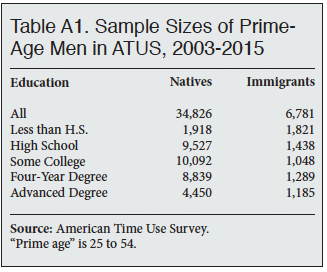
The source of all ATUS data for this study is the ATUS-X website.18 Data are pooled from 2003-2015 to maximize sample size.
Results
Table 1 displays the average amount of time worked per year by prime-age men between 2003 and 2015. For native-born men, education and work time are clearly correlated, with more education leading to more hours worked. The more interesting finding, however, is the low work time of 34.8 equivalent weeks for native-born high school dropouts. If we think of the work year as 52 weeks of 40 hours each, this group of prime-age men spends a third of the year not working.
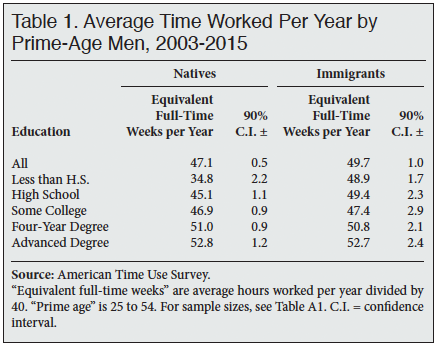
To understand how much of an outlier 34.8 weeks is, consider that the difference in average full-time workweeks between the lowest education group (dropouts) and the second lowest group (high school graduates) is 10.3 weeks, but the difference between the second lowest group and the highest of the five groups (advanced degree holders) is all of 7.7 weeks.
For immigrants, the correlation between education and work time is less evident. From dropouts to college graduates, immigrants work roughly 50 weeks per year. Only advanced degree holders appear to work more. When comparing immigrants to natives, work time differences are insignificant at the higher levels of education, but lower-skilled immigrants work more than lower-skilled natives. Once again, the most acute difference is in the dropout category, where immigrants work 14.1 weeks more than natives.19
Population Share vs. Labor Share. Table 2 shows that natives are 53 percent of the nation's high school dropouts, but their share of the labor performed by all dropouts is just 45 percent. In other words, native dropouts supply much less of the low-skill labor in the United States than one would expect based on their population size. In every other education category — high school graduate through advanced degree — the native share of the population is close to the native share of work hours.
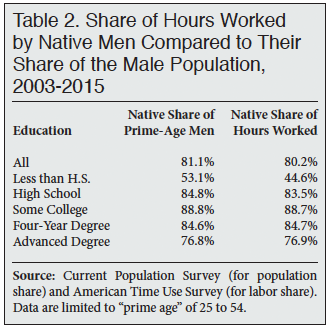
The contrast between the dropout category and the high school graduate category in Table 2 is instructive. Although immigrants work more than natives in both categories, natives so outnumber immigrants among high school graduates that the population share and labor share are still almost the same for natives. The influence of high school graduate immigrants is difficult to detect because its impact is spread over a comparatively large number of high school graduates in the native population. The presence of immigrant dropouts, however, is keenly felt by native dropouts, since the population sizes are roughly equal.
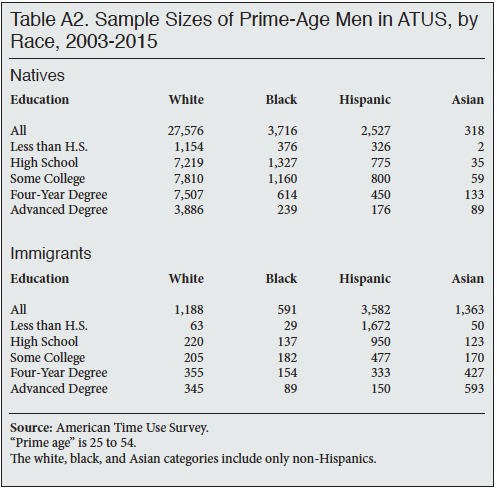
Race and Ethnicity. Table 3 disaggregates the results of Table 1 by race and ethnicity. Among natives of all races, work time increases with education. Cross-racial comparisons show that black natives work the least — the black dropout figure of 23.9 weeks especially stands out — while native-born whites and Hispanics are closer together. Due to the smaller number of observations, there is less certainty with the immigrant estimates by race. However, the Hispanic and Asian columns show high numbers of workweeks across education levels, which is consistent with Table 1.
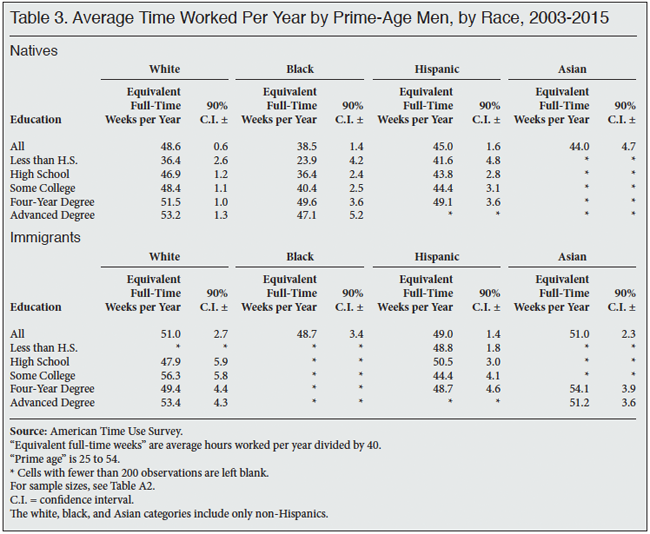
Another take-away from Table 3 is that work time by Hispanic men goes down after the immigrant generation. Native-born Hispanics work four fewer weeks overall than immigrant Hispanics, and seven fewer weeks in the high school dropout category. The decline suggests that later generations of Hispanics exhibit some degree of "downward assimilation" to a less strict work ethic.20
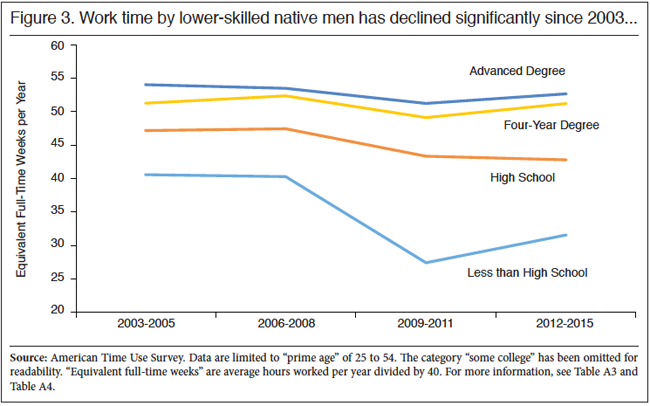
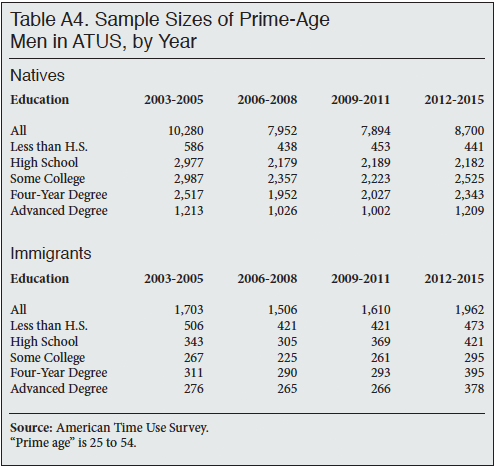
Trends. Due to sample size limitations, a detailed year-to-year trend analysis with the ATUS is not possible. However, we can still get a big-picture sense of how average work time has changed for immigrants and natives since the inception of the ATUS in 2003. Figure 3 shows work trends for natives across four groups of years — 2003-2005, 2006-2008, 2009-2011, and 2012-2015. While work time for advanced degree holders and college graduates remained relatively stable even through the 2008 recession, work time for high school graduates and high school dropouts declined significantly. As of 2015, the two lower-skill groups in Figure 3 do not appear to have recovered from the recession.
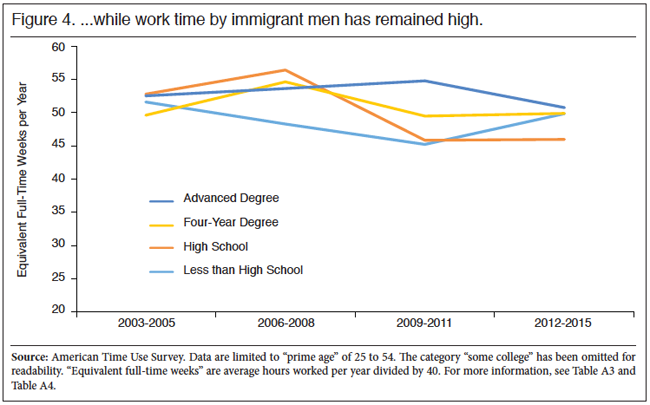
In contrast with native trends in Figure 3, the immigrant work trends in Figure 4 show smaller declines, stronger recovery, and less overall variation. As low-skill natives have seen their hours fall since 2003, immigrants continue to have plenty of work.
Following up on Table 2, Figure 5 looks at how the share of low-skill labor supplied by natives has fallen since the ATUS began. While natives went from 56 percent of the nation's high school dropouts to 52 percent, their share of the labor performed by all dropouts fell much faster — from 50 percent in the 2003-2005 period to 40 percent in 2012-2015, again showing a failure to rebound after the recession.
Job Holders. Low-skill native-born men work significantly less than their immigrant counterparts, and the disparity has grown over the past dozen years. Is the disparity due primarily to natives holding jobs at lower rates than immigrants, or do natives work less even when employed?
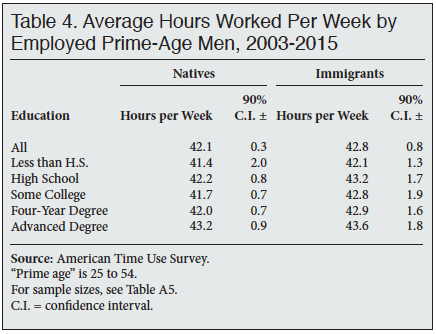
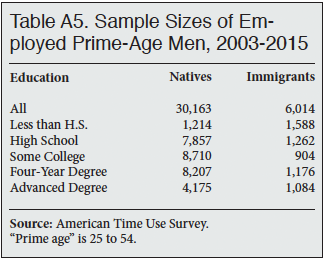
Table 4 considers the average weekly hours worked by prime-age men who held a job at the time of their interview. Perhaps surprisingly, there is little variation within the table. When native men have a job, they work a similar number of hours across skill levels.21 Even the largest difference within the native column — between 43.2 hours for the advance degree category and the 41.4 hours for high school dropouts — does not reach statistical significance. Similarly, though employed immigrants have higher work times than employed natives in each category, all of the differences are small and statistically insignificant. It appears that low-skill natives work less mainly because they are less often employed, not because they work substantially less when they do have a job.
Conclusion
Are immigrants replacing low-skill natives in the workforce? Consider the evidence. Since the early 1960s, prime-age men have been dropping out of the labor market even as immigrants were coming to the United States in increasing numbers. Since 1994 — when separate immigrant and native estimates first became available — the percentage of native-born high school dropouts not in the labor force rose from 26 percent to 35 percent. Over the same period, the percentage of immigrant dropouts not in the labor force actually improved from an already-low 12 percent to 8 percent.
In terms of hours worked, native-born dropouts worked the equivalent of only 34.8 full-time weeks per year over the 2003-2015 period covered by the American Time Use Survey, while immigrant dropouts worked 48.9 weeks. Native-born dropouts have seen their work time decline from 41 weeks in 2003-2005 to 32 weeks in 2012-2015, while immigrant dropouts went from 52 to 50. And while natives fell from 56 percent of the nation's high school dropouts to 52 percent, their share of the labor performed by all dropouts declined much more sharply — from 50 percent in the 2003-2005 period to 40 percent in 2012-2015.
In summary, the United States has been a magnet for low-skill immigration even as low-skill natives have worked less and less. It is difficult to avoid the conclusion that immigrants replace natives in the workforce. However, note the careful choice of the word replace. The results presented in this study do not prove that immigrants push out (or displace) natives. Competition from immigrants is just one of many potential explanations for declining work among low-skill natives. Progressives tend to blame the loss of good-paying union jobs, for example, while conservatives focus more on the expansion of the welfare state and weakened social sanctions against idleness.
Regardless of the reasons that native-born men are not working, immigration devalues the problem. Instead of searching for ways to get natives back to work — whether through higher wages, less access to welfare, social pressure, or some other means — government and business leaders have brought in immigrants to do the work instead. The White House has openly touted this replacement:
Immigration reform would raise the overall participation rate by bringing in new workers of prime working age, offsetting some of the macroeconomic challenges associated with the long-run decline in prime-age male participation.22
In other words, immigration is a substitute for addressing the real problem. Imagine how the focus of politicians and businessmen would change if there were no supply of new immigrants to harvest their vegetables, weed their gardens, or hang their drywall. They would likely take a much greater interest in getting idle American men back to work. Without immigration to function as a band-aid, U.S. leaders would suddenly have a strong incentive to tackle the work problem and all the social dysfunction associated with it.
Some may conclude that native-born men are hopelessly lazy, and that more immigrants are therefore needed to keep labor-intensive industries going. That is the view of advocates who promote immigrant labor for "jobs that Americans won't do".23 Those advocates have abandoned the idea that idle Americans can be brought back into the mainstream of society, yet it was only 50 years ago that virtually all prime-age men worked. Immigration restriction alone may not solve the problems endemic to the American underclass, but it restores the incentive to help.
Appendix Tables
End Notes
1 White House Council of Economic Advisers, "The Long-Term Decline in Prime-Age Male Labor Force Participation", June 2016.
For a critique of the report, see Jason Richwine, "New White House Report on Labor-Force Dropout Is Strangely Confused About Immigration", Center for Immigration Studies, June 22, 2016.
2 Angela Rachidi, "America's Work Problem: How Addressing the Reasons People Don't Work Can Reduce Poverty", American Enterprise Institute, July 2016.
3 Michael R. Strain, "Getting Back to Work", Conservative Reform Network, 2015.
4 The White House mentions in a single paragraph (p. 14) that immigrants have high rates of work, but only to argue that increasing immigration has not pushed down the overall rate.
5 For an expanded discussion of immigration as a band-aid, see Jason Richwine, "The Immigration Band-Aid", The American Conservative, June 2, 2016. Parts of this study are adapted from it.
6 The simulations in the paper are arguably simplistic, but reasonable adjustments would not devalue the importance of working. Isabel Sawhill, Edward Rodrigue, and Nathan Joo, "One Third of a Nation: Strategies for Helping Working Families", Brookings Institution, May 2016.
7 Job tenure (seniority within one firm) has more value than general experience. Moshe Buchinsky, Denis Fougere, Francis Kramarz, and Rusty Tchernis, "Interfirm Mobility, Wages and the Returns to Seniority and Experience in the United States", The Review of Economic Studies, Vol. 77 (2010), pp. 972-1001.
8 For a recent discussion of extended adolescence, see Robert VerBruggen, "The Immature Generation", The American Conservative, June 6, 2016.
9 Erik Hurst, Faculty Spotlight interview, University of Chicago, July 1, 2016.
10 Arthur Brooks, "A Formula for Happiness", The New York Times, December 14, 2013.
11 The direction of causation is not entirely clear, however. David Dooley, et al., "Health and Unemployment", Annual Review of Public Health, Vol. 17 (1996), pp. 449-465.
12 William Julius Wilson, When Work Disappears, New York: Vintage Books, 1997, p. xiii.
13 For a discussion of labor-force dropout and other dysfunctional behavior among lower-class whites, see Charles Murray, Coming Apart, New York: Crown Forum, 2012.
14 This section is adapted from Jason Richwine and Andrew G. Biggs, "How Much Time Do Teachers Spend Working?" , Working Paper, September 11, 2013.
15 The ATUS does not ask, for example, "How many hours did you work yesterday?" to establish work time. Instead, respondents must sequentially describe their specific activities — e.g., "I sent an email" — and then later state if eligible activities were performed for work or not.
16 This study uses the BLS "Working" category, which constitutes "Work, main job; Work, other job(s); Security procedures related to work; Waiting associated with working" and working not elsewhere classified. Using the broader "Work and Work-related activities" category — which adds, for example, social events with coworkers, hobbies that generate income, and job searches — raises work time estimates across the board but generally does not affect the group differences.
17 Harley Frazis and Jay Stewart, "How to Think About Time-Use Data: What Inferences Can We Make About Long- and Short-Run Time Use from Time Diaries?", U.S. Bureau of Labor Statistics, Working Paper no. 442, November 2010.
18 Sandra Hofferth, Sarah M. Flood, and Matthew Sobek, "American Time Use Survey Data Extract System", Version 2.4, Maryland Population Research Center, University of Maryland, and Minnesota Population Center, University of Minnesota.
19 This study is exclusively about men because, as noted earlier, prime-age men have traditionally been expected to be providers, and a decline in work among would-be providers can have profoundly negative consequences for communities. By contrast, long-term trends in women's labor-force participation have been driven by changes in cultural attitudes toward gender roles and child care that are not objectively positive or negative. For the record, native prime-age women worked an average of 33.6 equivalent full-time weeks in the 2003-2015 period, while immigrant prime-age women worked 27.9.
20 The classic article on downward assimilation is Alejandro Portes and Min Zhou, "The New Second Generation: Segmented Assimilation and Its Variants", Annals of the American Academy of Political and Social Science, Vol. 530 (1993), pp. 74-96.
21 This statement comes with a caveat. Employed black natives work about two fewer hours per week than other employed natives, and the difference is statistically significant.
22 White House Council of Economic Advisers, "The Long-Term Decline in Prime-Age Male Labor Force Participation", p. 41.
23 "Comprehensive immigration reform requires a temporary worker program that will relieve pressure on our borders. This program would create a legal way to match willing foreign workers with willing American employers to fill jobs that Americans will not do." President George W. Bush, weekly radio address, March 25, 2006.