Download a PDF of this Backgrounder
Jessica M. Vaughan is director of policy studies at the Center for Immigration Studies. The author would like to thank Grace McCrocklin for research assistance.
Immigration enforcement activity by ICE continued to decline significantly in 2014, according to ICE records.1
- Total deportations credited to ICE, the majority of which were illegal aliens arrested by the Border Patrol and CBP officers at the ports of entry, declined 15 percent from 2013 to 2014.
- Deportations from the interior dropped 34 percent from last year, and are 58 percent lower than the peak in 2009.
- The number of criminal aliens deported from the interior also declined 23 percent since last year, and declined by 39 percent since the peak in 2011.
- Catch and release policies continue. In 2014, deportation processing was initiated for approximately 143,000 aliens out of the 585,000 aliens encountered by ICE agents. Tens of thousands of those let go had been labeled a criminal threat.
- The number of aliens who have received a final order of removal, but who are still in the United States, has risen to nearly 900,000. Nearly 167,000 of these are convicted criminals who were released by ICE and are currently at large.
ICE enforcement records plainly refute claims of robust enforcement made by the Obama administration and its allies. Reports asserting "record" levels of enforcement have to rely on either cherry-picked metrics, comparisons of unlike sets of cases, or unconventional definitions to support this claim.
Total Deportations by ICE: 2014

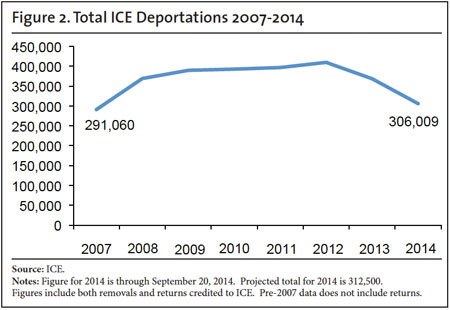
As of late September 2014, ICE had carried out approximately 306,000 deportations. This includes all forms of deportation — both removals and returns.2 These are deportations carried out by ICE, but they may have originated with an arrest by any of the DHS agencies. They include individuals arrested by ICE Enforcement and Removal Operations (ERO) in jails or in fugitive operations; by ICE Homeland Security Investigations (HSI) in security, crime, gang, or worksite operations; by Border Patrol agents while crossing into the United States illegally between ports of entry; by Customs and Border Protection officers while attempting to gain admission at the legal ports of entry; or by USCIS officers as a result of a failed application for an immigration benefit.
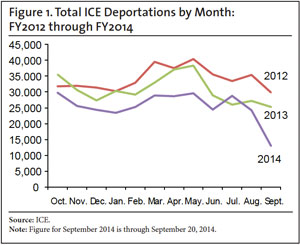
Figure 1 presents monthly deportation figures from October 2012 through September 2014, covering the three most recent fiscal years.3 These statistics show that 2014 ICE deportation levels ran consistently below 2013 and 2012 levels for most of the year, except for the month of July. The trend indicates that the lower year-end totals are not the result of the surge of illegal Central American families and unaccompanied juveniles that peaked in the spring and early summer, which resulted in the diversion of some ICE interior resources to process and release the illegal arrivals. Rather, the overall decline is the result of consistently lower levels of enforcement activity, particularly in the interior, caused by Obama administration policies that are euphemistically known as prosecutorial discretion, which in practice have shielded tens of thousands of illegal aliens from deportation, as will be shown below.
These figures are the continuation of several years of decline in total ICE deportations, as shown in Figure 2. The figures included here date from 2007 onward. Total deportation numbers from before 2007 are not comparable to post-2007 totals because they include removals only, not returns.
ICE Interior Deportations: 2014
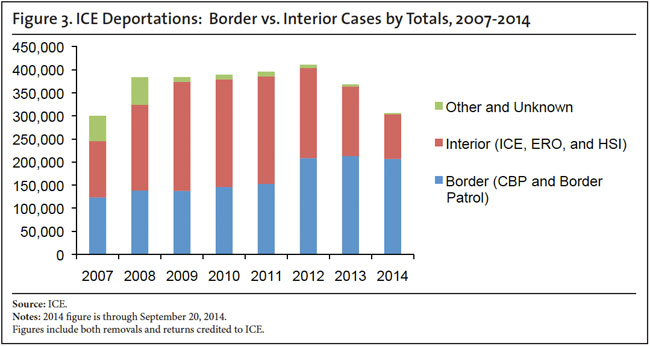
As discussed above, the total deportation figures include cases resulting from arrests by all DHS agencies. The mix of types of deportation cases — that is, border vs. interior cases — has changed significantly since 2008. In 2008, most of the deportations carried out by ICE were interior cases that originated with an arrest by an ICE officer. In 2012, the number of interior cases dropped sharply and the number of border deportation cases referred to ICE grew sharply. Ever since then, the majority of deportations credited to ICE have been border cases. This development is illustrated in Figures 3 and 4.4
Figure 3 shows the total number of deportations credited to ICE broken down according to whether they originated as a border area arrest or as an arrest of an alien in the interior. The number of interior arrests declined significantly after 2011. In addition, the share of total arrests that were interior arrests declined sharply.
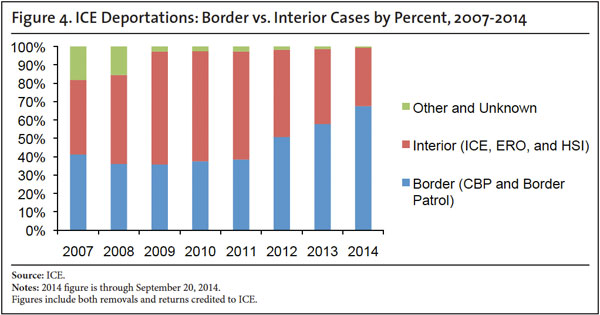
Figure 4 shows the breakdown of border and interior arrests as a percentage of total deportations credited to ICE. As recently as 2009, interior arrests were two-thirds of total deportations credited to ICE. In 2014, interior cases were only one-third of all ICE deportations. This illustrates a significant change in priorities for ICE. Beginning in 2012, less than half of ICE deportations resulted from ICE interior arrests.
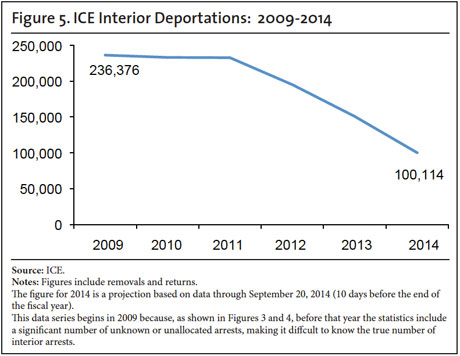
The replacement of interior cases with border cases has masked a significant decline in removals of aliens from the interior of the country that began in the 2012 fiscal year. This decline corresponds with the implementation of the so-called "prosecutorial discretion" policies issued by then-ICE Director John Morton in June 2011.5 According to this new policy, ICE agents and officers are not permitted to arrest certain large categories of illegal aliens, including those who have not been convicted of another crime and those with family members here.
Since this policy was put into place, ICE deportations from the interior have plummeted from a peak of about 236,000 in 2009 to about 100,000 in 2014. Figure 5 illustrates this decline of 58 percent in six years.
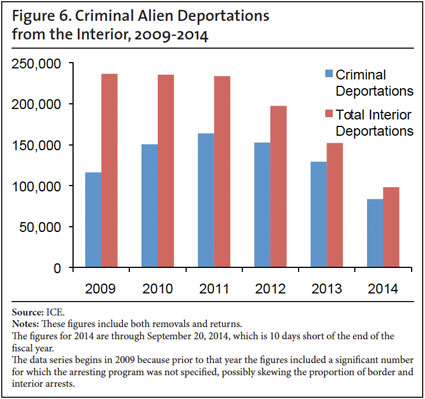
This sharp deterioration in interior enforcement has implications for public safety. Because for years ICE has been focused on removing illegal aliens who have committed crimes as the top priority, a decline in interior enforcement means a decline in the number of criminal aliens deported.
Figure 6 shows the decline in deportations of criminal aliens from the interior. Even though most of the decline in total interior deportations resulted from a steep drop in the number of non-criminals (defined as lacking a criminal conviction), still from 2009 to 2014 criminal deportations declined by 28 percent and have declined by 45 percent since 2012, the peak year for criminal alien deportations. In 2014, ICE deported approximately 32,000 fewer criminals from U.S. communities in the interior than it did in 2009 and 69,000 fewer than it did in 2012.
ICE Metrics Confirm Decline Due to "Prosecutorial Discretion"
Paradoxically, the decline in ICE interior enforcement, including a decline in criminal alien deportations, has occurred over a time period in which ICE was able to identify more criminal aliens than ever before. Basic ICE metrics tracked by the agency on a weekly basis indicate that ICE continues to run a massive catch and release program in which agents are forced to release more deportable aliens than they are allowed to put on the path to deportation.
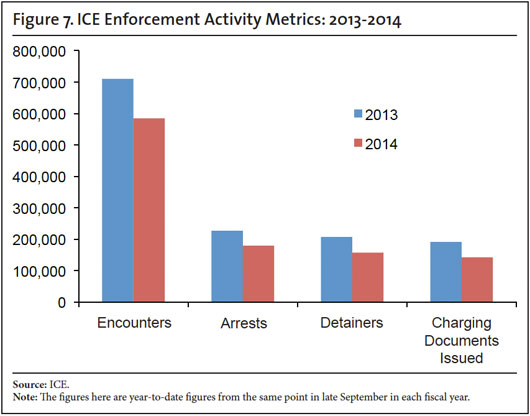
Figure 7 illustrates the gap between the number of deportable aliens encountered by ICE agents and the number of aliens that ICE ultimately targets for deportation.
Encounters are incidents in which an ICE officer is able to question, verify identity, or otherwise confirm that an alien is potentially deportable, usually in a jail setting (individuals that an officer meets or questions during enforcement operations who clearly are not deportable aliens are not tallied as encounters). Arrests are tallied when an alien is taken into custody (usually briefly, unless detention is mandatory due to criminal history). Detainers are notifications to other law enforcement agencies (usually jails or prisons) that ICE is interested in taking custody of an alien upon disposition of the other criminal charges. Charging documents are issued when ICE decides to formally initiate deportation proceedings (historically these have included notices to appear in immigration court, removal orders, and reinstatements of prior removal orders). These metrics are not mutually exclusive; for example, an alien subject to a detainer may also be issued charging documents at the same time or later.
Each of these categories of interior enforcement activity declined from 2013 to 2014. Encounters declined 18 percent, arrests declined by 21 percent, detainers issued declined by 24 percent, and charging documents issued declined by 25 percent.
Several factors may be contributing to a decline in encounters, arrests, and charging documents issued, including discontinuation of partnerships with local law enforcement agencies and the establishment of local sanctuary policies that bar ICE officers from screening inmates inside local jails. Nevertheless, the sheer volume of encounters relative to the other metrics indicates that ICE officers are not lacking opportunities to identify deportable aliens and suggests that the agency should have been able to maintain a steady level of enforcement activity.
A review of the statistics broken down by field office, which is included in ICE's weekly report, suggests that the existence of local sanctuary policies does not fully explain the overall decline in enforcement. While sanctuary policies recently have been adopted in certain major metropolitan areas like San Francisco and New York City, every ICE field office except for those in Houston and San Antonio, which presumably processed many of the recent Central American arrivals, experienced a decline in deportations. Field offices such as Atlanta, El Paso, Phoenix, and Salt Lake City also posted significant declines, even in the absence of new sanctuary policies, as did Chicago, where the non-cooperation policy dates back to FY 2012.
According to ICE officials speaking off the record, the decline in interior enforcement activity has less to do with local sanctuary policies and much more to do with policies of prosecutorial discretion that severely limit the circumstances in which ICE officers can arrest or charge an illegal alien encountered. For example, ICE officers, with few exceptions, are required to wait for illegal aliens to be convicted of crimes before initiating deportation proceedings, even if the aliens are otherwise deportable. This presents logistical hurdles for ICE and increases the chances that the alien will abscond from prosecution and/or disappear. In addition, ICE officers are instructed to release or take a pass on illegal aliens whose crimes are designated as "minor" or who have family members in the United States. The result is that only a fraction of deportable aliens that ICE identifies actually will be processed for deportation.
It is important to note that, similarly, only a fraction of those aliens labeled as a criminal threat at the time of encounter were selected for deportation by ICE in 2014. According to the weekly ICE metrics report cited above, as of September 20, 2014, ICE officers had reported 170,125 encounters with aliens deemed a criminal threat. Meanwhile, only 90,500 criminal aliens were issued charging documents, indicating a startlingly large number — potentially nearly 80,000 — of illegal aliens with criminal histories who were able to escape deportation proceedings in 2014, even after being encountered by an ICE officer.6
Number of "Non-Departed" Aliens Still Growing
ICE's weekly metrics report includes information on the number of aliens who have been issued a final order of removal, but who remain in the country. As of September 20, 2014, the total number of such aliens was 897,572. Of these, less than 2 percent (14,629) were detained in ICE custody. Yet 174,258 of these post-final-order deportable aliens were convicted criminals. Only about 4 percent (7,477) of the convicted criminal post-final-order aliens were detained in ICE custody.
This means that, as of the end of the 2014 fiscal year, there were approximately 167,000 convicted criminal aliens at large in the United States (released by ICE) who have been ordered removed and exhausted all appeals. In addition, there were approximately 716,000 deportable non-criminal aliens at large who have been ordered removed and exhausted all appeals.
The number of "non-departed" aliens grew by about 25,000 cases from 2013 to 2014. As of the end of the 2013 fiscal year, the total number of post-final-order aliens remaining in the country was 872,504. The number of "non-departed" convicted criminal aliens grew by nearly 7,000. Even more concerning, the number of at-large post-final-order convicted criminals grew by nearly 8,000 cases, while the number of detained aliens in that category shrank by nearly 1,000 cases. This means that more of the criminal aliens that ICE has been unable to remove are at large than ever before.
Conclusion
The Obama administration has sought to portray its performance on immigration enforcement as smarter, better, and more successful than previous administrations. In addition, it has sought to deflect public attention away from the decline in interior enforcement by emphasizing border apprehensions, by shifting the border deportation caseload to ICE, and by diverting more ICE resources to supporting the Border Patrol's enforcement activity.7
Yet the statistics kept by ICE to measure interior enforcement activity reveal that it is in a state of collapse, with declining arrests and deportations, tens of thousands of criminal aliens being released back to American communities, and many more illegal residents who have been declared immune from enforcement. Such a state of affairs will continue to attract new illegal settlement, further increasing the burden that illegal immigration imposes on the nation. In addition, it serves as an invitation to foreign groups and individuals who wish to inflict harm on Americans to take advantage of our lax policies.
Congress can affect this situation by restraining further executive action that would shield even more illegal residents from enforcement, and by insisting that the executive branch agencies spend the public funds they receive to carry out their enforcement mission in a way that is consistent with congressional and public expectations.
End Notes
1 "Weekly Departures and Detention Report (WRD)", prepared by the Statistical Tracking Unit of the Office of Enforcement and Removal Operations of U.S. Immigration and Customs Enforcement (ICE), edition as of September 22, 2014. Figures from this document are not the final 2014 total, but include data through September 20, 2014, which is 10 days before the end of the fiscal year.
2 For an explanation of these types of deportations, see "Deportation Basics", Center for Immigration Studies, July 2011.
3 The September 2014 is a partial month (Through September 20).
4 The source for the data on interior vs. border removals is a database of all ICE deportation cases from 2003 to 2013 obtained through a FOIA case. In addition, the ICE weekly deportation report previously cited includes this breakdown for 2014.
5 "Exercising Prosecutorial Discretion Consistent with the Civil Immigration Enforcement Policies of the Agency for the Apprehension, Detention and Removal of Aliens", June 17, 2011.
6 Some of the encounters may be duplicates. The author submitted a FOIA request to obtain more details about individual aliens encountered by ICE and their criminal histories, but ICE declined to release this information.
7 See Jessica M. Vaughan, "Deportation Numbers Unwrapped: Raw Statistics Reveal the Real Story of ICE Enforcement in Decline", Center for Immigration Studies, October 2013.