Summary
As the annual H-1B quota gets exhausted, industry groups claim that the huge number of H-1B visa applications demonstrates that more H-1B visas should be available. However, comparing the number of H-1B visas in their largest represented occupations (computers and engineering) to the number of jobs created in those occupations presents a different picture of the H-1B visa program. This study examines the relationship between the number of H-1B visas and job growth. It finds that the number of H-1B visas approved in these fields greatly exceeds any reasonable number reflected by economic demand.
Key Findings
- There is no cause and effect relationship between H-1B visas and job creation. Adding H-1B visas does not create additional jobs for U.S. workers.
- Since 1999, the United States has approved enough H-1B visas for computer workers to fill 87 percent of net computer job growth over that period.
- Since 1999, the United States has had a net loss of 76,000 engineering jobs. Over the same time period, the United States has approved an average of 16,000 new H-1B visas each year for engineers.
- If current employment trends continue and the H-1B quota remains unchanged, the United States will approve enough H-1B visas for computer workers to fill about 79 percent of the computer jobs it creates each year.
- Pending legislation would increase the number of H-1B visas for computer workers to above the number of computer jobs created each year.
- The data suggest that a large percentage of those who legally enter United States on H-1B visas go into the illegal alien pool.
Background
H-1B is a non-immigrant, employer-sponsored guest worker visa that allows people in to work on a temporary basis in the United States in an occupation that generally requires a bachelor’s or higher level of education.1 H-1B visas are used for people with in a wide range of fields. However, workers in computer and engineering occupations receive the majority of the visas and the H-1B program is most closely identified with technology occupations. In general, one can remain in the United States for up to six years on an H-1B visa. An H-1B visa is valid for up to three years and can be renewed once. A worker on an H-1B visa can change jobs and transfer the visa among employers.
The focus of most debate on the H-1B program has been the number of visas available. Each year since 2004, the annual visa quota has been exhausted. Some critics claim that exhaustion of the quota shows that it is not large enough due to a shortage of workers.2 Others, including this report, argue that H-1B usage does not reflect the need for workers.
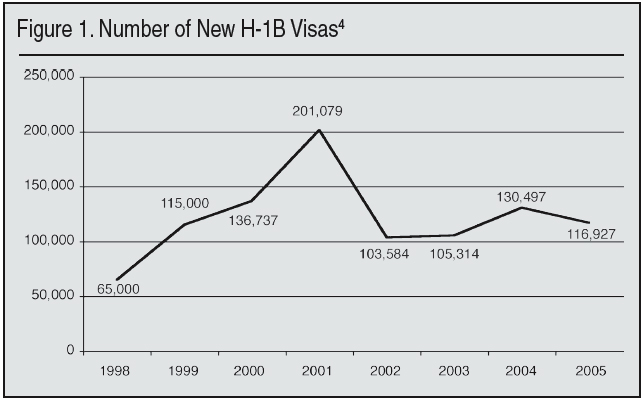
The number of visas available has changed substantially over the past decade. Up until 1998, there was an annual limit of 65,000 H-1B visas. From 1998 to 2004 Congress enacted several changes to this limit. In 1998, the limit was temporarily expanded to 115,000 through FY 2003. That temporary increase was increased to 195,000 in 2000. Also in 2000, visas to government and non-profit research laboratories and to universities were exempted from the annual limits. In 2004, Congress approved another 20,000 H-1B visas for those with graduate degrees from U.S. universities.3
Under the current law, the number of visas is:
- 65,000 in the general pool.
- 20,000 to those with graduate degrees from U.S. universities.
- Unlimited to non-profit and government research laboratories and to universities.
Figure 1 shows how the number of approved new H-1B visas (not counting renewals and transfers) has changed with the statutes.
There are several bills pending that would increase the number of H-1B visas. Most of bills are extremely similar in their text, suggesting a common origin. The common features include a large increase in the base H-1B quota; a “market-based limits” provision that automatically increases (and never decreases) the H-1B quota; transferring the 20,000 additional visas for U.S. graduates to those with foreign graduate degrees; and exempting those currently eligible for those 20,000 visas from the limits entirely. Combined, the provisions in these bills have the effect of removing all limits to the number of H-1B visas given each year.
Following are two specific examples of pending H-1B expansion bills, illustrating their similarities and differences in how they change the H-1B visa allocation:
SKIL Act of 2007 (S. 1083)
- Raises the 65,000 general pool to 115,000 with the 115,000 figure automatically increased by 20 percent the next year when that figure is reached.
- 20,000 to those with graduate degrees from foreign universities.
- Unlimited to non-profit and government research laboratories and to universities.
- Unlimited to those with graduate degrees from U.S. institutions.
Innovation Employment Act (H.R. 5630)
- Raises the 65,000 general pool to 130,000. When that figure is reached, it automatically jumps to 180,000 with 20 percent increases when the limit is reached after that.
- 20,000 to those with graduate degrees in science, technology, engineering, or mathematics from foreign universities.
- Unlimited to non-profit and government research laboratories and to universities.
- Unlimited to those with graduate degrees in science, technology, engineering, or mathematics from U.S. institutions.
Data Sources
This study only uses publicly available data so others can reproduce and verify the results presented here. The following sources of data were used:
- H-1B figures come from the Annual Reports on H-1B visas issued by the Immigration and Naturalization Service and its successor, U.S. Citizenship and Immigration Services (data available 2000-2005). This supplied the number of new H-1B visas and the number of new H-1B visas for computer and engineering workers.
- Labor Condition Applications (LCAs) come from the Foreign Labor Certification Data Center, http://www.flcdatacenter.com (data available 2001-2007). The study used approved LCAs for computer workers.
- Overall employment figures come from the Bureau of Labor Statistics Census of Employment and Wages, http://www.bls.gov/cew (annual data available 1994-2006).
- Employment figures for computer and engineering professionals come from the Bureau of Labor Statistics Occupational Employment Statistics, http://www.bls.gov/oes (data available 1999-2006).
- Turnover rates are from Bureau of Labor Statistics Job Openings and Labor Turnover Survey, http://www.bls.gov/jlt/.
The charts in this report use the largest data range available at the time of writing. Variations in date ranges are solely due to limits in data availability.
H-1B and Job Growth
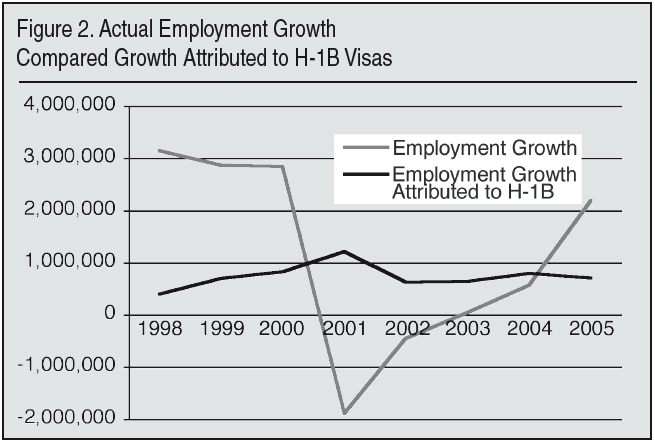
There have been published claims that H-1B visas create jobs. Both the Wall Street Journal5 and The Economist6 have asserted on their editorial pages that each H-1B visa creates five additional jobs. If that kind of relationship existed, the H-1B program should be creating around 500,000 to 1,000,000 new jobs a year. This alleged job creation is so large that it would be immediately apparent in the data.
It simply is not there. Statistically, there is no linear correlation whatsoever between H-1B visas and job growth.7
A graph provides a good illustration. Figure 2 shows the annual growth in employment compared to the number of jobs H-1B should be creating if the kind of relationship claimed by the Wall Street Journal and The Economist existed.8 The trend in the data is the opposite of that claimed.9 Growth in H-1B visas has corresponded with decreases in employment growth. This is not to say the data show H-1B visas cause job creation to decrease. Rather, it shows that H-1B visas do not produce job creation and, most importantly, that H-1B usage is not self-correcting to economic demand.
H-1B Levels and Employment for Computer Workers
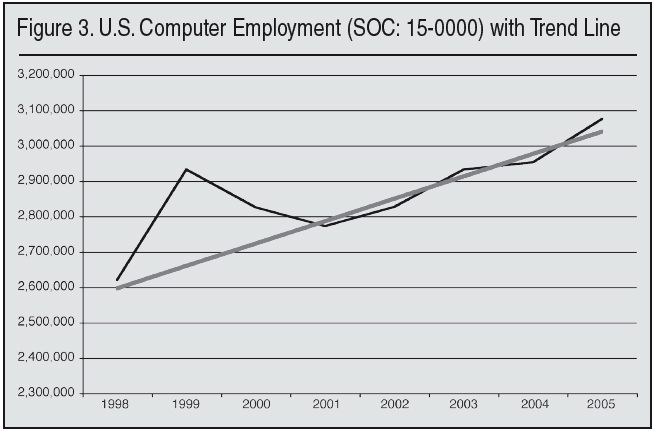
Job growth for computer workers has been steady over recent years with the exception of the period of the dot-com boom and bust of 2000-2001. Figure 3 plots employment in computer occupations as reported by the Bureau of Labor Statistics.10 The straight line in the graph shows a linear regression (ignoring the dot-com boom and bust years) that models employment growth. Over this period, employment of computer workers can be predictably modeled as linear growth at about 63,000 jobs per year.
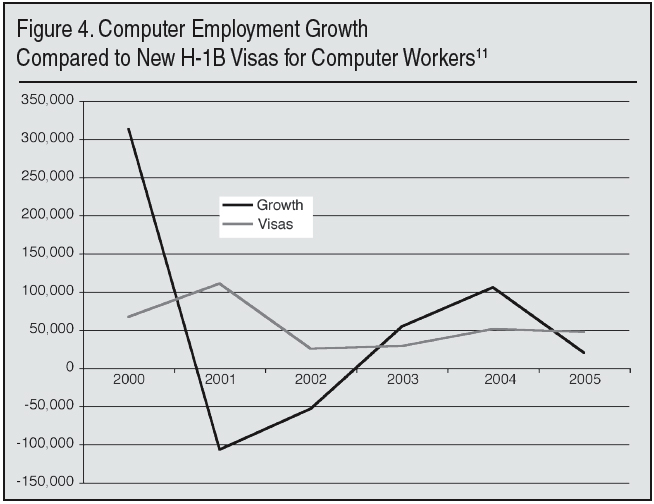
The demand for H-1B visas does not reflect the economic demand as measured by job creation. Figure 4 plots the growth in U.S. computer employment against the number of new H-1B visas approved for computer workers. One can see there is no relationship between the number of new jobs and the number of H-1B visas. For three of the years during this period (2001, 2002, and 2005) the number of H-1B visas approved for computer workers exceeded job growth in that year.
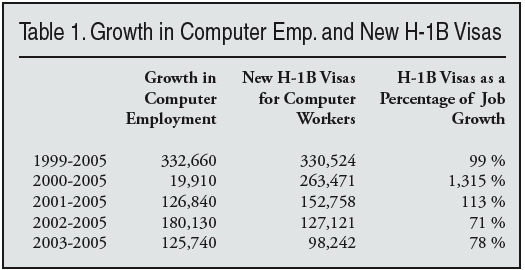
The discrepancy between the number of H-1B visas and the number of new jobs is not an artifact from year-by-year measure. Table 1 shows how the net increase in computer employment compares to the number of new H-1B visas approved for computer workers over all year ranges from the first available data to the last. No matter what year range one looks at, the United States is approving H-1B visas for computer workers at a rate to fill at least 70 percent of the computer jobs created. Even taking into account people leaving the industry (e.g. retirement or job changes), the discrepancy between H-1B visas and jobs is too vast to be explained through economic factors. Unfortunately, there is no reporting how many approved H-1B visas never translate into an actual admission into the United States. This difference would probably explain a small discrepancy.
Under current policy, this trend of approving enough H-1B visas to fill a substantial portion of new computer job growth is likely to continue. There has been an average of 49,000 new H-1B visas approved each year for computer workers under the current law. At a growth rate of 63,000 new computer jobs a year, the number of new H-1B visas will be sufficient to fill 78 percent of computer job growth in the country.
H-1B Levels and Employment for Engineers
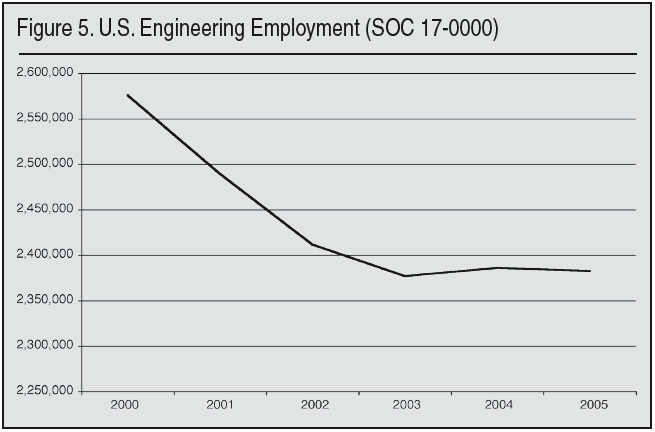
The employment level for engineers has been less regular than that of computer workers. Figure 5 plots engineering employment as reported by the Bureau of Labor Statistics. Like computer employment, engineering employment took a sharp downturn after the dot-com bust. Unlike computers, engineering employment has not returned to pre-bust levels. Most recent years have actually seen a decline in employment for engineers. It is ironic that one of the most common arguments put forth for bringing in more H-1B workers is the high percentage of engineering graduate degrees going to foreign students12 when the engineering employment picture is so bleak.
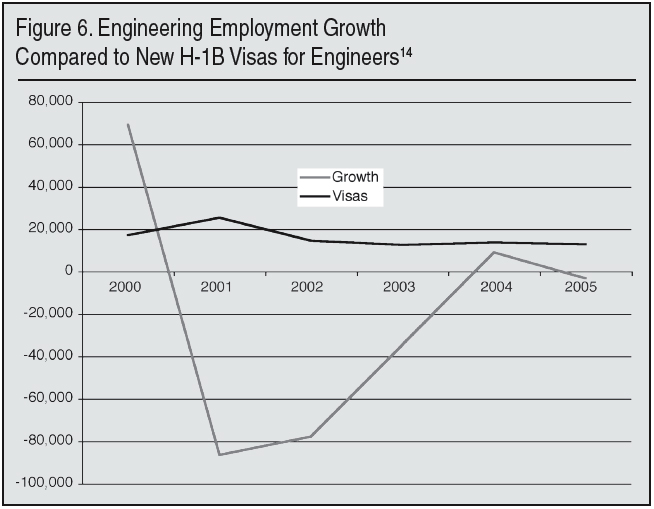
As with computer occupations, H-1B usage for engineers has no relation to actual job creation. With job growth in engineering being much worse that it is in computers, the discrepancy between jobs and visas is much more visible. Every year since 2001, the number of H-1B visas approved for engineers has been greater than the number of engineering jobs created.
Accounting for the Discrepancy
Clearly there is a discrepancy between H-1B visa numbers and job creation. There are more H-1B visas approved for engineers than there are engineering jobs. The number of H-1B visas for computer workers is about 70-80 percent of the rate of job creation. It is inconceivable that H-1B computer workers are taking anywhere close to that percentage of jobs being created.
Following are possible explanations for the discrepancy between job creation and H 1B visas:
- H-1B visas that never translate into entries.
- Turnover (e.g. retirements and H-1B workers leaving).
- People legally admitted under H-1B visas are entering the illegal alien pool.
It is possible for an approved H-1B application to not become an entry into the United States. There are two ways this can happen. First of all, someone with an application approved by the USCIS could have his or her visa rejected by the State Department. In addition, some companies stockpile visas and bring the workers into the United States only when an actual business need develops. Unfortunately, it is not known how many visa approvals do not translate into actual entries into United States. In counting H-1B visas, the State Department does not distinguish among new visas, renewals, or transfers. In counting entries, USCIS does not distinguish a first entry into the United States from a reentry.
The job growth figures presented here have been net job growth. During each measured period, there are going to be people changing jobs, people retiring or leaving the field, and even people on guest worker visas who leave the country. However, turnover cannot account for H-1B visa levels at over 70 percent of new computer job creation. The turnover rate for professional occupations according to the BLS is under 5 percent. There is no evidence to suggesting that H-1B workers are taking close to that percentage of new and turned over computer jobs.
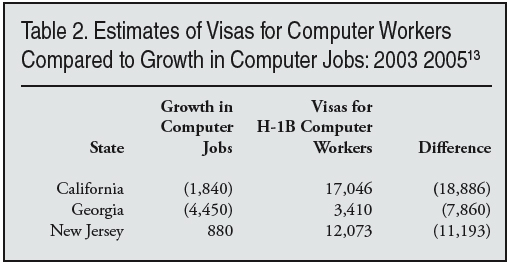
The discrepancy between jobs and visas becomes even starker when examining the data state-by-state. The geographic distribution of approved Labor Condition Applications for computer workers was used to create a by-year estimate of the number of H-1B visas for computer workers going to each state. California, New Jersey, and Georgia had the highest discrepancy between computer job growth and number of H-1B visas for computer workers. Combined, these three states represent about 40 percent of the H 1B visas for computer workers.
A state-by-state analysis shows no prediction ability between job creation and H-1B usage. What is more, the high concentration of visas in a few states suggests that the demand for H-1B visas is driven by the capacity of avenues of importation, not workforce need. In other words, immigration, not job creation, appears to be the primary driver of H-1B demand.
The most likely reason for the discrepancy between job growth and H-1B visas is that a significant percentage of people legally admitted under H-1B visas enter the illegal alien pool. Such illegal aliens would be armed with valid Social Security numbers and would be difficult to detect. The high concentration of visa-to-job discrepancies in certain states suggests that the country has created organized centers for importing illegal aliens through H-1B visas.
How Many H-1Bs Do We Need?
The number of H-1B visas approved does not reflect the number jobs being created. Furthermore, H-1B visas do not translate into employment growth. This raises the issue of how many H-1B visas are actually needed.
One approach would be to use computer job growth as a baseline. With computer job growth predictable at about 63,000 a year and the percentage of H-1B visas going to computer workers relatively constant at about 40 percent, one can come up with a reasonable estimate of national H-1B needs. If one picks a percentage of computer jobs that the nation wants to fill with H-1B workers, Table 3 shows how many H-1B visas would be required each year under the employment trends of the past decade. One could easily adjust these figures to account for any future changes in job growth trends.
End Notes
1 8 U.S.C. § 1101 (a)(15)(H)(i)(b) and 8 U.S.C § 1184(i)(1). Fashion models are also eligible for H-1B visas. Since their numbers are small and they rarely enter the H-1B debate, this report ignores them.
2 See for example, “Increase visas to bring in more foreign workers,” Kansas City Star, March 22, 2008.
3 The details dealing with trade agreements are omitted as they have little effect on the system.
4 Figures for 1998 and 1999 are estimated based upon the quotas in place at those times.
5 “More Visas, More Jobs” Wall Street Journal, March 19, 2008.
6 “Help Not Wanted,” The Economist, April 10, 2008.
7 Spearman Rank Order Correlation of –0.0167.
8 These newspapers were effectively making the claim that H-1B visas have driven half the job growth in the United States.
9 A regression analysis of the data here gives 29 jobs lost for each H-1B visa. However, the R-squared value here is so low (0.36) that the data has no predictive value in showing that H-1B causes decreases in employment.
11 Employment data are from the Bureau of Labor Statistics, www.bls.gov/oes. H-1B data is from INS and USCIS annual reports on H-1B visas. The range in years is shorter than in Figure 3 because is not possible to show growth for the first reported year (1999) and USCIS has not released H-1B figures for FY 2006 and later.
12 See for example Patrick McGee, “Visa lottery for skilled workers has doubters,” Fort Worth Star-Telegram, March 31, 2008.
13 This date range (from the recovery following the dot-com bust to latest) was selected to illustrate trends under the current law. Using the earliest to latest (2000-2005) the jobs/visa gap for California increases to 88,000.
14 The range in years is shorter than in Figure 5 because it is not possible to show growth for the first reported year (1999) and USCIS has not released H-1B figures for FY 2006 and later.