Download a PDF of this Backgrounder.
Jason Richwine, PhD, is an independent public policy analyst based in Washington, D.C., and a contributing writer at National Review.
The author thanks Steve McClaskie at Ohio State’s Center for Human Resource Research (CHRR), which manages the NLSY. Steve’s prompt answers to all questions thrown at him were invaluable. Of course, responsibility for the accuracy of this report falls entirely on the author, and CHRR takes no position on the findings.
Summary
The intergenerational assimilation of low-skill immigrants is an important issue in the broader immigration debate. If the children and grandchildren of low-skill immigrants eventually rise to the same socioeconomic level as natives, then the poverty-related problems caused by low-skill immigration, though painful today, will dissipate over time.
Past research on the assimilation of Americans who have ancestors from Mexico (the largest source of low-skill immigration to the United States) indicates that Mexican-Americans continue to lag behind in the third generation and beyond. However, reliance on survey respondents self-identifying as Mexican-American has made this research less than definitive, as not everyone with Mexican-born grandparents has retained a Mexican-American identity.
To solve this "ethnic attrition" problem, researchers have turned to the 1997 panel of the National Longitudinal Survey of Youth (NLSY-97). Unique among government data sets, the NLSY-97 includes grandparent birth data that can objectively identify the Mexican-American third generation with no ethnic attrition. In replicating and extending a recent NBER working paper that uses the NLSY-97, this report affirms that although Mexican-Americans make progress over time, the third generation still has significantly lower education and earnings compared to fourth-plus generation white Americans.
Unfortunately, because the NLSY-97 data set is relatively small, the magnitudes of these difference are subject to considerable uncertainty. If grandparent birthplaces were incorporated into a larger data set such as the Current Population Survey, much more detailed and precise estimates could be calculated.
Introduction
Although the average education level of immigrants to the United States has been rising, the post-1965 immigration wave remains markedly less skilled than the native population. Immigrants currently account for 40 percent of all working-age Americans without a high school diploma, more than double their percentage of the general population.
The impact of this low-skill immigration has been mixed. Like workers of all education levels, low-skill immigrants help reduce the price of goods and services that require their labor. However, their low earnings exacerbate the problems of poverty, welfare dependence, poor academic performance, and social isolation, and they compete in the labor market with U.S. natives who struggle with similar issues. Immigration restrictionists have long argued that these costs outweigh the benefits.
Many supporters of low-skill immigration view the costs as only temporary, however. They predict that the children and grandchildren of low-skill immigrants will climb the ladder, eventually matching natives on key measures such as education and income. As evidence, they often cite the experience of European immigrants from a century ago. "Nativists said the same thing about the Irish!" is a familiar rebuttal to doubts about the long-term assimilation of post-1965 immigrants, the least skilled of whom have come mainly from Mexico and other parts of Latin America. But the long-term assimilation of Latin Americans has always been more a matter of faith than of data. This report adds to the literature showing that education and earnings deficits persist for the grandchildren of Mexican immigrants.
Previous Research
In this report, "first generation" immigrant means a foreign-born person; "second generation" means U.S.-born with at least one foreign-born parent; and "third-plus generation" means U.S.-born with two U.S.-born parents.1 How much do Mexican-Americans improve from the first generation to the third-plus? To answer that question with survey data, the birthplaces of respondents and their parents must be known. Fortunately, the Census Bureau's Current Population Survey (CPS) has been providing that information dating back to 1994. Since that time, the assimilation pattern has been clear. The children of Mexican immigrants make substantial strides, but then progress appears to stall. The third-plus generation does little better than the second, and Mexican-Americans remain substantially behind other third-plus generation Americans, particularly non-Hispanic whites.
For example, according to recent CPS data, just 7 percent of working-age Mexican immigrants have a college degree, compared to 39 percent of white Americans. As expected, second-generation Mexican-Americans improve markedly, increasing their college graduation rate to 19 percent. Unfortunately, no further progress is observed. College completion for the third-plus generation stands at 18 percent. This same basic pattern has been observed over many years across many data sets.2
Researchers have identified two problems with using the third-plus generation as a measure of assimilation. First, it includes Mexican-Americans who have deep roots in American history, dating back to the 1800s in some cases. The life situations and experiences of these fourth-, fifth-, or even sixth-generation Mexican Americans may be altogether different from the grandchildren of immigrants who make up the true third generation. Second, the third-plus generation is subject to "ethnic attrition". Because the CPS does not contain information on grandparents' countries of birth, defining the Mexican third-plus generation relies on respondents volunteering their Mexican ethnicity. If the most assimilated third-generation Mexican-Americans no longer identify as Mexican, the people designated as the third-plus generation may actually be a lower-achieving subset of the real third generation.
In November 2017, economists Brian Duncan, Jeffrey Grogger, Ana Sofia Leon, and Stephen J. Trejo released a working paper that addresses these two concerns.3 They used a unique data set that identifies where each respondent's grandparents were born, allowing the true third generation to be identified regardless of ethnic self-identification. This report replicates and extends Duncan et al.'s findings.
Data and Methods
As noted above, this report is a replication and extension of a November 2017 working paper by Duncan et al. It uses the same data set and a similar methodology to evaluate the educational progress of Mexican-Americans by generation. Unlike the Duncan et al. paper, however, this report goes beyond educational attainment to include test scores, work time, and earnings.
The data set is the 1997 panel of the National Longitudinal Survey of Youth (NLSY-97). Since 1997, the NLSY-97 has been following a representative sample of Americans born between 1980 and 1984. The most recent available survey year is 2015.
Different Samples. About three quarters of the NLSY-97 respondents are part of a cross-section of youths, while the remaining quarter come from a special oversample of black and Hispanic youths. As Duncan et al. explain, this ethnicity-based oversample complicates the analysis. By definition, the Hispanic portion of the oversample is subject to ethnic attrition, since respondents needed to identify as Hispanic to qualify. In other words, the oversample skipped everyone without Hispanic identity even if they had Hispanic ancestry. Only the cross-sectional portion of the NLSY-97 is free of ethnic attrition.
In this report, the Mexican third generation is defined as all respondents who were born in the United States, have two parents born in the United States, and have at least one grandparent who was born in Mexico. However, to facilitate analysis of ethnic attrition, characteristics of the Mexican third generation are always reported in two groups with different but overlapping membership.
The Mexican third-generation CROSS-SECTION refers to the third-generation Mexican-Americans who appear in the cross-sectional portion of the NLSY-97. There are 81 such respondents, 69 of whom identified as Hispanic in the survey screener. The cross-section is informative because it is completely free of ethnic attrition. The measured achievement of this group cannot be downwardly biased by the dropout of people who do not identify as Mexican, since membership is determined solely by birthplace.
The Mexican third-generation ETHNIC SAMPLE refers to all 78 third-generation Mexican Americans from the oversample, plus the 69 third-generation Mexicans who self-identify as Hispanic from the cross-section, for a total of 147 respondents.4 The ethnic sample sets up a contrast with the cross-section to illustrate how ethnic attrition may be biasing earlier estimates.5
Outcome Measures. Following Duncan et al., this report measures educational attainment in the form of high school and college graduation rates across Mexican-American generations. To extend the analysis to achievement, this report calculates average percentile scores on the Armed Forces Qualification Test (AFQT), which the military uses to assess math and verbal skills.
Moving beyond education, this report calculates the average number of weeks worked and average weekly earnings. These two economic outcomes are averaged over the 2011, 2013, and 2015 survey years to improve sample size and reduce volatility. Earnings are adjusted to constant 2015 dollars.6
All averages are calculated with sampling weights, and standard errors are corrected for the NLSY-97's multi-stage clustered sample design.7
Comparison Groups. Again following Duncan et al., this report compares the Mexican American third generation with two separate groups from the fourth-plus generation — non-Hispanic whites and non-Hispanic blacks. To qualify for the fourth-plus generation, respondents must have four U.S.-born grandparents.
Results
All results are displayed in Table 1. Rows 1 to 4 list the different Mexican generations analyzed here. The "1.5 generation" refers to respondents born in Mexico, with the ".5" serving as a reminder that, unlike most immigrants, NLSY-97 immigrants arrived in the United States as children. As described earlier, a second-generation Mexican-American is the child of at least one Mexican immigrant, and the third-generation refers to the grandchildren of at least one Mexican immigrant. The two third-generation groups are the cross-section and the ethnic sample, which are defined in the previous section. Rows 5 and 6 are the white and black fourth-plus generation groups, respectively, which serve as points of comparison for the Mexican American generations.
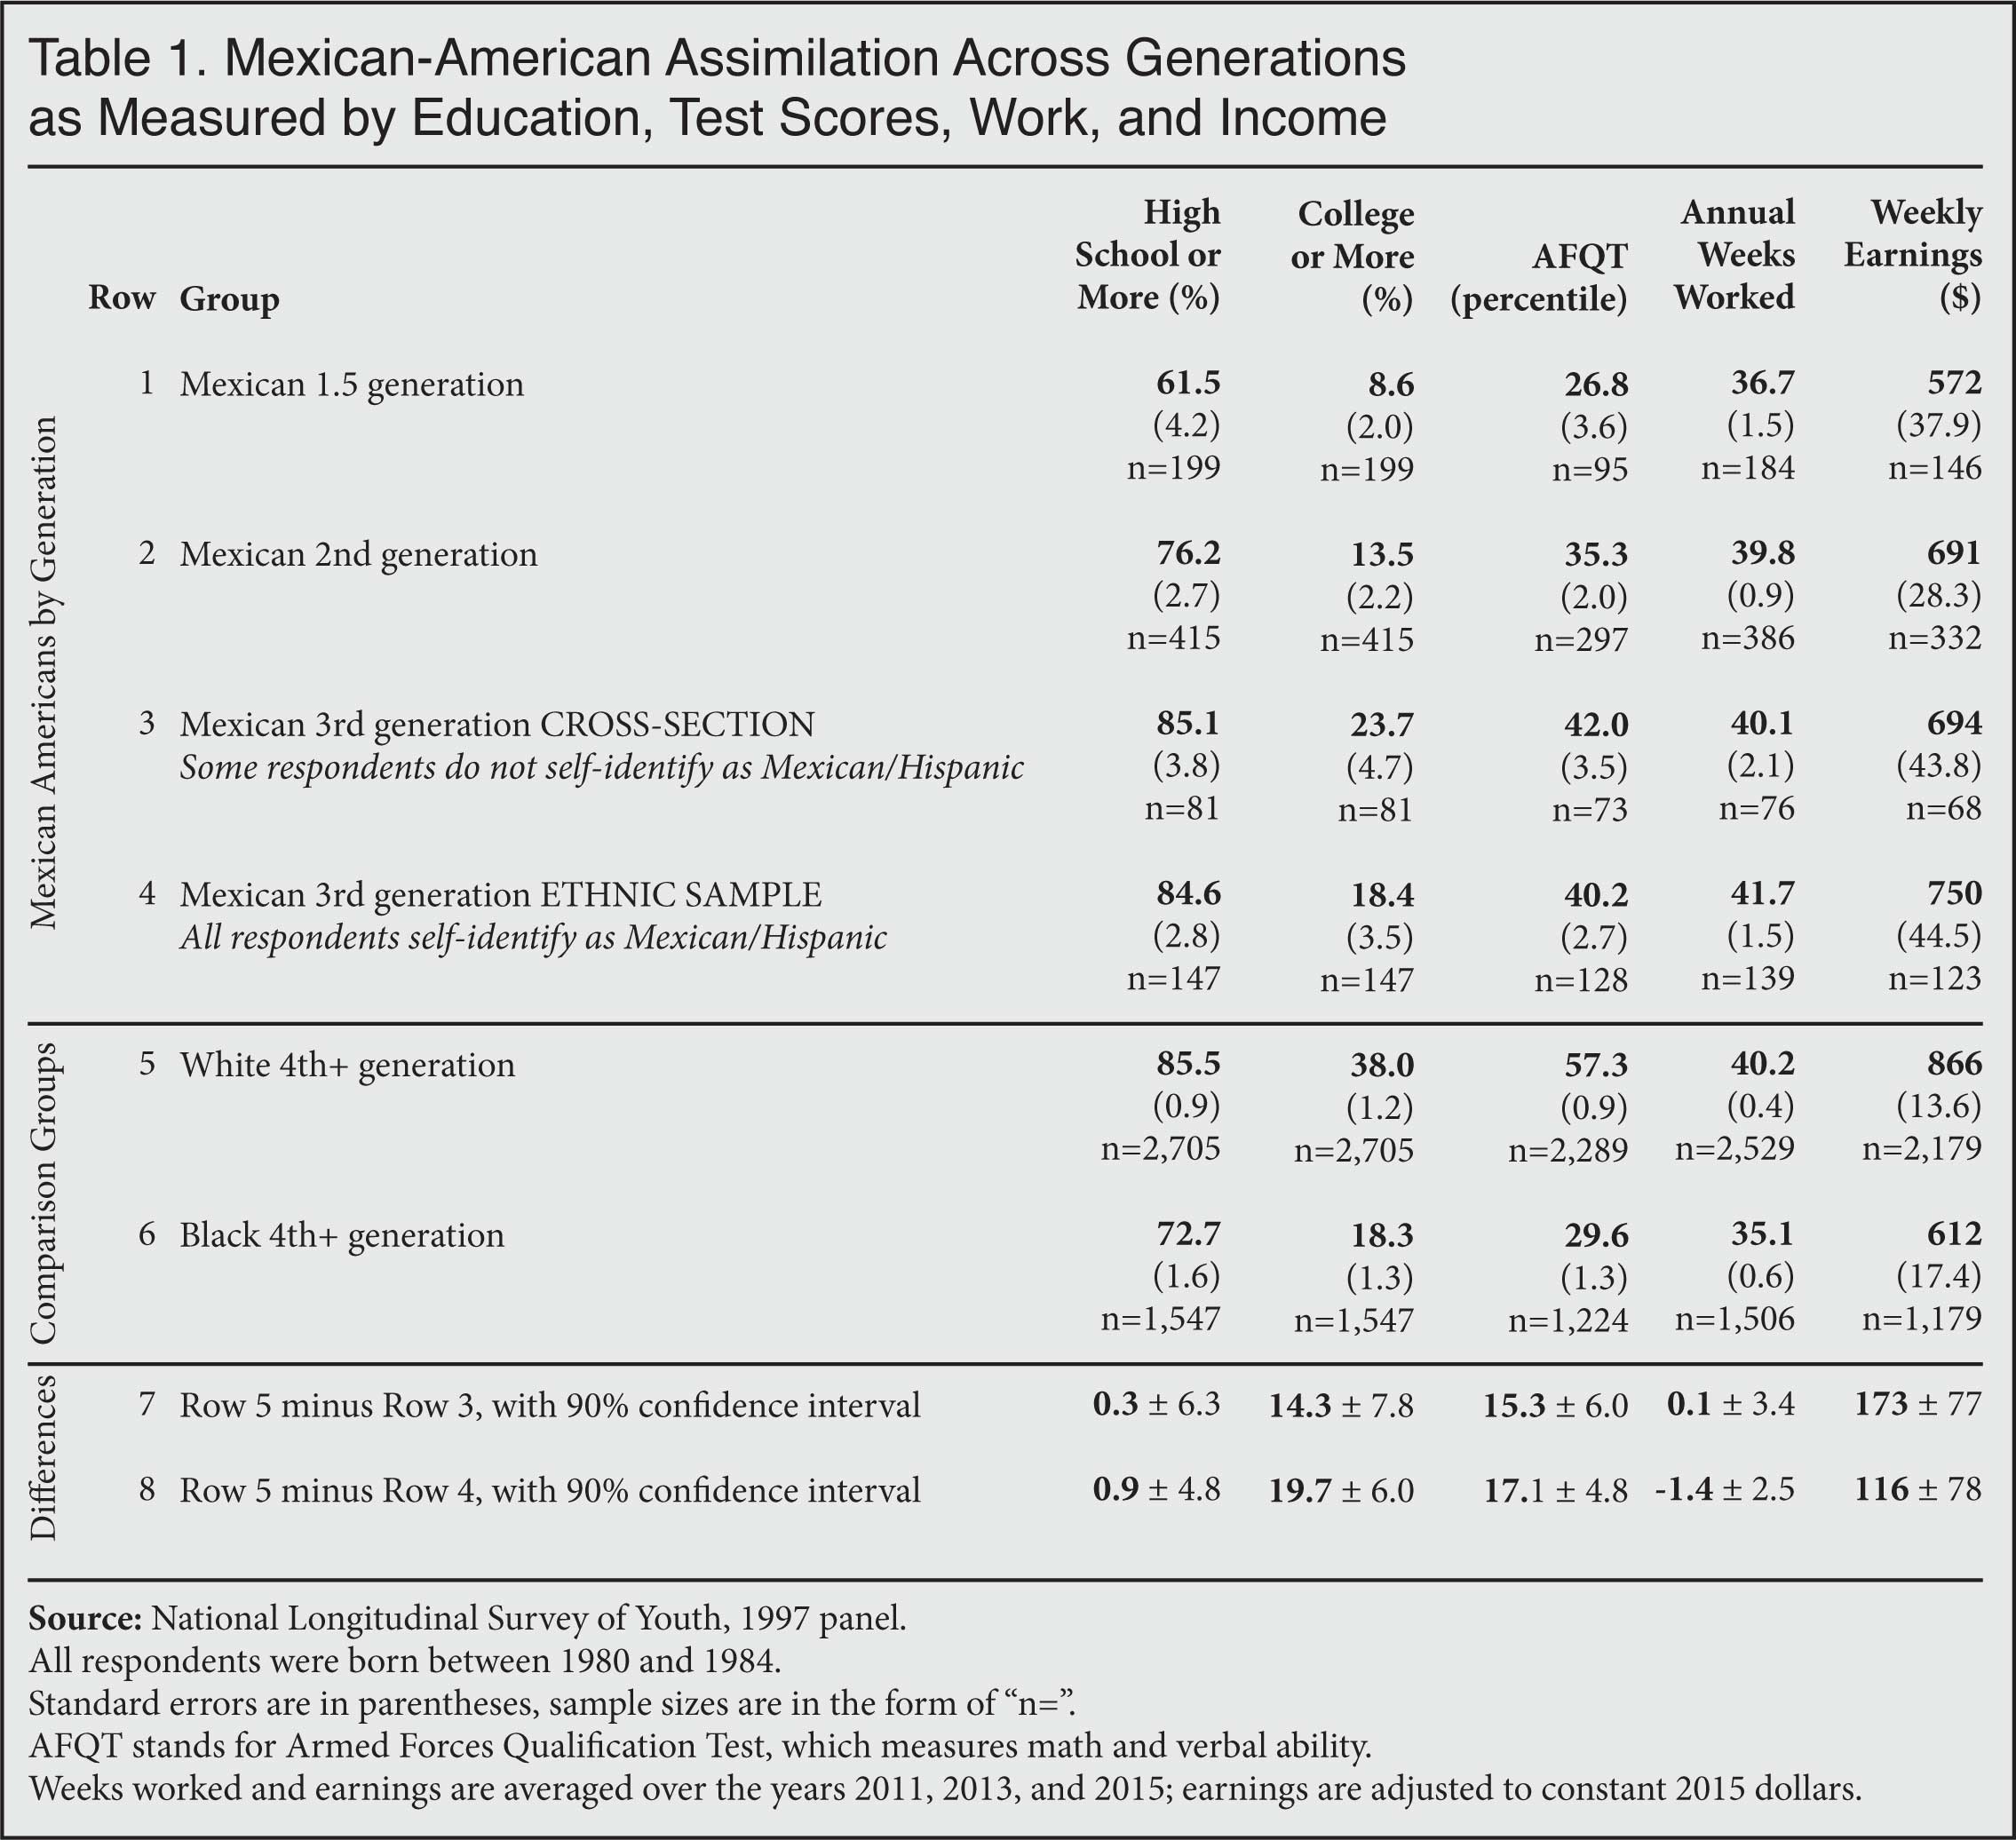 |
In rows 1 to 6, the average value of an outcome measure is displayed at the top of the cell, with the standard error below it in parentheses, and the sample size below that in the form of "n=". For example, third-generation Mexican Americans from the ethnic sample have an average AFQT percentile score of 40.2. The standard error of that average score is 2.7, and the sample size is 128.
Rows 7 and 8 give the differences between the fourth-plus generation whites and the two third-generation Mexican American groups, along with a confidence interval. For example, fourth-plus generation whites score 17.1 AFQT percentile points higher than third-generation Mexican-Americans from the ethnic sample, and the 90 percent confidence interval around that difference extends 4.8 percentile points in either direction — i.e., from 12.3 to 21.9. Because the confidence interval does not contain zero, the difference is statistically significant at the 90 percent level.
Table 1 replicates Duncan et al.'s finding that third-generation Mexican-Americans have essentially the same high school graduation rate as fourth-plus generation white Americans, but their college graduation rate remains well behind. Moving beyond Duncan et al.'s findings, there is a substantial difference in AFQT scores between third-generation Mexican-Americans and fourth-plus generation whites.8 Similarly, although the number of work weeks are about equal, fourth-plus generation whites have greater weekly earnings than third-generation Mexican-Americans. As the confidence intervals in rows 7 and 8 indicate, the white-Mexican differences in college graduation rate, AFQT score, and weekly earnings are all statistically significant, but the exact magnitudes of the differences exhibit a high degree of uncertainty because of the small sample sizes.
None of the differences between the two third-generation Mexican American groups are statistically significant, but they are still worth noting. The cross-section's apparent advantage over the ethnic sample in college graduation is consistent with the expectation that higher-achieving members of the third generation are less likely to identify as Hispanic. The cross-section's advantage in AFQT is less pronounced, however, and the work and income differences appear to go in the wrong direction. More research is needed before drawing strong conclusions about the effect of ethnic attrition. The cross-sectional results do show, however, that ethnic attrition is not somehow concealing the complete assimilation of people with Mexican-born grandparents. Even with a sample that has no ethnic attrition, third-generation deficits remain significant for Mexican Americans.
Limitations and Opportunities for Future Research
The most important limitation of this report is the small number of Mexican third generation respondents, particularly in the cross-sectional sample. Whenever a sample is small, precision suffers. Although this report demonstrates statistically significant education and earnings gaps between the Mexican-American third generation and the non-Hispanic white fourth-plus generation, the confidence intervals are wide.
In addition to improving the precision of the existing estimates, a larger sample would allow for a more fine-grained analysis of the third generation, which in this report is defined as having at least one Mexican-born grandparent. A more restrictive definition — e.g., requiring at least two or three Mexican-born grandparents — would leave the sample too small for meaningful analysis. But just how do education and earnings vary with the number of Mexican-born grandparents? This question is particularly important for assessing how Mexican immigration has affected average skill levels in the United States, since intermarriage could obscure the effects. A finer-grained analysis of the skill gap also may be helpful in exploring various explanations for its persistence, which this report cannot address.
Another limitation of the NLSY-97 is the age range. Although most people in their early 30s have completed their education, they are likely a decade or two away from the peak of their careers. How much third-generation Mexican-Americans will work and earn in their 40s and 50s is still unclear.
Ideally, grandparent birthplaces would be included in a much larger data set than the NLSY-97. Although this may be a pipe dream given the administrative burden, the most logical place to add the grandparent information would be the Current Population Survey. Even if it were added for just a single month in a single year, the research benefits would be immense.
Conclusion
Based on third-generation data constructed without regard to ethnic self-identity, the grandchildren of Mexican Americans improve upon their parents' low average education. However, significant deficits remain. Compared to fourth-plus generation white Americans, third-generation Mexican Americans graduate from college less often, score lower on the AFQT, and earn less income. Though all of these differences are statistically significant, the exact magnitudes are subject to considerable uncertainty due to the small sample size in the NLSY-97. Including grandparent birth data in a larger data set such as the Current Population Survey would facilitate more detailed and precise comparisons. For now, the best available evidence on the grandchildren of Mexican immigrants suggests that low-skill immigrants have long-term impacts, as skill deficits persist at least into the third generation.
End Notes
1 This section borrows some text from Jason Richwine, "Low-Skilled Immigration and the Balkanized Campus", Academic Questions, forthcoming.
2 For a more comprehensive discussion, see Jason Richwine, "The Congealing Pot", National Review, August 24, 2009. Also see Jason Richwine, "Are Low-Skill Immigrants Upwardly Mobile?", Real Clear Policy, August 21, 2015.
3 Brian Duncan, Jeffrey Grogger, Ana Sofia Leon, and Stephen J. Trejo, "New Evidence of Generational Progress for Mexican Americans", NBER Working Paper No. 24067, November 2017. Brian Duncan generously shared his code to allow for exact replication of the Mexican American groups by generation.
4 This grouping is a departure from Duncan et al., who use the full third-generation Mexican sample for their main analysis.
5 The ethnic sample also speaks to a larger sociological question. For people who are worried that Mexican immigration has fostered the growth of an ethnically identified subculture that has persistently struggled in the United States, the ethnic sample is the more relevant category for analysis. See Richwine, "Low-Skilled Immigration and the Balkanized Campus" for more on this point.
6 The weeks worked variable in the NLSY-97 does not include military service, so members of the military are excluded from the two economic outcomes. In addition, respondents must have worked a minimum of 26 weeks and earned a minimum of $1,000 in a given year in order for that year's weekly earnings to be included in their three-year average. Adjustments to these restrictions cause no substantive change in the results.
7 The main reason to weight the full NLSY-97 sample is to adjust for the over-representation of blacks and Hispanics from the oversample. Because all of the estimates in this report are already separated by race or ethnicity, weighting adjusts only for relatively minor issues such as item non-response, and it has little effect on calculated means. Nevertheless, this report takes care to pick an appropriate weight for each estimate:
- Graduation rates: Original 1997 full sample weight
- AFQT: Custom weight to account for non-response within the AFQT year
- Weeks worked: Original 1997 full sample weight
- Weekly earnings: custom weight to account for non-response across the 2011, 2013, and 2015 interviews
Custom weights are calculated using the NLSY tool found here.
For more information on the standard errors, see Steven Pedlow, "Calculating Design-Corrected Standard Errors for the National Longitudinal Survey of Youth, 1997", U.S. Bureau of Labor Statistics, October 1, 2014.
8 The NLSY-97 provides AFQT scores in percentile form, and Table 1 follows suit. For readers who prefer standardized scores, the difference between the white fourth-plus generation and the third-generation Mexican-American cross-section is about 0.48 standard deviations. The gap rises to 0.55 standard deviations when the ethnic sample is substituted for the cross-section.