The recovery from the recession of 2001 has been described as “jobless.” In fact, an analysis of the latest Census Bureau data shows that between March of 2000 and March of 2004, the number of adults working actually increased, but all of the net change went to immigrant workers. The number of adult immigrants (18 years of age and older) holding a job increased by over two million between 2000 and 2004, while the number of adult natives holding a job is nearly half a million fewer. This Backgrounder also finds that the number of adult natives who are unemployed or who have withdrawn from the labor force is dramatically higher in 2004 than it was in 2000. These findings raise the possibility that immigration has adversely Affected the job prospects of native-born Americans.
Among our findings:
- Between March of 2000 and 2004, the number of unemployed adult natives increased by 2.3 million, while the number of employed adult immigrants increased by 2.3 million.
- Half of the 2.3 million increase in immigrant employment since 2000 is estimated to be from illegal immigration.
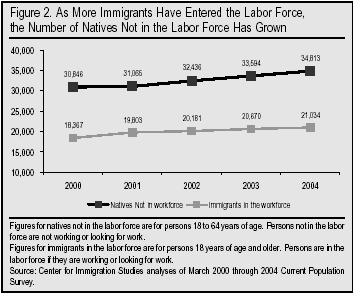
- In addition to a growth in unemployment, the number of working age (18 to 64) natives who left the labor force entirely has increased by four million since 2000.
- Even over the last year the same general pattern holds. Of the 900,000 net increase in jobs between March 2003 and 2004, two-thirds went to immigrant workers, even though they account for only 15 percent of all adult workers.
- In just the last year, 1.2 million working-age natives left the labor force, and say that they are not even trying to find a job.
- Immigrant job gains have occurred throughout the labor market, with more than two-thirds of their employment gains among workers who have at least a high school degree.
- There is little evidence that immigrants take only jobs Americans don’t want. Even those occupations with the highest concentrations of new immigrants still employ millions of native-born workers.
- The decline in native employment was most pronounced in states where immigrants increased their share of workers the most.
- Occupations with the largest immigrant influx tended to have the highest unemployment rates among natives.
- The states with the largest increase in the number of immigrants holding jobs were Texas, North Carolina, Maryland, Georgia, California, Arizona, New Jersey, Virginia, and Pennsylvania.
- Of the nation’s largest metropolitan areas, the biggest increases in immigrant employment were in Los Angeles, Washington, D.C., Dallas, Houston, New York, and Seattle.
- Recent immigration has had no significant impact on the nation’s age structure. If the 6.1 million immigrants (in and out of the labor force) who arrived after 2000 had not come, the average age in America would be virtually unchanged at 36 years.
It would be an oversimplification to assume that each job taken by an immigrant is a job lost by a native. What is clear is that the current economic downturn has been accompanied by record levels of immigration. Given the labor market difficulty of many natives, the dramatic increase in the number of immigrants holding jobs certainly calls into question the wisdom of proposals by both presidential candidates to increase immigration levels further. While the findings of this study may seem stark, they are consistent with other research on this subject.1
Data Source and Methods
Data Source. The information for this Backgrounder comes from March Current Population Surveys (CPS) collected by the Census Bureau. All figures in this study reflect the 2000-based population weights, which were put out by the Census Bureau after the 2000 Census revealed that the nation’s population was larger than previously thought. By using the new weights we are able to make comparisons between the years 2000 and 2004. The March data, called the Annual Social and Economic Supplement, includes an extra-large sample of minorities and is considered one of the best sources for information on the foreign-born.2 The foreign-born are defined as persons living in the United States who were not U.S. citizens at birth.3 For the purposes of this report, foreign-born and immigrant are used synonymously. Because all children born in the United States to the foreign-born are by definition natives, the sole reason for the dramatic increase in the foreign-born population is new immigration. The immigrant population in the 2004 CPS includes roughly 9.1 illegal aliens and between one and two million persons on long-term temporary visas, mainly students and guest workers. The CPS does not include persons in “group quarters,” such as prisons and nursing homes.
Focus on Adult Workers. In this study we examine employment patterns among adult workers 18 years of age and older. Although persons age 15 through 17 often do work, it is adults who comprise the vast majority of full-time workers and almost always are the primary income source for a household. Thus the labor market situation of adult workers is central both to the economy and American families. At various times in the study we do examine labor force participation among workers 18 to 64. When considering labor force participation, it is standard practice to confine the analysis to those under age 64 because the overwhelming majority of Americans retire by age 65. Persons in the labor force are those who are working or unemployed (looking for work). All other individuals are considered to be outside of the labor force.
Overall Employment, 2000 and 2004
Declining Native Employment. Table 1 examines the labor force status of adult natives and immigrant workers in the United States. The top of the table shows that the number of employed natives was 500,000 fewer in 2004 than in 2000. In contrast, there was a net increase of 2.3 million in the number of foreign-born workers holding jobs over this same time period. Put another way, there was a net increase of 1.7 million in the total number of adults working in the United States, but all of that increase went to foreign-born workers. The middle section of Table 1 reports the number of unemployed natives and immigrants. It shows that there were almost 2.3 million more natives unemployed in 2004 than there were in 2000. While it would be a mistake to assume that there is a one-for-one relationship between immigrant employment gains and native losses, it is clear that the number of immigrants with jobs increased dramatically at the same time as the number of natives looking for a job also increased.
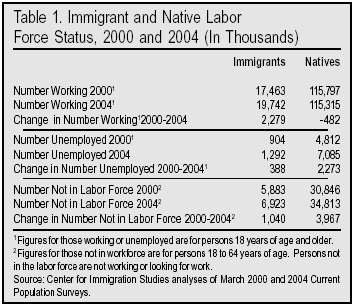
Native Non-Work Increased. The bottom of Table 1 shows the number of working-age (18 to 64) natives and immigrants not in the labor force. Between 2000 and 2004, the number of natives not working increased by nearly four million, from 30.8 million to 34.8 million. Thus, not only are 500,000 fewer natives working and 2.3 million more unemployed, fewer natives are even in the labor force at all. Of course, many adults do not work by choice, but, as we will see, changes in child rearing, pursuit of higher education, or other factors do not seem to explain the increase in the number of natives not in the labor force. It seems almost certain that at least some of the increase is related to economic conditions and perhaps a continued high level of immigration.
Withdrawal from the Labor Market Related to the Economy. The increase in the number of working age (18 to 64) natives not in the labor force could be the result of factors other than the scarcity of employment opportunities. One reason might be an increase in the number of adults staying home to care for a young child. In American society, women are still much more likely than men to take time off from a career in order to care for children. Thus an increase in the number of women not in the labor force might be an indication that the decision not to work is unrelated to the economy. But an analysis of the CPS shows that only half of the four million increase in working-age natives not in the labor force is among women. Moreover, of the two million increase among working-age women not in the labor force, less than 200,000 was due to an increase in the number of women who have a young child under age six. Thus it seems very unlikely that much of the increase in the number of working age natives is related to women taking time out from their careers to care for young children.
Another possible reason for the rise in non-labor force participation could be the growth in the number of working-age college students. In fact, the CPS does show that the number of natives 18 to 64 who were not in the labor force and were attending college increased by 750,000 between 2000 and 2004. Part of this increase reflects a growth in the overall size of the native college-attending population. But some of this increase also reflects a deterioration in the labor market situation for native-born college students. The unemployment rate for college students increased from 5.9 percent to 7.2 percent, and the percentage not in the labor force increased from 40.9 to 43 percent. Had the labor force participation rate remained the same for native-born college students, about 200,000 more native-born college students would have been in the labor force. Thus, we estimate that of the total increase in the number of working-age natives not in labor force, about 14 percent is related to an increase in the number of college students.4
Another possible reason for an increase in the number of natives not working or looking for work is early retirement. However, there is no strong evidence for this. Between 2000 and 2004, the number of natives ages 60 to 64 not in the labor force increased by only 330,000. Of course, retirement is not always voluntary. In fact, unemployment did increase among workers in this age category. But even including all of the 330,000 increase with the increase in college attendance and the increase in the number of mothers saying home, still accounts for, at most, one-fourth of the rise in the number of working age natives not in the labor force. It is almost certain that economic conditions account for the most of the increase in non-labor force participation among natives ages 18 to 64. This is not, of course, proof that immigrants have caused this increase. What we can say is that the number of immigrant workers in the labor force has grown at the same time as the number of working-age natives not in the labor force has increased.
Immigrants Also Affected by Recession. The figures in Table 1 show that immigrants were also adversely impacted by the economic downturn. While Table 1 shows that the number of adult immigrants holding jobs increased dramatically, unemployment and non-work also increased for this population. The rapid growth in the foreign-born population over this time period makes it possible for the number of immigrants holding jobs and the number not working to increase at the same time. The continued growth in the number of immigrant workers also represents a real-world test of the often-made argument that immigration is primarily driven by economic need in the United States. The data show that despite a significant deterioration in unemployment and labor force participation among immigrants, growth in the immigrant population remains at record levels. The overall immigrant population has grown by more than four million since 2000. The fact that immigration has remained so high suggests that immigration levels do not simply reflect demand for labor in this country. Immigration is clearly not a self-regulating phenomenon that will rise and fall with the state of the economy. Immigration is a complex process driven by a variety of factors, and even a significant economic downturn does not result in lower levels of immigration.
Gains Throughout Labor Market
Contrary to the perceptions of some, most of the net increase in immigrant employment was not at the very bottom of the labor market. Table 2 reports the number of persons holding jobs by education level. The table shows that less than 700,000 (only 30 percent) of the net increase in adult immigrant employment was among workers with less than a high school degree. About 20 percent of the net increase in immigrant employment was for those with just a high school degree, and 50 percent of the growth was for those who had an education beyond high school. With half of the net increase in immigrant employment among workers with an education beyond high school, the argument that “immigrants only take jobs Americans don’t want” would seem to be incorrect. Immigrants are not simply taking jobs that require little education, pay relatively little, and are menial in nature. While it is true that a much larger share of immigrant than native workers have few years of schooling, immigration is increasing the supply of workers throughout the labor force.
Native-Born Dropouts. Turning first to native dropouts, Table 2 shows that the number holding a job declined by 1.4 million. Table 3 reports unemployment rates by education level. It shows that some of this decline is explained by an increase of 217,000 in unemployment among native dropouts. The decline in the number of native dropouts also seems to be related to the retirement of older natives with few years of education. Table 4 reports the number of working-age (18 to 64) people not in the labor force by education level. The table shows that the number of native dropouts not in the labor force went down slightly between 2000 and 2003, indicating that there was not an increase in non-work for this type of worker. Because American society has become more educated in recent decades, there has been a decline in the number of natives lacking a high school degree. Many older native-born dropouts are retiring. On the other hand, the unemployment rate of 13.3 percent and rate of non-work for native-born dropouts is dramatically higher than for other workers. By significantly increasing the supply of unskilled workers during the recession, immigration may be making it more difficult for these workers to improve their situation. While it might be reasonable to describe these jobs as ones that most American don’t want, clearly there are still millions of unskilled Americans in the labor force. Given the persistently high unemployment rate and low rates of labor force participation among this population, it may make little sense to continually increase the supply of unskilled workers through immigration, especially during a economic downturn.
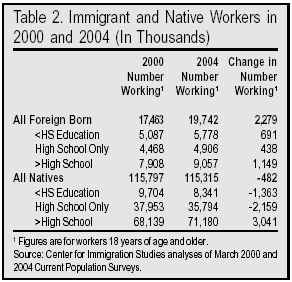
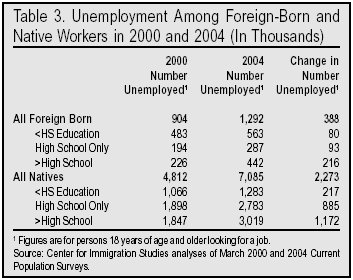
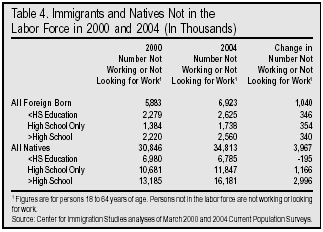
Natives With Only a High School Degree. Table 2 shows that the number of natives with only a high school degree holding a job in 2004 was 2.2 million fewer than in 2000. Moreover, in Table 3 we see that the number of natives with only a high school degree who were unemployed was 885,000 higher. In addition, Table 4 shows that the number of natives with only a high school degree not in the labor force was nearly 1.2 million higher. During the same time period, the number of immigrants with the same level of education holding a job increased by 438,000 (Table 2). There were also nearly 300,000 unemployed immigrants in 2004 in this educational category, an increase of about 100,000 from 2000 (Table 3). There is no question that immigration has increased the supply of this type of worker at the same time natives with only a high school degree have lost jobs.
More Educated Natives. Turning to natives with more than a high school degree, Table 2 shows that the number of workers like this actually increased by about three million over this time period. However, Table 3 indicates that the number of unemployed workers with more than a high school degree increased by almost 1.2 million. It should be pointed out that educated workers tend to be more reluctant to describe themselves as unemployed than those with less education. Thus, when examining the economic situation for this group, it is especially important to consider the labor force participation. Table 4 shows that the number of more educated natives not in the labor force increased by three million (23 percent) between 2000 and 2004. Over the same time period, the number of immigrants with more than a high school degree holding a job increased by 1.2 million, and the number looking for a job (unemployed) roughly doubled to 442,000. Thus, immigration is clearly increasing the supply of more educated workers at the same time as unemployment and withdrawal from the labor market remain high among such workers. It is also worth considering that jobs requiring an education beyond high school are typically higher paying, and certainly are not seen as jobs Americans don’t want. Overall, Tables 2 through 4 seem to indicate that immigrants and natives are competing for work throughout the labor market.
Immigrant-Heavy Occupations. The impact of immigration can also be examined by looking at occupations. Unfortunately, it is not easy to examine changes in the number of immigrants by occupation because the way the government classifies occupation changed between 2000 and 2004. However, Table 5 reports the occupational distribution of immigrant and native workers in 2004. Looking at occupations can provide some insight into what sectors of the economy are most impacted by immigration. The first column reports the percentage of adult immigrants employed in each occupation. For example, 2 percent of immigrants are employed in the farming, fishing, and forestry occupational category. The second column reports the share of all workers in that occupation that are immigrants. Thus, immigrants comprise 36 percent of adult workers in the farming/fishing/forestry occupation. The third column shows the number of adult natives employed in each occupation. The fourth column shows the number of unemployed natives who indicated that their last job was in each occupation. The fifth column shows the number of immigrants who arrived between 2000 and 2004 who are employed in that occupation. The last column shows the native unemployment rate.5
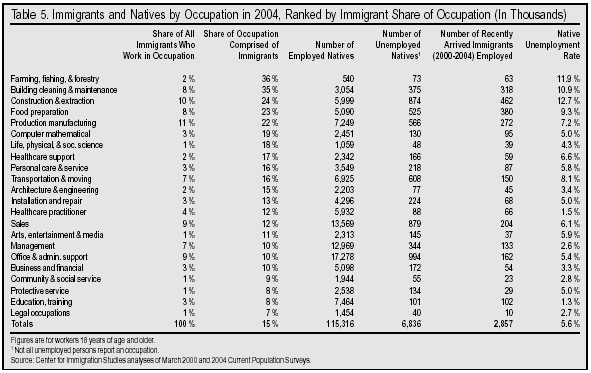
Table 5 ranks occupations based on the percentage comprised of immigrants. It is often suggested that the kinds of jobs immigrants do are so different from what natives do that the two groups seldom, if ever, compete. But Table 5 shows that, at least when looked at by occupation, this does not appear to be the case. Clearly there are jobs where immigrants make up a large share of workers, but there are still millions of natives employed in those same occupations. In the first five occupations listed in the table, immigrants comprise 20 percent or more of all workers. But there are still 21.9 million adult natives employed in these occupational categories. In fact, the vast majority of workers in these heavily immigrant occupations are natives. In the six occupations where immigrants comprise 15 to 19 percent of all workers, we again see that there are 18.5 million adult natives employed in these occupations. If we focus just on the four occupations with the largest number of newly arrived immigrants (construction, food preparation, cleaning and maintenance, and production workers) we again find that there are 21.4 million natives employed in these occupations. In these four occupations there were 1.4 million newly arrived immigrants, and there were more than two million unemployed natives. This does not mean that immigrants caused the unemployment of natives, though that is a possibility. But it does mean that the idea that there are no American workers available to fill these lower-skilled jobs is not supported by available data.
It is possible that the occupational categories are so highly aggregated in Table 5 that they obscure large differences between immigrants and natives. But it must be remembered that there are 48 million natives in the labor force who have only a high school degree or less. Most of these workers do jobs that require only a modest level of training. Moreover, Table 5 makes clear that, although they are concentrated in more menial jobs, immigrants are employed throughout the labor market.
New Immigration Explains Growth
Tables 1 through 4 deal with the net change in immigrant and native employment between 2000 and 2004. But they do not indicate when the immigrant workers arrived in the United States. In contrast, the fifth column in Table 5 reports the number of immigrants holding a job who arrived between 2000 and 2004. While it is possible that the growth in adult immigrant employment in the last four years is the result of immigrants aging into the labor force or adult immigrants already here in 2000 entering the labor market, this is not the case. Table 5 shows that there were 2.9 million immigrants in 2004 who said that they arrived in 2000 or later. We know this because the CPS asks immigrants what year they came to stay in the United States. The net increase in the number of immigrants holding jobs was 2.3 million. Therefore, all of the net growth in immigrant employment is due to new immigrants arriving from aboard. It should be noted that the reason the number of adult immigrant workers did not grow by 2.9 million is that some immigrants here in 2000 had died, gone home, or left the labor force by 2004. Thus 2.3 million represents the net increase in immigrant employment.
Immigrants and the Aging of Society
Impact of Post-2000 Immigrants. A common defense of the record level of immigration in recent years is that the aging of American society means that the nation needs working-age immigrants to replace retirees. The CPS can be used to test this hypothesis. One simple way to measure the impact of immigration is to calculate the average age in the United States with and without recent immigrants. As already discussed, the CPS asks immigrants what year they came to America. If the 6.1 million immigrants (in and out of the labor force) who arrived after 2000 had not come, analysis of the CPS shows that the average age in America would have been 36 years two months, instead of 36 years when recent immigrants are included. It would be hard to argue that this is meaningful difference, so we certainly could have done without the 6.1 million immigrants, including 2.9 million workers, who arrived during the current economic downturn without any fear that it would have caused American society to age more rapidly.
Impact of Post-1990 Immigrants. Even a longer perspective still shows that immigration has had little impact on the average age. If we exclude the 18 million immigrants who arrived in 1990 or later from the 2004 data, the average age in the United States would be 36 years and four months, compared again to 36 years with the immigrants.6 While many non-demographers may imagine that immigration has a large impact on the age structure in America, the impact is actually very small. A 2000 Census Bureau report that examined population trends in the coming century concluded that immigration is a “highly inefficient” means of increasing the share of the population that is of working age in the long run. It must be remembered that immigrants age just like anyone else and not all immigrants arrive in their primary working years. In fact, the average age of immigrants in 2004 is almost 40 years, more than the 35 and one-half years for natives. Also, the United States has a large existing population, so it would take a truly enormous number of immigrants, many times the current level, to have a large impact on the nation’s age structure.7 In general, immigration makes the United States population larger and the country more densely settled, but it does not fundamentally change the age distribution.
Employment Trends
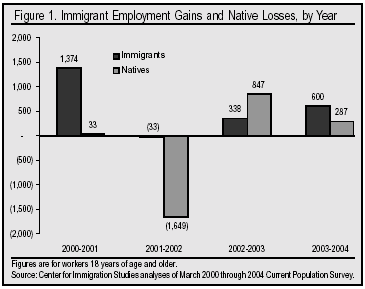
Change in the Years Between 2000 and 2004. Tables 1 through 4 show a snapshot of employment for 2000 and 2004. They do not show what happened in the years between 2000 and 2004. Figure 1 reports changes in the number of natives and immigrants holding jobs in the intervening years. The figure shows that all of the job losses for adult natives were between 2001 and 2002, when adult natives lost 1.7 million jobs. However, the job gains natives have made since then have not made up for that loss. In fact, the pace of native job gains seems to have slowed, while the job gains for natives have increased. The number of employed adult natives increased by almost 850,000 between 2002 and 2003, but between 2003 and 2004 the number increased by less than 300,000. In fact, in the last year gains by adult immigrants were twice that of natives. This is striking because immigrants account for only 15 percent of all adult workers, yet two-thirds of employment gains went to immigrants over the last year. Figure 1 makes clear that in every year since 2000, the number of immigrants working has held roughly constant or increased substantially. Even though there was a large downturn in native employment between 2001 and 2002, the number of immigrants holding jobs did not decline significantly.
Non-Work Among Natives Continues to Increase. Figure 2 shows the number of natives of working age (18 to 64) not in the labor force, and the number of immigrants who are in the labor force. Unlike the number of jobs being held by natives shown in Figure 1, which at least shows positive growth in recent years, Figure 2 shows that the number of natives not in the labor force has increased every year. Figure 2 indicates that, between 2000 and 2001 the number of working-age natives not in the labor force increased by over 200,000; between 2001 and 2002 it increased 1.4 million; between 2002 and 2003 it grew by 1.2 million; and in the most recent year it increased by another 1.2 million. Of course, during this same time period the number of immigrants in the labor force increased by a total of 2.7 million. (Persons are considered to be in the labor force if they are working or unemployed–that is, they are looking for work.) It is very possible that by dramatically increasing the supply of labor, immigration may be contributing to the number of native-born workers who are discouraged from looking for work.
Illegal Immigration Accounts for Half of Increase in Immigrant Employment
Illegals in the CPS. It is well established that illegal aliens do respond to government surveys such as the decennial census and the Current Population Survey. While the CPS does not ask the foreign-born if they are legal residents of the United States, the Urban Institute, the former INS, and the Census Bureau have all used socio-demographic characteristics in the data to estimate the size of the illegal population.8 Our preliminary estimates for the March 2004 CPS indicate that there were slightly over 9.1 million illegal aliens in the survey. It must be remembered that this estimate only includes illegal aliens captured by the March CPS, not those missed by the survey. By design this estimate is very similar to those prepared by the Census Bureau, the former INS and the Urban Institute.9 Although it should be obvious that there is no definitive means of determining whether a respondent in the survey is an illegal alien, this estimate is consistent with previous research. We estimate that in 2000, based on the March CPS from that year, that there were between 4.2 and 4.4 million adult illegal aliens employed in the United States and that this number had grown to between 5.4 to 5.6 million in the March 2004 CPS. This means that about half of the 2.3 million increase in the number of adult immigrants working in the United States was due to illegal immigration.
Why Illegals Are Such a Large Share of Growth. The fact that illegals account for half of the overall growth in adult immigrant employment may surprise some, especially since illegal aliens account for only one-fourth of the total foreign-born population. However it must be remembered that research on illegal aliens has shown that they are overwhelmingly of working age. Relatively few illegals come prior to age 18 or after age 50. Since their primary motive for coming is work, it should also not be surprising that our estimates, and other research, find illegals have a relatively high labor force participation rate. This means that illegals make up a much larger share of both adults in general and adult immigrant workers in particular than they do the overall population. As a consequence, they also account for a large percentage of the increase in immigrant employment. Another way to understand why illegal immigration must account for such a large share of the employment growth among immigrants is to focus on the Mexican immigrant population. Mexican immigrants are thought to comprise 60 to 70 percent of the illegal alien population. Research by the Urban Institute has shown that some 80 percent of recently arrived Mexican are illegal aliens. In 2004, there were 2.2 million Mexican immigrants in the CPS who indicated that they arrived in 2000 or later. (This includes those in and out of the labor force.) It is virtually certain that at least 1.7 to 1.8 million of these individuals are illegal aliens. Just looking at the scale of Mexican immigration makes it clear that illegals comprise a very large share of the net increase in the overall immigrant population and in the number of immigrants holding jobs.
Natives Did Better in Areas with Low Immigrant Growth
Top Immigrant-Receiving States. So far in this Backgrounder we have considered immigration’s impact at only the national level. Table 6 reports employment figures for states with the largest numbers of immigrant workers. The table shows that, for the most part in these top immigrant states, it was immigrants who took most of the new jobs where there was a net increase in employment. In Texas, New Jersey, Arizona, Maryland, Virginia, North Carolina, and Georgia all or almost all of the net increase in jobs went to immigrants. And in California, half of the new jobs went to immigrants. In Illinois, natives lost a large number of jobs, while immigrants made very modest gains. Overall the figures for these states tend to support the idea that immigrant job gains come, at least to some extent, at the expense of natives.
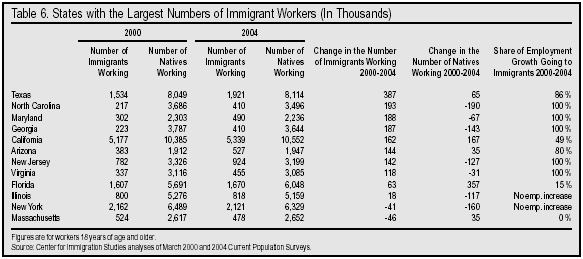
While in most of the states in Table 6 immigrant employment gains were accompanied by native employment losses, a somewhat different pattern exists in New York, Florida, and Massachusetts. In New York, the number of adult immigrants and natives working both declined. In Massachusetts, it was natives who gained jobs, while the number of immigrants working actually declined. The results for Massachusetts would also tend to support the idea that in order for natives to make employment gains, immigration has to be low. The figure for Florida also buttresses this argument. In Florida, immigrant employment growth was very modest, while native gains were significant. Overall the numbers in Table 6 show that in most of the top-immigrant receiving states, immigrants gained jobs while natives lost jobs. But in those states where immigrant employment gains were the smallest or non-existent, natives tended to do better, thought not in every case. What we don’t see in the Table 6 is any state were both groups gained substantial numbers of jobs. Such a situation would tend to undermine the idea that immigrants harm natives. However, it must be pointed out that job losses for both immigrants and natives in states like New York make clear that factors other than immigration impact native employment. Immigration is only one of many factors that can have an impact on labor market outcomes for natives.
States with the Largest Immigrant Employment Gains. Some of the states that saw the largest numerical increase in immigrant employment are not among the states with the largest existing immigrant populations. This situation exists because for some time now immigrants have been spreading out into parts of the country that previously saw little immigration. Thus there are many states with smaller immigrant populations that experienced rapid growth between 2000 and 2004. Table 7 ranks the 10 states with the largest numerical increase in immigrant workers between 2000 and 2004. They are also states where the number of immigrant workers increased by 100,000 or more. In contrast to Table 6, New York, Massachusetts, Illinois, and Florida are not included, while Pennsylvania and Ohio join the list. The total net change in adult native employment in the 10 states in the table was -336,000, while immigrants gained 1.7 million jobs. It should be remembered that nationally the number of adult natives working decreased by a total of 481,000. Thus net job loss in these 10 states was equal to 76 percent of the total native job loss nationally. While many factors impact employment, there is no question that these 10 states account for almost all of the net increase in immigrant employment. It should also be pointed out that with the possible exception of Ohio, there does not seem to be any state where immigrant employment and native employment both rose significantly. This shows that immigrant gains may tend to come at the expense of natives.
(click on table for a larger version)
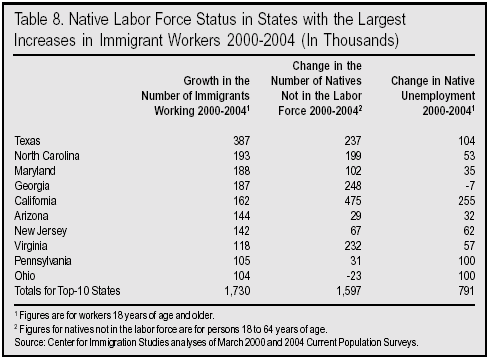
Table 8 examines labor force participation and unemployment among natives in the same top-10 states with the largest numerical increases in immigrant workers. Again, we see that native unemployment or non-work rose in every one of these states. In fact, with the exception of Georgia and Ohio, unemployment and non-work together grew in every state. In Georgia, while the number not in the labor force held constant, unemployment grew significantly. Ohio may be the one exception, but even its unemployment increased by 100,000, while non-work held steady. While certainly not conclusive proof that immigration has adversely impacted native-born workers, the results in Table 8 are consistent with the possibility that immigration may have an adverse impact on native employment during the current economic downturn.
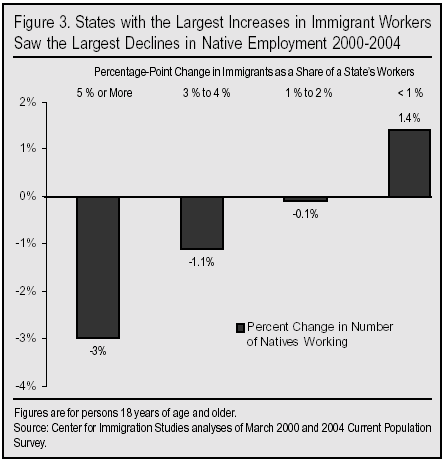
All States. By examining states with a large or rapidly growing immigrant populations, Tables 6, 7, and 8 provide some insight into the effect of immigration. In order to look for a relationship between immigration and native employment, Figure 3 analyzes every state, not just those with large or rapidly increasing immigrant populations. Figure 3 reports the proportional relationship between immigrant and native employment using data from every state. The horizontal axis shows the increase in immigrant employment and the vertical axis reports the change in state employment for adult natives. Figure 3 reads as follows: in states where immigrants increased their share of workers by five percentage points or more, the number of native workers fell by about three percent on average. In states where immigrants increased their share of workers by three to four percentage points, the number of natives holding jobs declined by 1.1 percent. In states where immigrants increased their share of workers one to two percentage points, native employment fell by one-tenth of 1 percent. Finally, in states where the immigrant share of workers increased by less than one percentage point or actually fell, the number of adult natives holding a job increased by 1.4 percentage points.10 It should be noted that each state in this analysis was treated as just one case, so a large state like California did not unduly influence the results. Like Tables 5, 6, and 7, the results in Figure 3 are what we would expect to find if immigration harmed job opportunities for natives. However, the results from the state tables and Figure 3 should be interpreted with caution.
It must be pointed out that states are not necessarily discrete labor markets. Moreover, many factors have an impact on employment, not just immigration. Thus, the results do not prove that immigration has adversely impacted natives. But the findings in the state tables and Figure 3 do add support to the idea that immigration has adversely impacted native-born workers. However, more research and analysis is clearly necessary to confirm these results and to arrive at a more definitive conclusion about the relationship between immigrant and native employment.
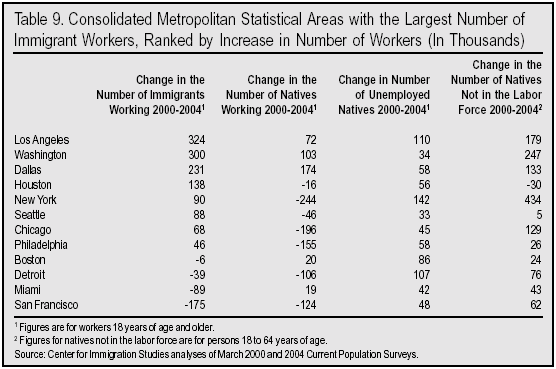
Metropolitan Areas. Table 9 lists the Consolidated Metropolitan Statistical Areas (CMSA) with the largest number of immigrant workers, ranked by the numerical increase in immigrant workers. The results tend to buttress the findings in Table 8, but with some differences. We do find that in Los Angeles, Washington-Baltimore, and Dallas, both immigrants and natives gained jobs, though the immigrant gains were larger than those of natives. But even in these three CMSAs, the number of unemployed natives rose significantly. Moreover, all of these areas show a very substantial increase in the number of working-age natives who are not in the labor force. Thus in each of these cities, it would be incorrect to say that natives did very well even though the number holding jobs did increase. In the Houston, New York, Seattle, Chicago, and Philadelphia CMSAs, the number of immigrants working increased and the number of natives holding jobs decreased. Moreover, unemployment and the number of natives not in the labor force increased in all of these areas, with the exception of Houston, where the number of natives not in the labor force fell. In the other cities, we see a general deterioration in employment for both immigrants and natives, indicating again that factors other than immigration have an impact on native employment.
Conclusion
The time period from 2000 to 2004 has been difficult for many American workers. This Backgrounder shows that all of the employment losses during this time period have been absorbed by native-born Americans. The number of natives holding jobs in March of 2004 was half a million lower than in March of 2000 and the number unemployed was 2.3 million higher. Over the same time period, the number of immigrants holding jobs in the United States increased by 2.3 million. About half of the increase in immigrant employment is due to the growth of the illegal alien population. We find little evidence for the argument that immigrants only take jobs natives don’t want. Immigrant employment gains have occurred throughout the labor market, with half of the increase among workers with education beyond high school. Moreover, looking at occupations shows that there are million of natives employed in occupations that saw the largest influx of new immigrants.
We find some direct evidence that immigration has adversely impacted natives. Areas of the country with the largest increase in immigrant workers were, in many cases, areas that saw the most significant job losses for natives. Immigrant occupations with the largest immigrant influx tended to have the highest unemployment rates among natives. This certainly raises the very real possibility that immigration has adversely affected native employment. Unfortunately, both presidential candidates have chosen to largely ignore this issue. To the extent they have addressed the question, both have advocated legalizing illegal aliens and increasing legal immigration still further. While it would be a mistake to assume that every job taken by an immigrant represents a job lost by natives, the findings of this study call into the question the wisdom of allowing immigration to remain at record levels during the current economic downturn or proposals to increase immigration further.
(Click on table for a larger version)
Endnotes
1 See, for example, a report by Andrew Sum and his colleagues at Northeastern University, which can be found at www.nupr.neu.edu/7-04/immigrant_04.pdf
2 The survey is considered such an accurate source of information on the foreign-born because, unlike the decennial census, each household in the CPS receives an in-person interview from a Census Bureau employee. The 213,000 persons in the Survey, almost 24,000 of whom are foreign born, are weighted to reflect the actual size of the total U.S. population. However, it must be remembered that some percentage of the foreign born (especially illegal aliens) are missed by government surveys of this kind, thus the actual size of this population is almost certainly larger. Of course this was also true in past years.
3 This includes naturalized American citizens, legal permanent residents (green card holders), illegal aliens, and people on long-term temporary visas such as students or guest workers, but not those born abroad of American parents or those born in outlying territories of the United States such as Puerto Rico.
4 If the share of native-born college students not in the labor force remained at 40.9 percent, the overall growth in the number of native college students would still have caused an increase of about 550,000 in the number of college students not in the labor force. This means that about 14 percent of the four million increase in the number of working-age natives not in the labor force was due to the overall growth in the number of natives attending college. But even if all of the 750,000 increase in the number of college student not in the labor force was unrelated to the economy it would still only explain 19 percent of the increase in non-labor force participation among natives.
5 It should be noted that some unemployed people do not report an occupation.
6 A more detailed analysis would include the children born in the United States to recent immigrants. For immigrants who arrived since 2000, the number of U.S.-born children is very small because the vast majority of these immigrants have not yet had time to have any U.S.-born children. However, a large number of children have been born to post-1990 immigrants. The presence of these children does increase the impact of post-1990 immigrants, but only a little. There simply are not enough of these children. Moreover, these children have added to the population not in the labor force who need to be supported by others. Demographers refer to this as the dependency ratio, which is the number of people age 16 to 64 compared to the rest of the population. They use this age range because individuals 16 to 64 are people who could be in the labor force. If we include all post-1990 immigrants and their U.S.-born children, we find that immigration actually has had no impact on the dependency ratio because all of the U.S-born children of post-1990 immigrants are too young to work.
7 It should be pointed out that the primary reason that the United States, unlike Europe, does not face population decline is the higher fertility of natives in this country.
8 To determine which immigrants are legal and illegal in the survey, we use citizenship status, year of arrival in the United States, age, country of birth, educational attainment, sex, receipt of welfare programs, receipt of Social Security, veteran status, and marital status. We use these variables to assign probabilities to each respondent. Those individuals who have a cumulative probability of 1 or higher are assumed to be illegal aliens. The probabilities are assigned so that both the total number of illegal aliens and the characteristics of the illegal population closely match other research in the field, particularly the estimates developed by the Urban Institute. This method is based on some very well established facts about the characteristics of the illegal population. For example, it is well known that illegals are disproportionately male, unmarried, under age 40, have few years of schooling, etc. Thus we assign probabilities to these and other factors in order to select the likely illegal population. In some cases we assume that there is no probability that an individual is an illegal alien.
9 The INS report estimating seven million illegals in 2000 with an annual increase of about 500,000 can be found at www.immigration.gov/graphics/aboutus/statistics/Ill_Report_1211.pdf The Census Bureau report estimating eight million illegals in 2000 can be found at www.census.gov/dmd/www/ReportRec2.htm (Appendix A of Report 1 contains the estimates). The Urban Institute is the only organization to release figures for the size of the illegal population based on the CPS. Urban estimates that in March of 2002, 8.3 million illegal aliens were counted in the CPS, with an additional one million being missed. Assuming continual growth in the CPS, there were between 8.6 and 8.8 million illegals in the March 2003 CPS and between nine and 9.2 million in the 2004 CPS. Urban’s estimates based on the March 2002 CPS can be found at http://www.urban.org/url.cfm?ID=1000587 Additional information was provided by Jeffery Passel of the Urban Institute in a May 24th, 2004, telephone interview.
10 A percentage-point change is calculated as follows: if adult immigrant workers comprised 5 percent of all workers in 2000 and that increased to 10 percent of workers in 2004, then in that state there was a five percentage-point increase. Using a percentage-point increase allows for a much more reasonable estimate of the impact of immigration and prevents any overstatement of the impact of immigration. If, for example, we used percentage increase, then a state with a very small immigrant population in 2000 might see that population double or triple in size, but immigrants might still remain a very small share of all workers. In such a situation immigration would have a very small impact on the labor market, even though the percent increase was very large. Using percentage-point increases avoids this problem.
Steven A. Camarota is the Director of Research at the Center for Immigration Studies.
