Download a PDF of this Backgrounder.
Steven A. Camarota is the director of research at the Center for Immigration Studies.

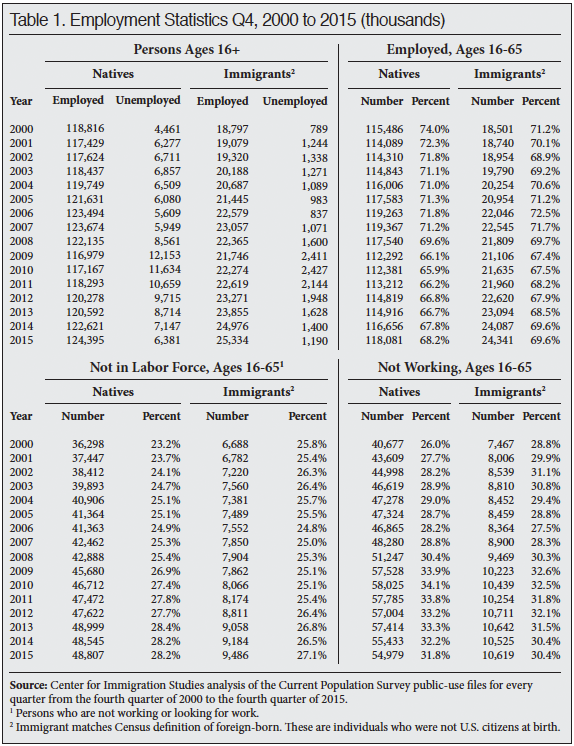
The number and percentage of native-born Americans officially unemployed have improved. But the unemployment rate only includes those who have looked for a job in the last four weeks. The number of native-born Americans not in the labor force (not working or looking for work) did not improve at all in the last year. Moreover, there were still 1.3 million fewer working-age (16 to 65) natives holding a job in the fourth quarter of 2015 than in the same quarter of 2007. In contrast, over the same time period the number of immigrants working is up by 1.8 million.
- The unemployment rate for natives in the fourth quarter of 2015 was 4.9 percent (6.4 million). Despite recent improvements, this is higher than the 4.6 percent rate in the fourth quarter of 2007 and the 3.6 percent rate in the fourth quarter of 2000.1
- In addition to the unemployed, 28.2 percent (48.8 million) of working-age (16 to 65) natives were not in the labor force, which means they were not working or looking for work. This is much higher than the 25.3 percent rate (42.5 million) in the same quarter of 2007 and the 23.2 percent rate (36.3 million) in 2000.
- Combining those not in the labor force and those unemployed shows 55.2 million working-age, native-born Americans without jobs in the fourth quarter of 2015, compared to 40.8 million in same quarter of 2000.2
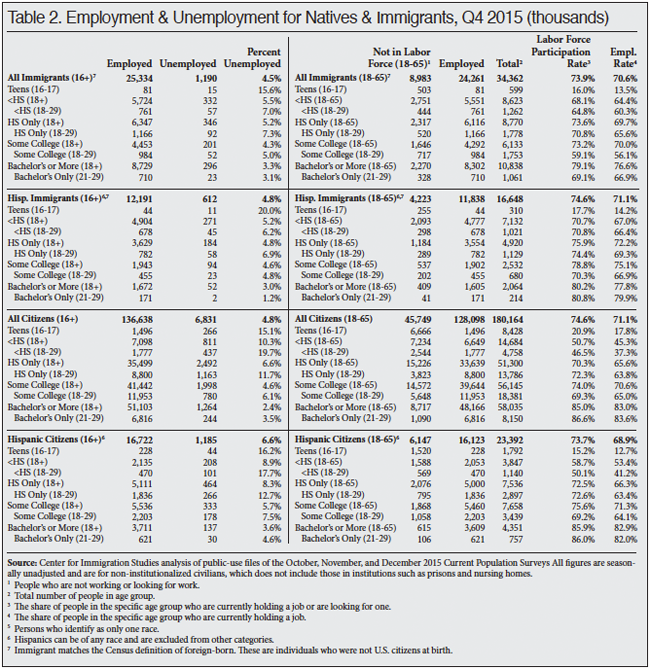
- There were also 10.7 million working-age immigrants unemployed or not in the labor force in the fourth quarter of 2015.3
- In addition to those unemployed and not in the labor force, there were 5.9 million immigrants and natives working part-time, but looking for full-time work.
- In total, there were 71.8 million natives and immigrants unemployed, not in the labor force (16 to 65), or forced to work part-time in the fourth quarter of 2015.4
The key policy question facing the country with regard to immigration is: Does it make sense to continue to admit a million new permanent immigrants each year, along with several hundred thousand guestworkers, given the enormous pool of working-age people not working?
Data and Methods
The two primary employment surveys collected by the U. S. government are referred to as the “household survey” (also called the Current Population Survey or CPS) and the “establishment survey” (also called the Current Employment Statistics survey or CES). The establishment survey asks employers about the number of workers they have. In contrast, the CPS asks people at their place of residence if they are working. Both surveys are collected by the Census Bureau for the Bureau of Labor Statistics (BLS). While the two surveys show the same general trends, the figures from the two surveys differ to some extent.
Because it asks workers about their employment situation, only the CPS provides information about who is working, who is looking for work, and who is not working or looking for work. Moreover, only the CPS asks respondents about their socio-demographic characteristics such as education, age, and country of birth. Thus, only the CPS can be used to compare employment among immigrants and the native-born.5 For these reasons, this analysis uses the public-use files of the CPS to examine employment in the United States by quarter. (For each quarter, the three CPS surveys combined include roughly 350,000 natives and 43,000 immigrants. The survey is then weighted to reflect the actual size of the U.S. population.)
The data for the tables in this report comes from the public-use files of the October, November, and December CPSs for 2000, 2007, and 2015. The tables presented here are reported by quarter. Quarterly data are more statistically robust, especially for smaller populations like immigrants and minorities, due to the inclusion of three months of data. Persons in institutions like prisons or nursing homes are not included in the CPS. The CPS is the nation’s primary source for unemployment and other labor force statistics. Like all government surveys, the data are weighted to reflect the actual size and demographic makeup of the U.S. population.
The government publishes employment statistics that are both seasonally adjusted and unadjusted from the survey. The figures in this analysis are seasonally unadjusted. Unadjusted figures are computationally simpler and easier for other researchers to replicate. In general, BLS does not provide separate estimates for the foreign-born (immigrants) and the U.S.-born broken down by characteristics like education, race, and age. However, all CPS respondents are asked these questions. The Census Bureau defines the foreign-born as persons who are not U.S. citizens at birth, which includes naturalized citizens, legal immigrants who are not citizens (green card holders), temporary visitors and workers, and illegal immigrants. All figures for the total U.S. population in this report match seasonally unadjusted figures from the BLS.
Defining Labor Force Attachment
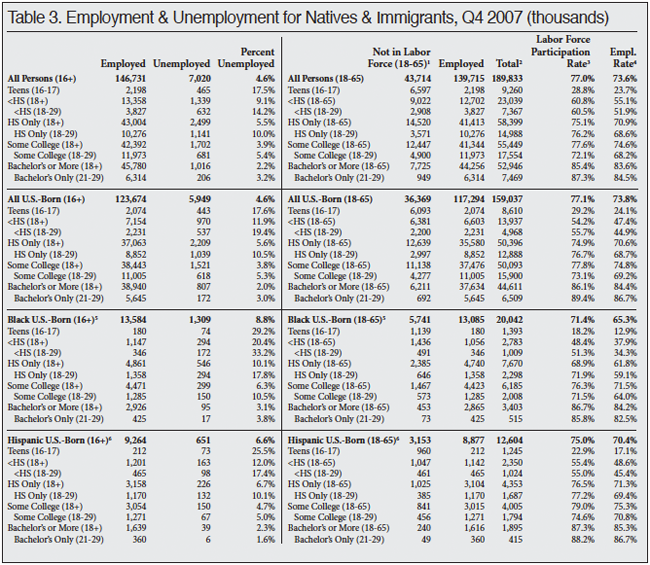
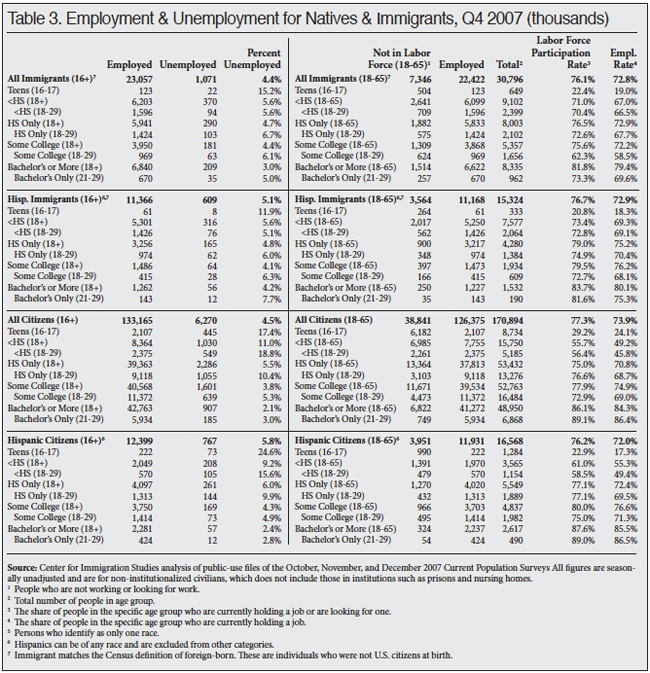
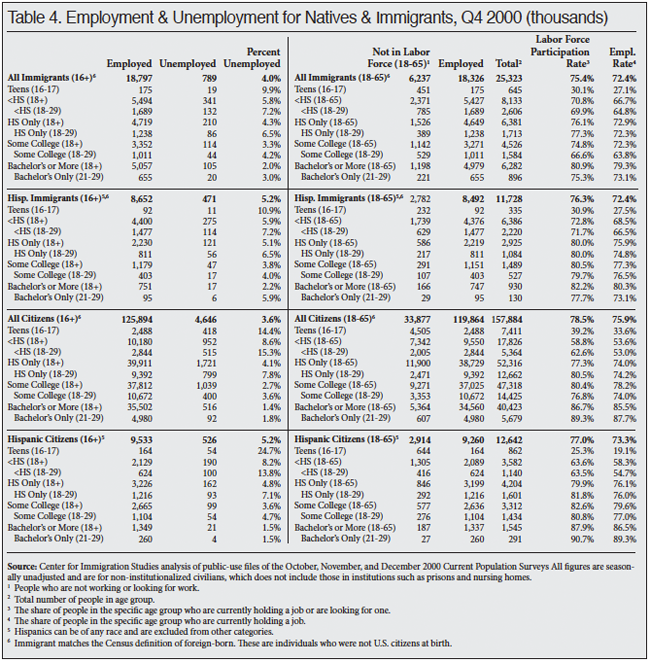
The Unemployed. The standard measure of unemployment, referred to as U-3, takes the number of people who report that they are not working and have looked for a job in the last four weeks and divides it by the number actually working plus those looking for work. The top half of Table 1 reports the number employed and the number unemployed for the fourth quarter of each year, 2000 to 2015. The left sides of Tables 2, 3, and 4 also report the U-3 unemployment rate in detail for different segments of the population in 2000, 2007, and 2015. We focus on 2007 and 2000 because they represent the peak years of the last two economic expansions.
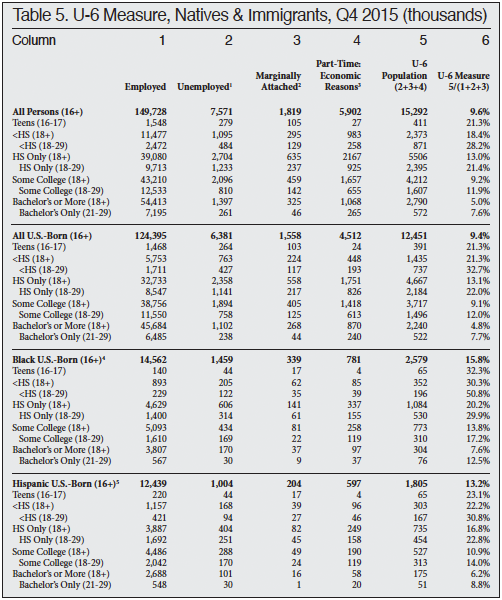
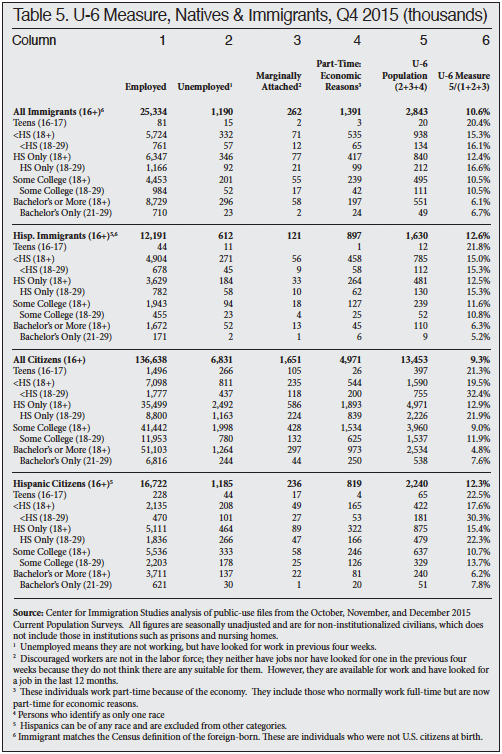
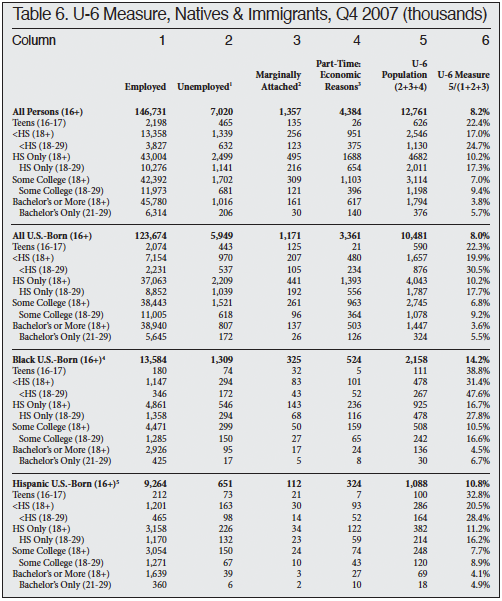
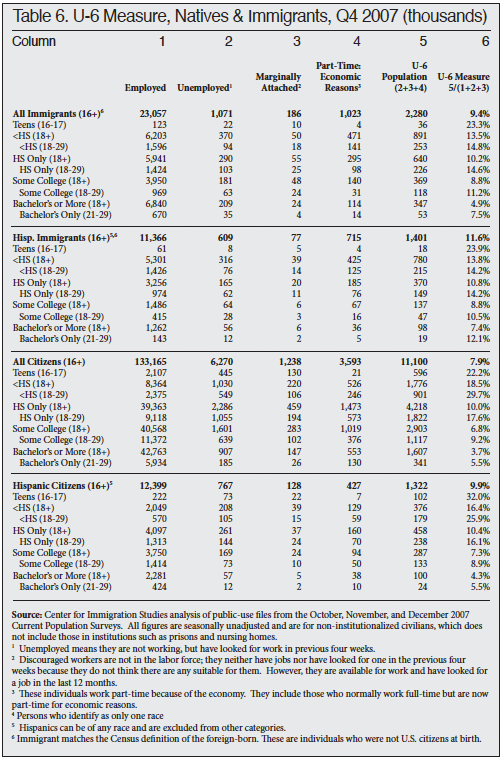
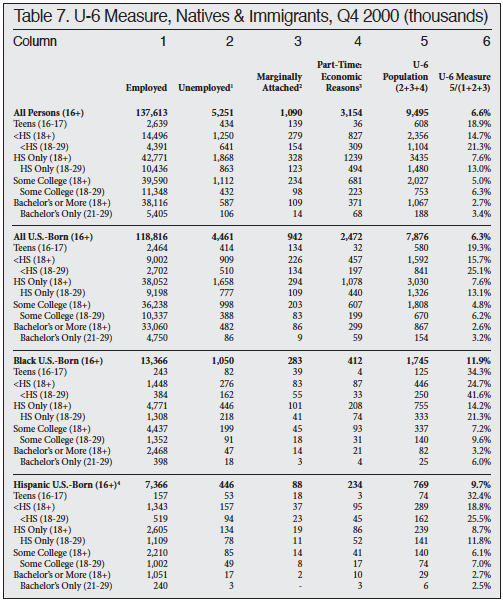
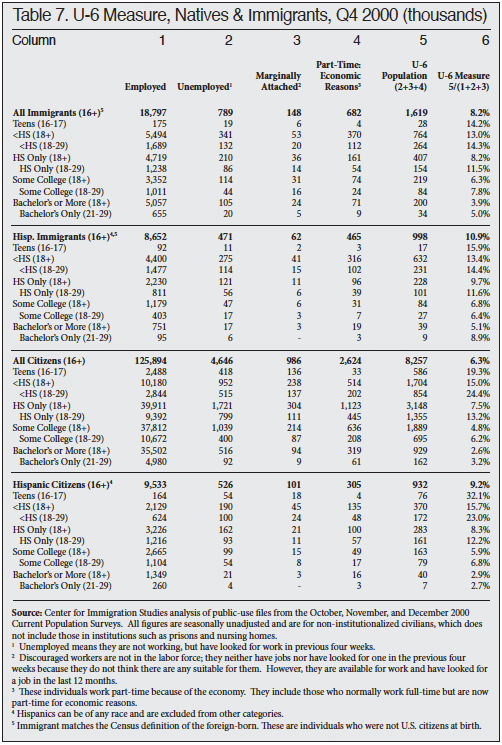
Other measures of unemployment are also calculated by the BLS, but they receive much less attention. The broadest measure of unemployment is referred to as the U-6 measure. It divides the sum of the unemployed population, involuntary part-time workers, and marginally attached people (discouraged and other) by the civilian labor force (employed and unemployed) plus marginally attached workers. The column headings in Tables 5, 6, and 7 show this calculation for the fourth quarters of 2000, 2007, and 2015; the last columns in the tables report the U-6 unemployment rate.
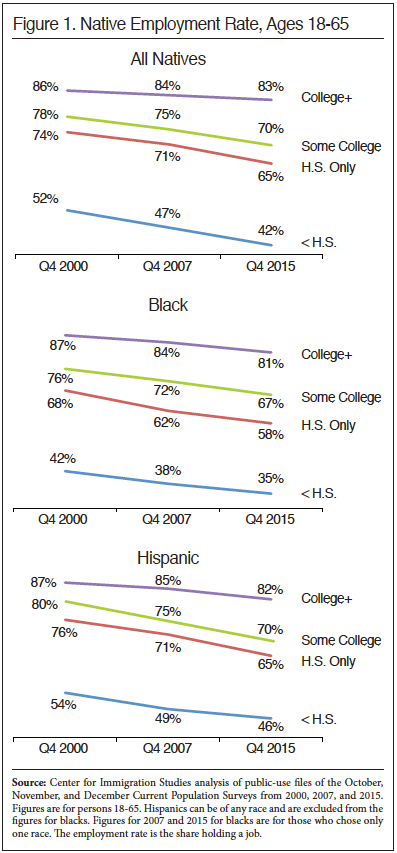
The Labor Force. The labor force includes all those working or who have looked for work in the four weeks prior to the CPS. The bottom left of Table 1 shows the number and share of those 16 to 65 not in the labor force. When looking at the number and share not in the labor force, it is very common to report statistics only for those under age 65 because the overwhelming majority of those over 65 do not work for reasons not related to economic conditions. The right sides of Tables 2, 3, and 4 report the number working in detail for different segments of the population in the fourth quarters of 2000, 2007, and 2015. The tables also report the share of people in the labor force, which is the inverse of those not in the labor force, as shown in Table 1. The right sides of Tables 2, 3, and 4 also report the employment rate. The employment rate is simply the share of people in each segment of the population who are working.


End Notes
1 Unemployment figures are for those 16 and older.
2 Unemployment figures are for those 16 and older.
3 Unemployment figures include a small number of people over age 65 who are actively looking for work.
4 Unemployment figures include a small number of people over age 65 who are actively looking for work.
5 The establishment survey is not released to the public, so no independent analysis of it is possible.