Steven A. Camarota is the director of research and Karen Zeigler is a demographer at the Center.
A good deal of media coverage and commentary has argued that immigration needs to be increased because arrivals slowed during Covid-19 and immigrant workers are now “missing” from the labor market, creating a “shortfall” for the economy. But an analysis of the government data from November of this year shows that there are actually 1.9 million more legal and illegal immigrants working than before the pandemic. (Immigrants are also referred to as the “foreign-born” in government data.)
To the extent workers are “missing”, it is due to the dramatic decline in the labor force participation rate — the share working or looking for work — of the U.S.-born in recent decades as the immigrant population has grown. This decline deprives the economy of workers and contributes to a host of social problems. If the labor force participation rate returned to where it was as recently as 2000, there would be millions more U.S.-born workers in the labor force.
Among the findings:
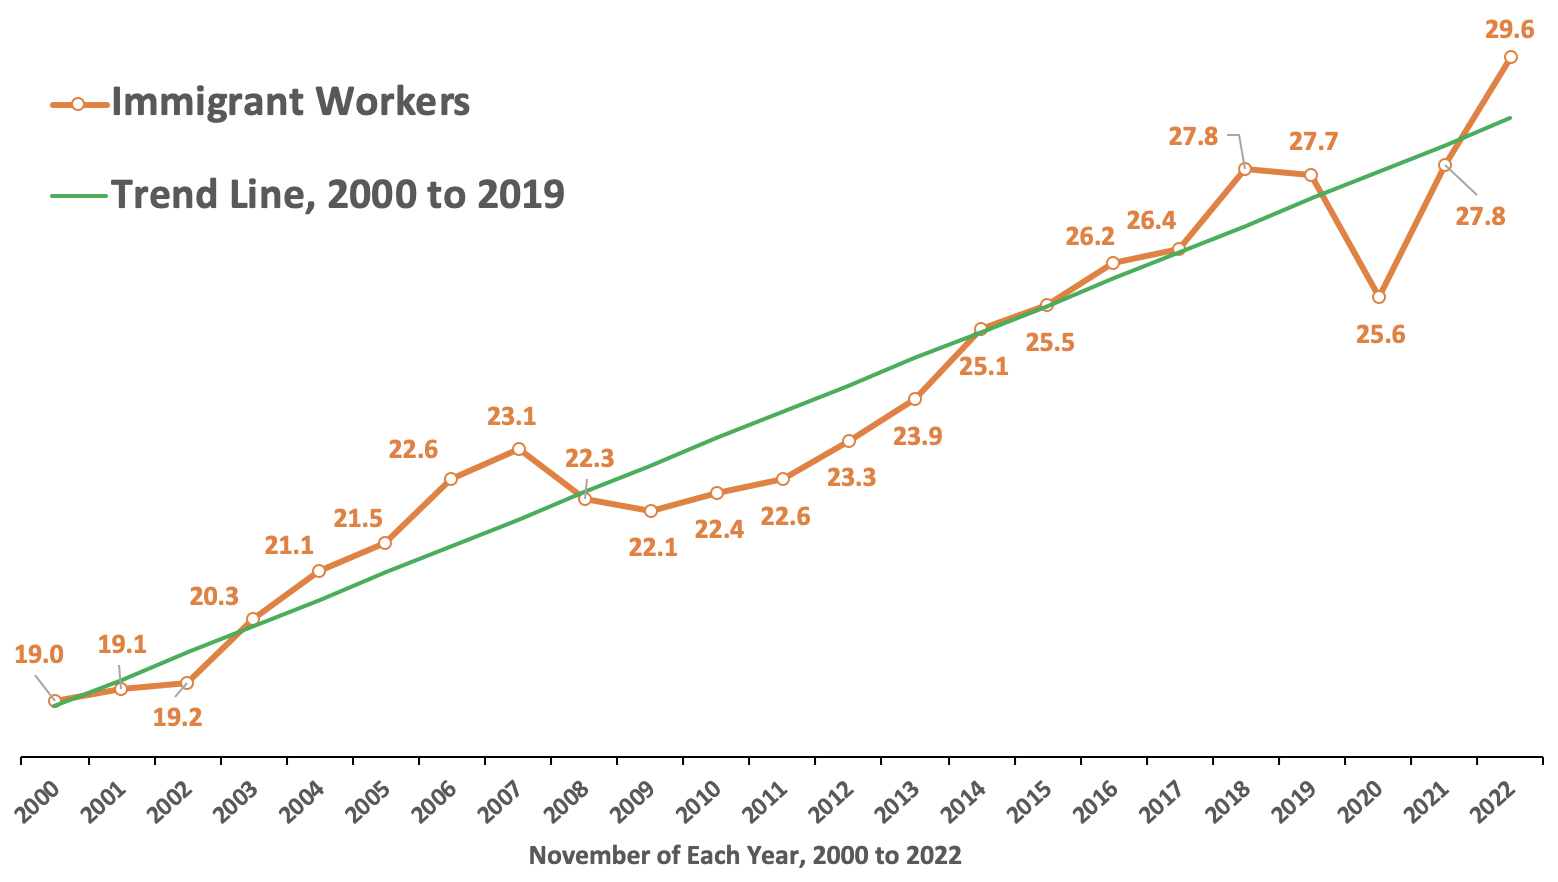
- In November 2022, there were 29.6 million immigrants (legal and illegal together) working in the United States — 1.9 million more than in November 2019, before the pandemic.
- The 29.6 million immigrant workers in November of this year was one million above the long-term trend in the pre-Covid growth rate of immigrant workers — immigrant workers are not “missing”.
- In contrast to immigrants, there were 2.1 million fewer U.S.-born Americans working in November 2022 than in November 2019, before the pandemic.
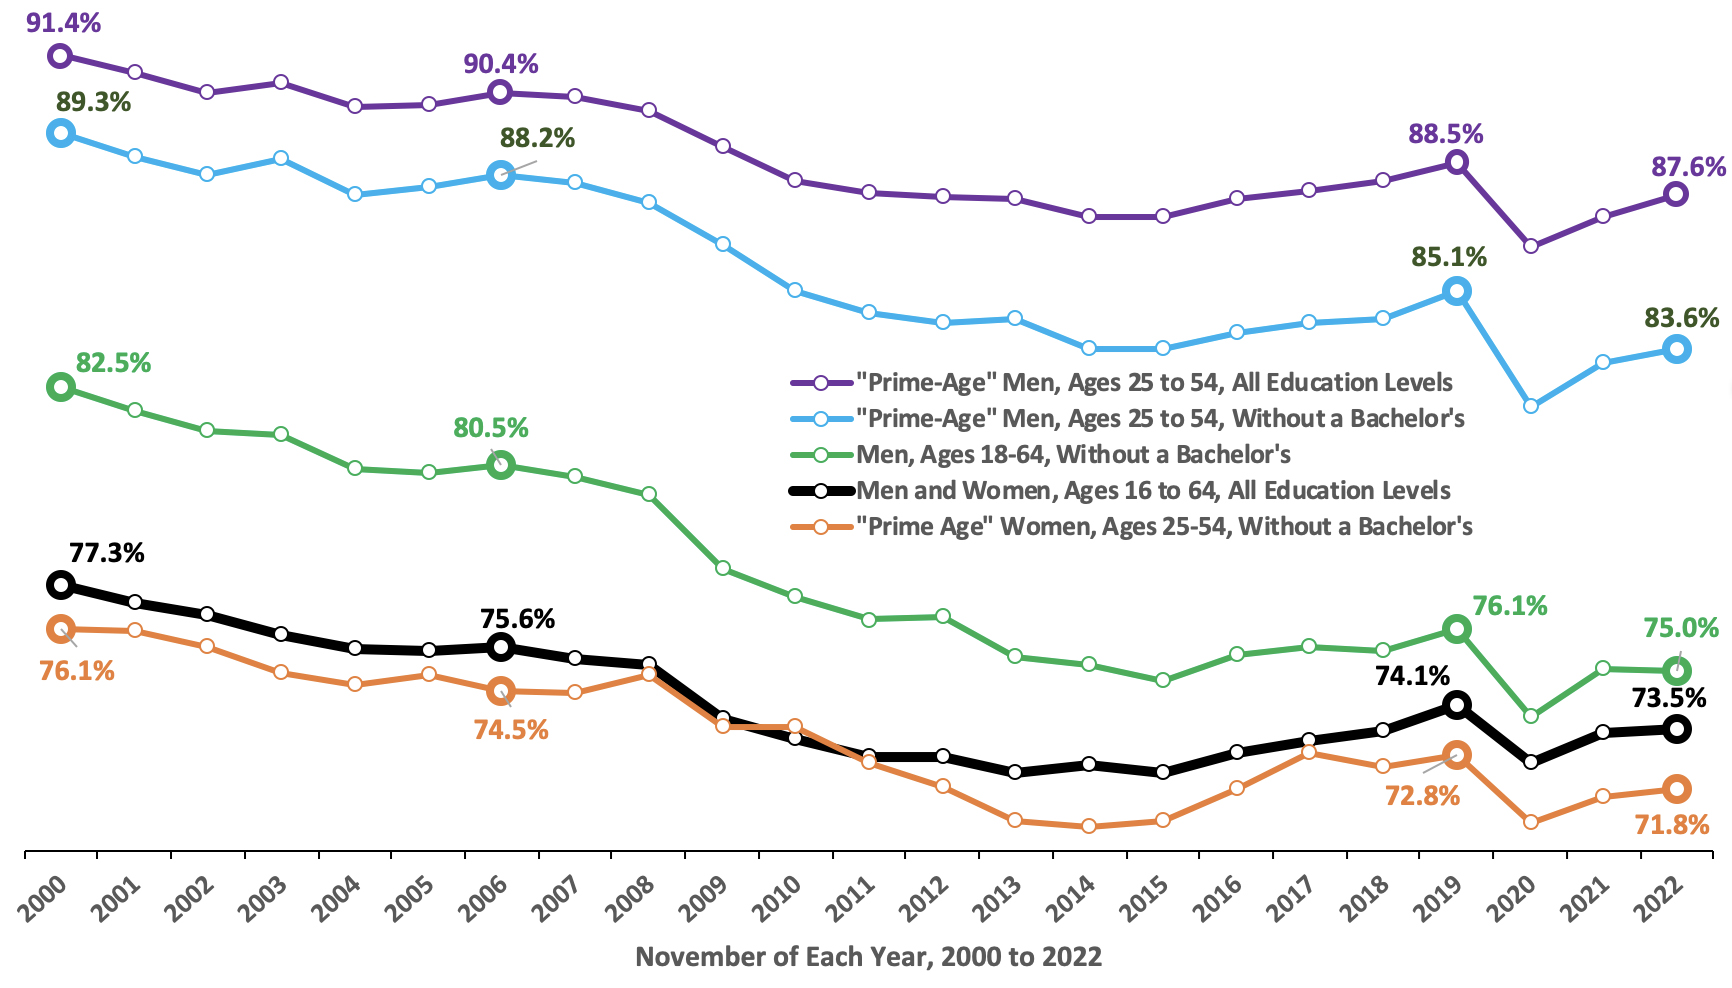
- There has been a long-term decline in the labor force participation rate — the share of the working-age (16-64) working or looking for work — among U.S.-born Americans, primarily those without a bachelor’s degree. These individuals do not show up as unemployed because they have not looked for work in the last four weeks.
- In November of this year, there were 44.9 million working-age U.S.-born Americans not in the labor force — nearly 10 million more than in 2000.
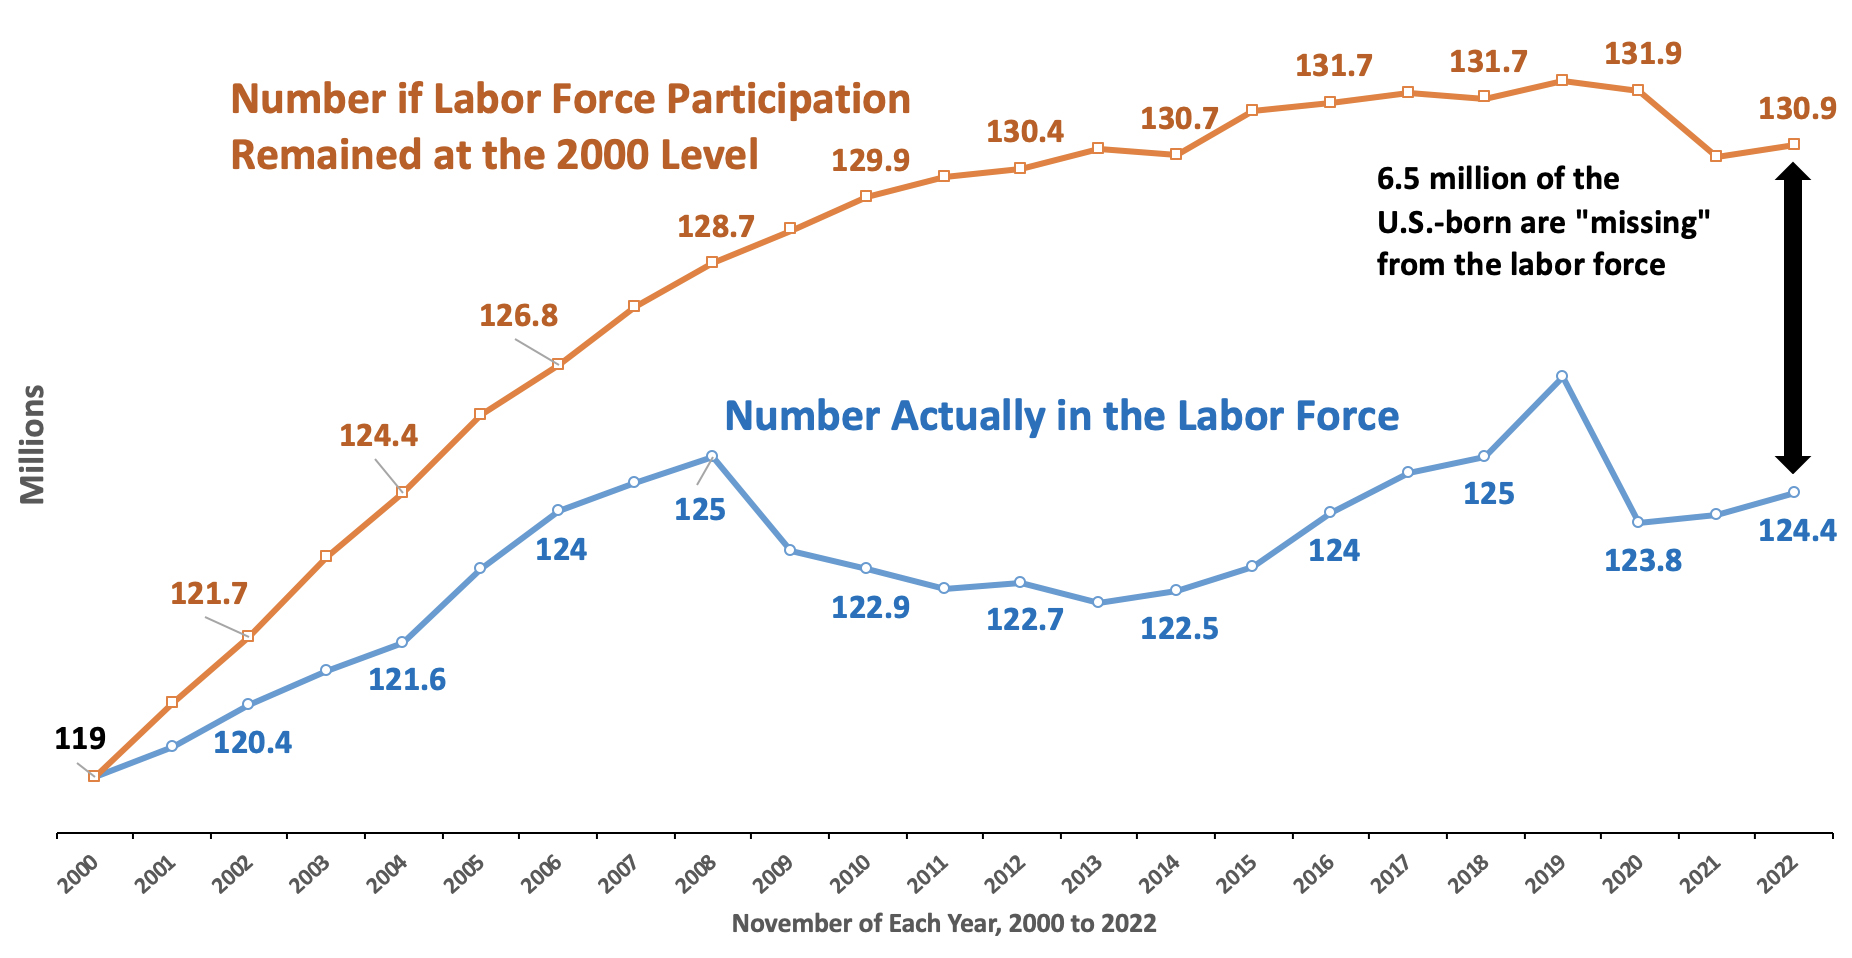
- The U.S.-born working-age population has increased in size since 2000, but if their labor force participation rate was what it was in 2000, there would be 6.5 million more Americans in the labor force.
The overall foreign-born:
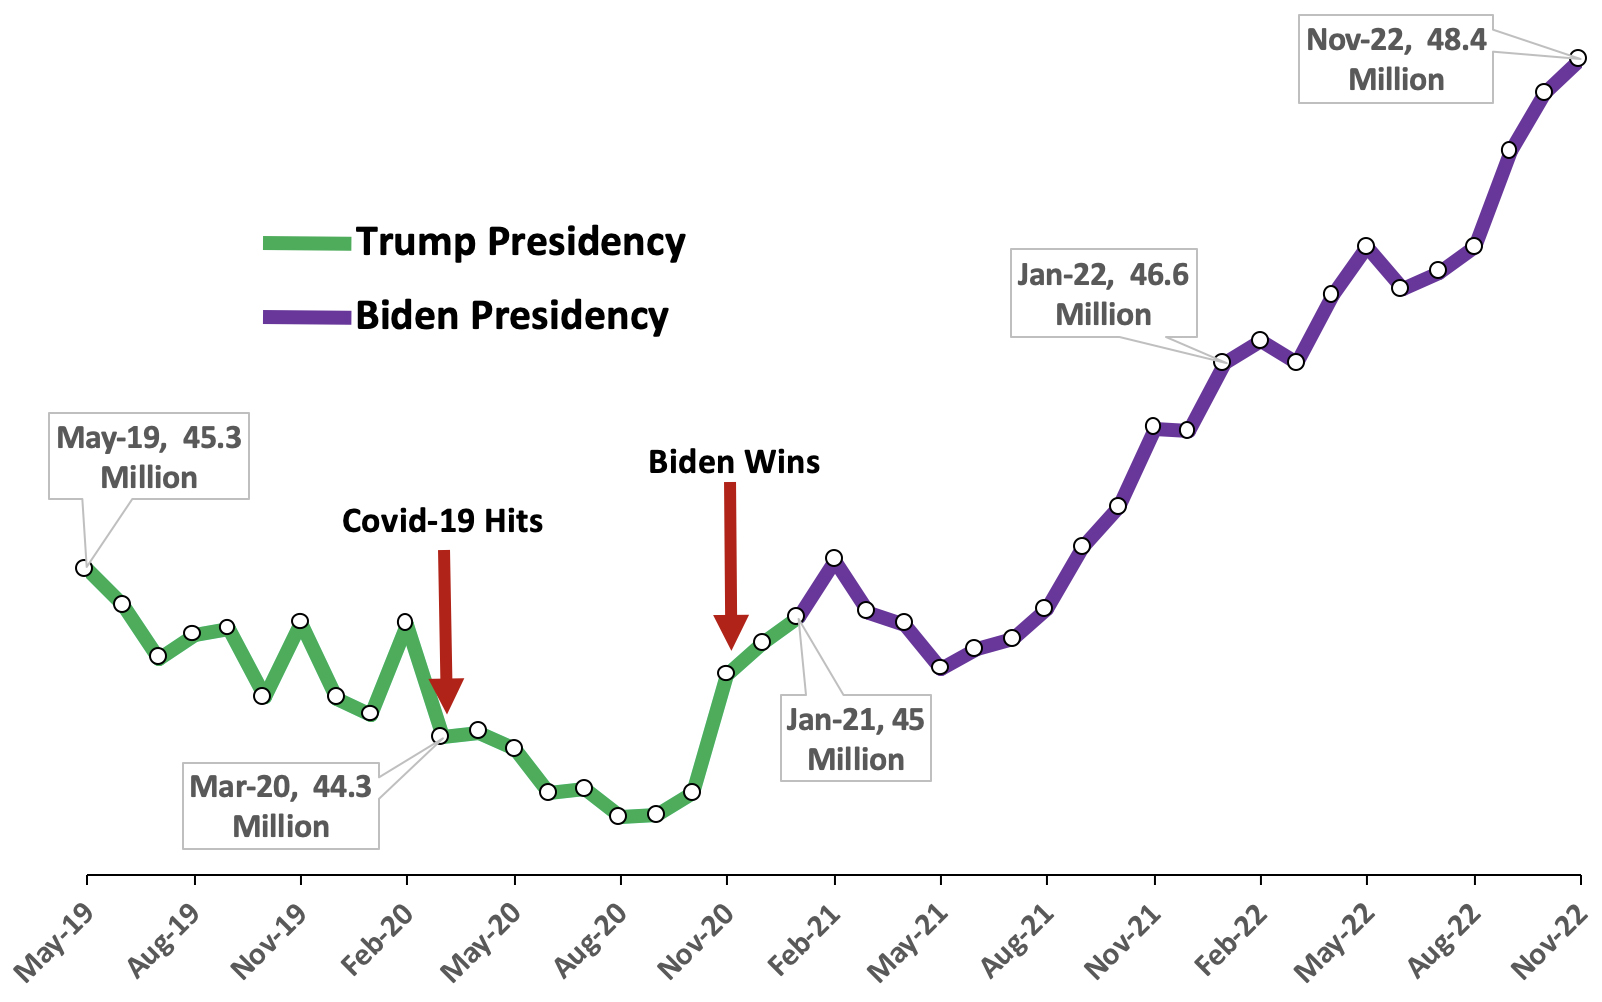
- The overall legal and illegal immigrant or foreign-born population — both workers and non-workers — was 48.4 million in November of this year, a new record high in American history and 3.4 million more than in January 2021 when President Biden took office.
- Our analysis of the monthly data in prior months indicates that about 60 percent or roughly two million of the 3.4 million increase in the overall immigrant population since January 2021 is due to illegal immigration.
- Immigrants are now 14.7 percent of the total U.S. population, which matches their share in 1910, and is just slightly below the all-time high reached in 1890 of 14.8 percent.
- The enormous number of immigrants already in the country matters because those calling for more immigration on behalf of employers seem unaware of the current scale of immigration and its impact on American society.
- Adding even more people to the country has important implications for the nation’s schools, healthcare system, infrastructure, and environmental conservation goals. Perhaps most important, there is the question of whether the county can assimilate a record number of i mmigrants.
Introduction
Reflecting in part media coverage of the tight labor market, and resulting pressure from employers in their districts and states, a number of Democratic and Republican politicians have argued that America needs to allow in more immigrant workers. This argument is often made based on the idea that because immigration slowed significantly during Covid-19, admissions now need to be accelerated to provide employers with more workers. The slowdown has recently been described as, “two years of lost immigration”. But as we will see in this analysis, the overall number of immigrant workers (legal and illegal together) is now a good deal larger than before the pandemic. Moreover, pressure to bring in more immigrants ignores the enormous number of U.S.-born Americans on the economic sidelines who could be brought into the labor force.
Equally important, the immigrant share of the U.S. population is already just below the all-time high reached 132 years ago in 1890. Those calling for more immigration have to at least acknowledge this fact and address the issues this situation creates for everything from America’s schools to its health system, to say nothing of the challenges associated with assimilating an unprecedented number of immigrants.
We use the public-use data from the Current Population Survey (CPS) collected by the Census Bureau for the Bureau of Labor Statistics (BLS) each month. The survey is of the non-institutionalized, so it does not include inmates. Both the Census Bureau and the Bureau of Labor Statistics are clear that illegal immigrants are included in the data. We rely on the CPS because it is really the only source of information that reflects the recent dramatic increase in immigration caused by the ongoing border crisis and the restarting of visa processing overseas in 2021. Like other researchers, we often use the larger American Community Survey (ACS) to study the foreign-born. However, the 2021 ACS reflects the population in July 2021 and the 2022 ACS will not be released for another year. So the ACS does not capture the rapidly evolving immigration situation. Throughout this report, we use the terms “immigrant” and “foreign-born” interchangeably; this includes all those who were not U.S. citizens at birth, such as naturalized citizens, permanent residents, long-term visitors (e.g. guestworkers and foreign students), and illegal immigrants.1
The Growth in Immigrant Workers
Number of Immigrant Workers. Figure 1 reports the total number of foreign-born workers in November of each year since 2000 based on the CPS.2 The BLS reports figures on the employment of the foreign-born in Table A-7 each month. Results from the public-use data are only trivially different from what is reported in Table A-7. We follow the BLS’s example and report seasonally unadjusted figures, but by looking at the same month each year the data is essentially seasonally adjusted. Figure 1 shows 29.6 million immigrants employed in November 2022, 1.9 million more than in November 2019 before Covid-19. On its face, this is a clear indication that the number of immigrants working has not only returned to pre-pandemic levels, it now significantly exceeds it.
Figure 1. The number of immigrants working in November 2022 was 1.9 million above November 2019 and one million above the 2000 to 2019 pre-Covid trend line (in millions). |
 |
Source: 2000 to 2022 November public-use Current Population Survey. |
Long-Term Trend. Figure 1 includes a trend line from 2000 to 2019, carried forward to 2022. The 29.6 million immigrant workers in November 2022 are one million above the long-term trend in the growth of foreign-born workers assuming the pre-Covid 19 rate. It should be noted that our trend line goes back to November 2000 and ends in November 2019, before the pandemic.3 Below, we will look at research that uses a trend line that begins in 2010 instead of 2000.
Figure 2 shows the same information as Figure 1, but starting in 2010. The 2010 to 2019 trend line shows that by November 2022 the number of immigrant workers was slightly below (320,000) the trend line. Of course, it is not clear how relevant trend lines are. Immigration is a discretionary policy of the federal government. The American people acting through their elected representatives determine the level of legal immigration and the level of resources devoted to controlling illegal immigration. The long-term increases in immigrant workers was certainly not inevitable, but rather reflected decisions taken by the federal government. If a different set of policies had been pursued, then the trends would have looked quite different.
Figure 2. The number of immigrants working in November 2022 was slightly below the pre-Covid trend line, when 2010 is used as the starting point (in millions). |
 |
Source: 2010 to 2022 November public-use Current Population Survey. |
Peri and Zaiour’s Analysis
Missing Immigrant Workers? Despite the evidence presented above, the idea that immigration is down or below pre-Covid levels has gained a lot of traction in the media. The Economist, CBS News, NPR, the New York Times, and many other outlets have reported that there are not enough workers due to a decline in immigration during Covid-19. A lot of the coverage cites an article from January 2022 published in EconoFact, which uses the CPS. The authors, Giovanni Peri and Reem Zaiour, argue that because the pace of increase in the number of working-age immigrants, defined as ages 18 to 65, was slower though December 2021 than between 2010 and 2019, there are two million “missing” immigrant workers. An update of their analysis in Bloomberg News through June 2022 finds the “gap” in immigrant workers is still 1.7 million. There are a number of issues with this analysis.
Long-Term Growth in Immigrant Workers. As reported in Figure 1 the actual number of immigrants working by November of this year was 1.9 million above the number in November 2019, and one million above the long-term trend from November 2000 to November 2019. Figure 2 shows that if we use the years 2010 to 2019 to create the trend line, then by November 2022 the number of immigrants is just slightly below the trend. If we compare the total number of immigrants working in June 2019 (27.6 million) before the pandemic to June 2022 (28.4 million) — the last month of Peri and Zaiour’s updated analysis — we still find 820,000 more immigrants working than in 2019. However, it is true that the June 2022 number is one million below the trend from June 2010 to June 2019 projected forward. This is not trivial, but it is quite a bit less than the 1.7 million Peri and Zaiour report.
Furthermore, if we take a longer view and create a trend line from June 2000 to June 2019 and project it, it shows 28.48 million immigrant workers in June 2022, which is basically identical to the 28.43 million actual immigrant workers in June 2022. So it very much depends on what starting date is used to create a trend line. But most important, by November of this year, the number of immigrant workers significantly exceeded the pre-Covid 2000 to 2019 trend line. If November 2010 to 2019 is used to create a trend line, then the number of workers in November 2022 is slightly below trend. So, even if one thinks the whole idea of projecting prior trends forward makes sense, it is still not really possible to argue that the number of immigrant workers is now significantly below the trend line.
Workers vs. the Working Age. As already mentioned, Peri and Zaiour are not looking at workers, but instead immigrants who are of working age, defined as 18 to 65. A little over one quarter, or eight to nine million immigrants ages 18 to 65, are typically not working at any one time, as they are unemployed or out of the labor force entirely. It is unclear why Peri and his coauthor do not look at actual workers.4 Their decision to look at the working-age and not workers means that they also underestimate the impact of immigration on the supply of labor because the labor force participation of immigrants is somewhat higher now than before Covid. In the appendix of this report, we discuss our unsuccessful attempt to match their findings. Whatever the reason they chose to look at the working-age, their approach is part of the reason they show much larger numbers of “missing workers” than if actual workers are used. In our view, comparing the same month year-over-year and looking at the number of actual workers makes the most sense.
Other Issues. Peri and Zaiour’s central assumption is that the working-age immigrant population must grow at the same pace as in the past, otherwise it will create a worker “shortage”. For one thing, an ever-growing immigrant population requires an endlessly increasing number of new arrivals to offset the rise in deaths and emigration that comes as the immigrant population increases in size. Equally important, as already mentioned, the discretionary nature of immigration means there is no reason immigration has to be maintained at any level. Finally, it is puzzling that Peri and Zaiour, who are very concerned about a lack of workers, never mention the long-term and well-documented decline in labor force participation among the U.S.-born. Moreover, a host of EEOC cases, and other research, including by the U.S. Civil Rights Commission, indicates that immigrants sometimes displace U.S.-born workers. However, none of this comes up in their analysis.
The Decline in Work Among the U.S.-Born
Labor Force Participation. Economists typically refer to the share of working-age people who are working or looking for work as the “labor force participation rate”. While there is some fluctuation with the economy, in general the participation rate of working-age, U.S.-born men has fallen since the 1960s. This decline has been studied by numerous researchers for quite some time, including the Obama White House and the Federal Reserve. For women, labor force participation generally increased until about 2000, but has fallen some since then. The decline for men and women is mainly among those without a bachelor’s degree, though it has also impacted teenagers. In contrast, the labor force participation rate of the foreign-born has not declined in the same way. Of the 54 million working-age people (ages 16 to 64) not in the labor force in November 2022, more than eight out of 10 were U.S.-born.
It should be noted that the BLS includes what it calls the “the labor force participation rate” in its monthly Employment Situation Report. But that statistic is for the entire population 16 and older, including those 65 and older, only a modest fraction of whom work. This definition of labor force participation is heavily impacted by the slow, steady aging of American society. It is not really a measure of the share of potential workers who are actually working or looking for work. For the remainder of this report, we look at labor force participation of working-age people, defined in different ways, but all of which exclude those 65 and older.
Decline in Participation of U.S.-Born Americans. Figure 3 reports the labor force participation rate for the U.S.-born with different levels of education and ages. The black line in the middle of the figure shows the decline among the entire U.S.-born working-age (16-64) population, both men and women. While there certainly has been recovery since the depths of the Covid recession, the rates have not returned to pre-Covid levels, to say nothing of the rate in 2006 before the Great Recession or the peak in 2000 for any of the groups in Figure 3. Moreover, while the labor force participation of the young — ages 16 to 24 — has certainly declined, Figure 3 makes clear that the falloff is by no means confined to youths.5
Figure 3. At the peak of each expansion the labor force participation rate of the U.S.-born was lower than at the peak of the prior expansion, especially for men without a bachelor’s degree. |
 |
Source: 2000 to 2022 November public-use Current Population Survey. |
Economists often look at “prime-age” men aged 25 to 54 because men traditionally have higher rates of work, especially in this age group. The rate for these men, shown in purple, has declined since 2000. The decline is particularly pronounced for prime-age, U.S.-born men without a bachelor’s degree, shown in blue. This fall in labor force participation goes back to the 1960s, though we cannot use the CPS to distinguish the U.S.-born and foreign-born before 1994. The labor force participation of prime-age, less-educated women, shown in orange, has also declined, though not as much as it has for men.
“Missing” U.S.-Born Workers. Figure 4 shows the total number of U.S.-born Americans 16 to 64 and the number in this age group in the labor force. If the labor force participation rate of the U.S.-born had remained at the same level as it was in 2000, there would be 6.5 million more people in the labor force in November 2022. If the rate was what it was in 2006, before the Great Recession, then 3.7 million more would be in the labor force, and even if it was the same as 2019 then one million more U.S.-born, working-age Americans would be in the labor force. To the extent workers are “missing”, it seems fair to say it is due to this dramatic decline in the participation rate of working-age, U.S.-born Americans, rather than a falloff in immigrant workers.6 To be clear, not all or even most of the 44.9 million U.S.-born Americans not in the labor force should be working or wish to do so. Some are taking care of young children or elderly relatives, others are legitimately disabled, still others are in school, and some are independently wealthy. But the fact remains that all of these things were true in the past, and yet a much higher percentage were in the labor force as recently as 2000.
Figure 4. If the labor force participation rate of the U.S.-born (16 to 64) had not declined, 6.5 million more would be in the labor force. (in millions). |
 |
Source: 2000 to 2022 November public-use Current Population Survey. |
What’s Causing the Decline in Participation. The reasons offered for why fewer of the U.S.-born that are of working age are in the labor force are as varied as the proposed solutions. Some researchers emphasize overly generous and easily accessed disability and welfare systems. Others emphasize the large share of less-educated men with criminal records, while others argue that structural changes in the economy, particularly declining wages for the non-college educated are the primary reason for the decline. As already mentioned, competition with immigrants likely explains some of the falloff in labor force participation.
The reason for the decline in labor force participation goes beyond the scope of this analysis, but there are two things we can say about this situation. First, the decline is extremely troubling because it is associated with many social problems, from crime and opioid addiction to mental health issues and obesity. Second, high levels of immigration — legal and illegal — reduce political pressure from employers and society in general to address this decline. To be sure, a big part of the reason the problem has not been addressed is that doing so would require a sustained effort across a broad range of policy areas. But it seems certain that the country is much less likely to undertake this difficult task if employers continue to be given access to millions of eager immigrant workers.
The Overall Foreign-Born Population
A New Record Number. Figure 5 reports the total number of foreign-born residents in the United States from May 2019 to November 2022. This includes legal and illegal immigrants of all ages as well as workers and non-workers. The November 2022 CPS showed that the total immigrant or foreign-born population was 48.4 million, a new record high in American history and 3.4 million more than in January 2019, when President Biden took office. What is so striking about the recent run-up in the number of immigrants is that the growth represents the net change in their numbers. For the foreign-born population to grow so much, significantly more than 3.4 million new immigrants had to arrive to offset emigration, which we previously estimated at about one million annually, and deaths among the existing foreign-born population of about 300,000 each year.7 Births to immigrants in the United States, by definition, can only add to the native-born population.8
Figure 5. Since President Biden's election, the foreign-born population has increased dramatically. |
 |
Source: May 2019 to November 2022 public-use Current Population Survey. |
A Rapid Increase in the Numbers. Despite a strong economy before Covid-19 affected the country in March 2020, Figure 5 shows the that foreign-born population had already declined some in the latter part of 2019. Once travel restrictions were imposed and Title 42 expulsions began at the border, the immigrant population declined through the middle of 2020, hitting a low of 43.8 million in August and September of that year. The foreign-born population has rebounded by 4.6 million since late summer 2020, though some of the increase immediately after the summer of 2020 may be due to better data collection as the pandemic abated rather than an actual increase in the immigrant population. That said, the BLS does state that it has confidence in the quality of the data even at the height of Covid-19 in 2020.9
The Biden Administration. The 3.4 million increase in the last 23 months can be seen as unprecedented. As Figure 5 shows, the big upturn in growth in the foreign-born numbers seems to have begun the month president Biden won office. Table 1 shows immigrants by region in January 2021 and November 2022. Immigration from Latin American countries other than Mexico, which actually declined a little, accounted for 71 percent of the growth in the foreign-born population since January 2021.10 South America accounts for 29 percent of the increase, Central America 23 percent, and the Caribbean 18 percent. As discussed in our prior analysis, the substantial increase in immigrants from the Western Hemisphere is an indication that illegal immigration has played a very large role in the growth of the foreign-born population since the beginning of 2021.
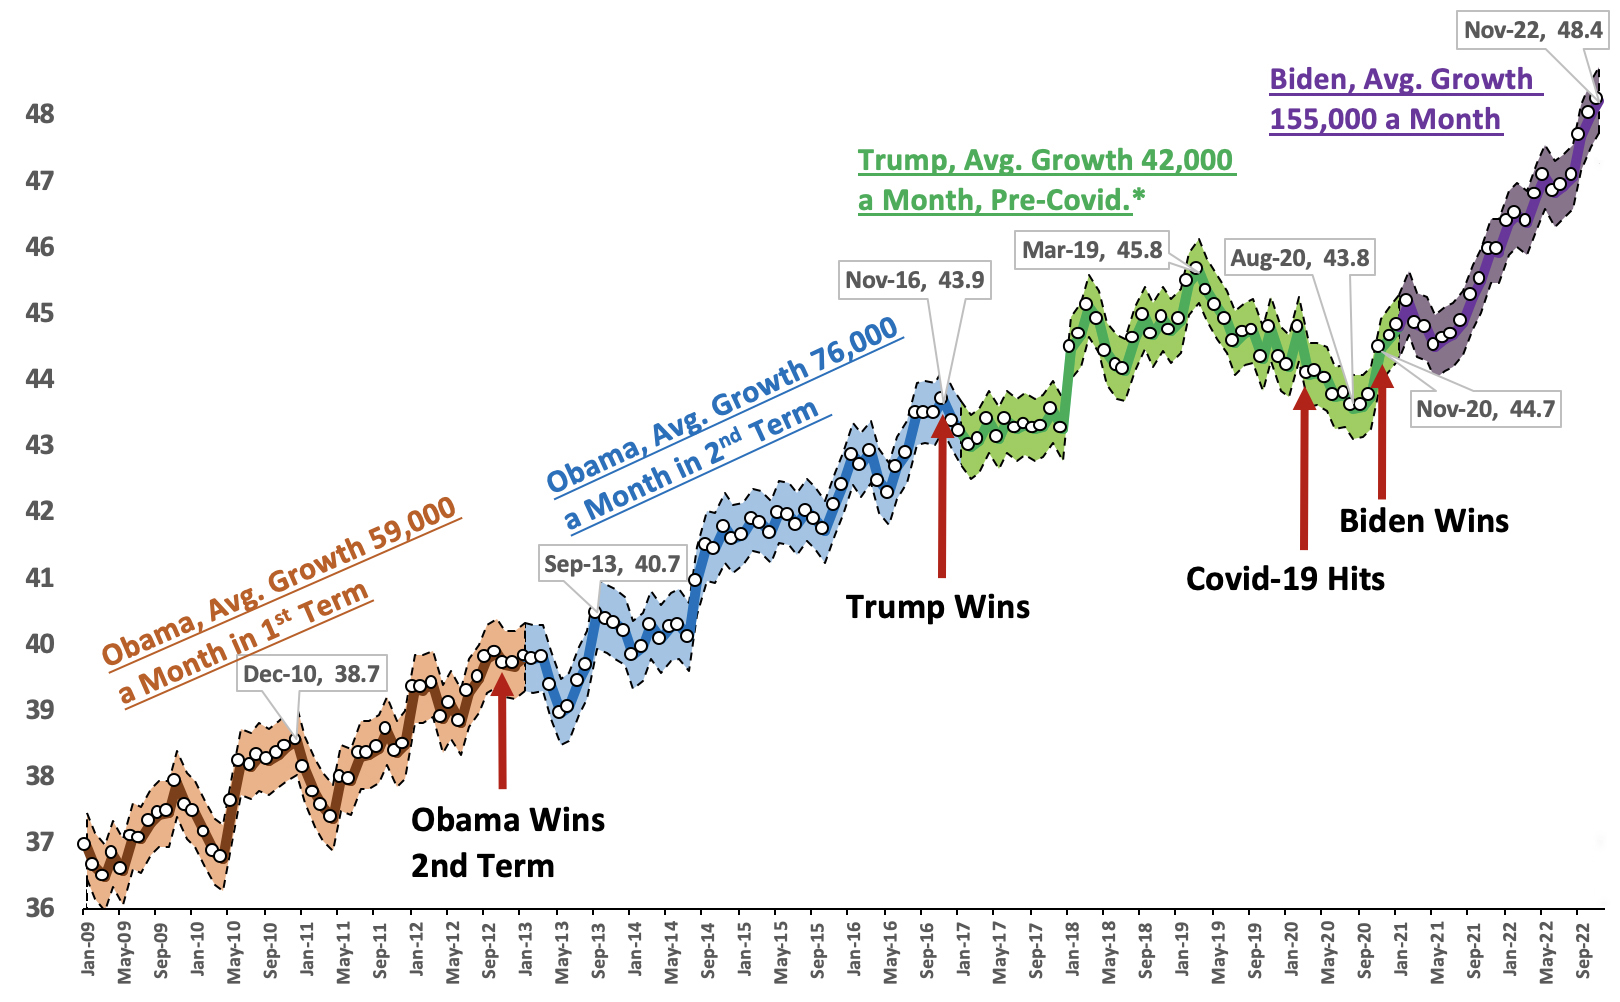
Longer-Term Growth in the Foreign-Born Population. Figure 6 shows the size of the foreign-born population from the start of President Obama’s first term in January 2009 to November of this year. While the monthly CPS is a very large survey of about 130,000 individuals, the total foreign-born population in the data still has a margin of error of about ±500,000 using a 90 percent confidence level. The shaded areas in Figure 6 show the margin of error around the point estimate for each month since 2009. The margin of error means there is fluctuation from month to month in the size of this population, making it necessary to compare longer periods of time when trying to determine trends based on this data.11 Since January 2009, the foreign-born population has grown by 11.3 million. Figure 6 also shows that the average monthly increase in the foreign-born population was much faster during Obama’s and Biden’s presidencies relative to the first three years of Trump’s (January 2017 to February 2020), before the arrival of Covid-19.12
Figure 6. The foreign-born population grew more slowly during Trump's presidency than Obama's, while growth in Biden's has been truly dramatic. (January 2009 to November 2022, in millions) |
 |
Source: January 2009 to November 2022 public-use files of the Current Population Survey. Shaded area shows the margins of error around the point estimates, assuming a 90% confidence level. |
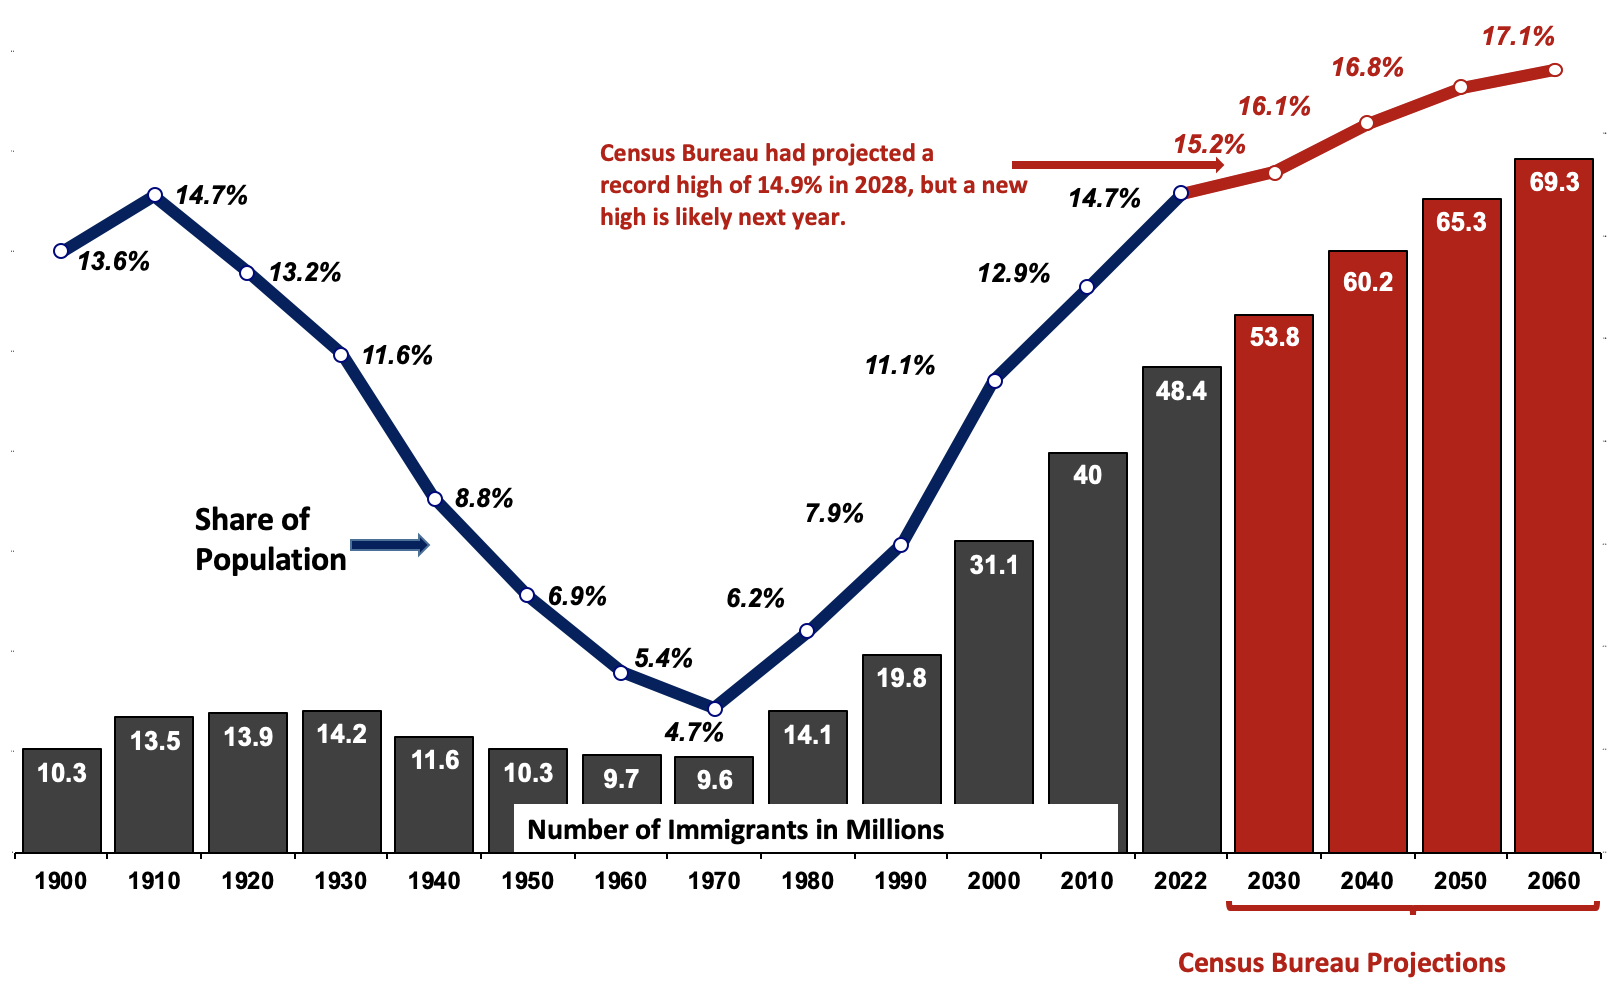
Historical Comparison. Figure 7 shows that, at 48.4 million in November 2022, the immigrant population is much larger than in any year since 1900. In fact, it is larger than the foreign-born population measured in any prior decennial census or survey going back to 1850, when the foreign-born were first identified in the census. Of course, this is to be expected since the U.S. population was so much smaller in the 1800s relative to today. But since 2000, the foreign-born population has grown by 54 percent; it has doubled since 1990, more than tripled since 1980, and quintupled since 1970. There has never been a 52-year period in American history when the number of immigrants has grown this fast.
Figure 7. Foreign-Born in the U.S., Number and Percent, 1900-2022, plus Census Bureau Projections to 2060 |
 |
Source: Decennial census for 1900 to 2000, American Community Survey for 2010, November Current Population Survey (CPS) for 2022. The CPS does not include the institutionalized. |
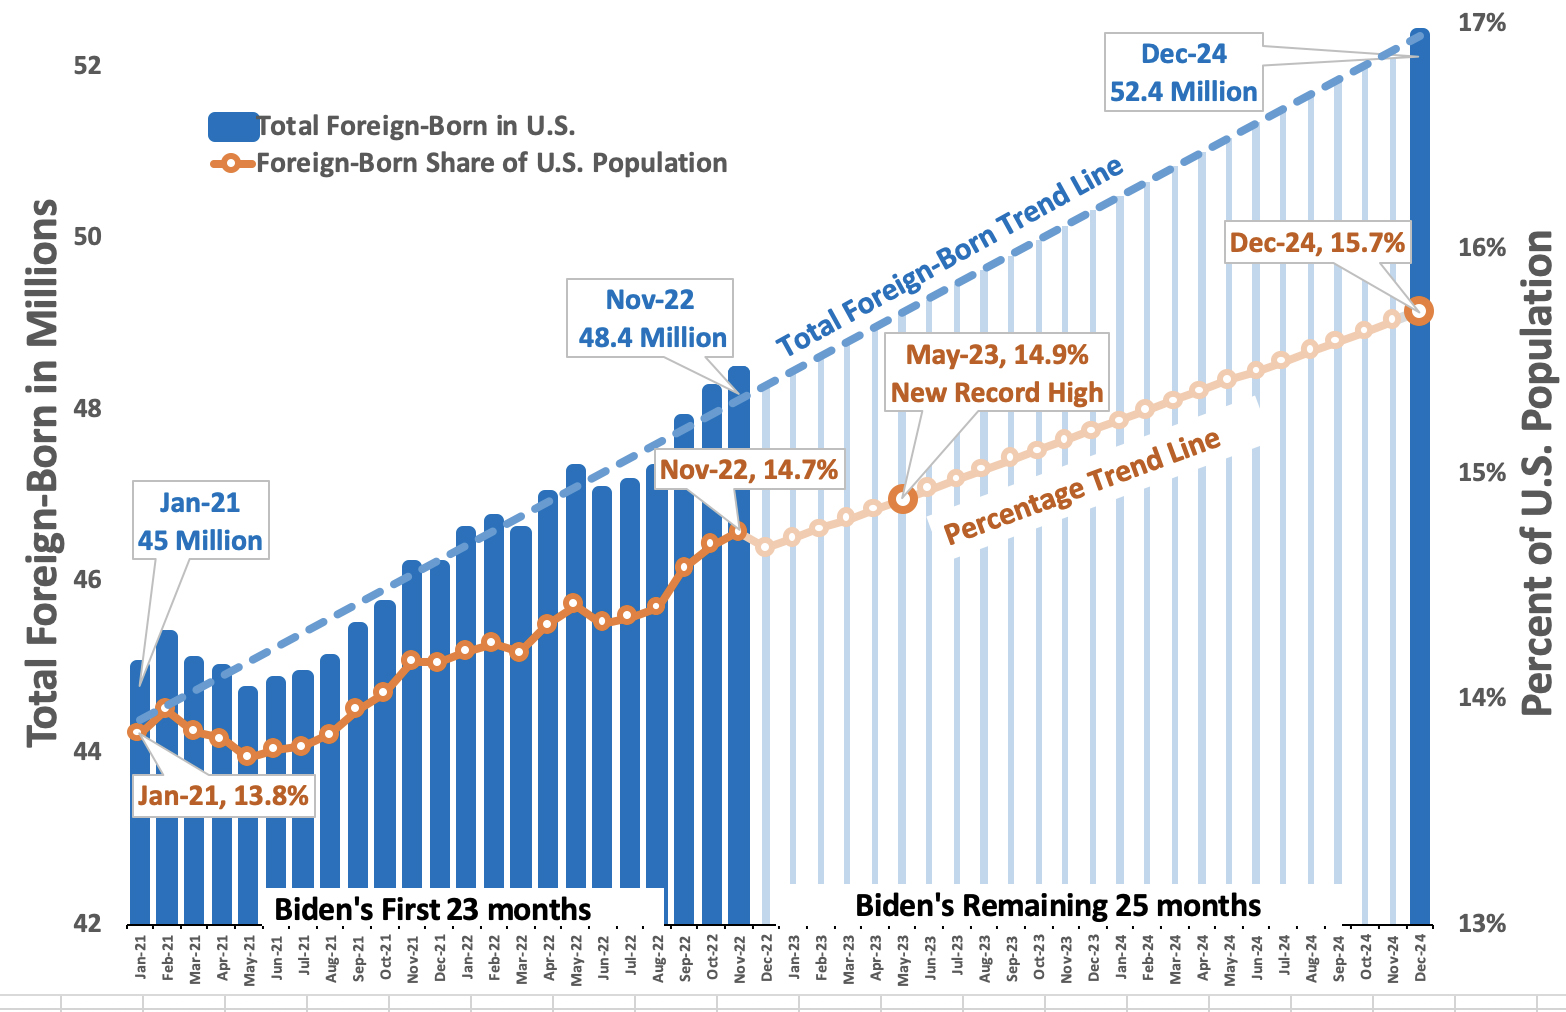
The Percentages Relative to the Past. Figure 7 shows that the immigrant share of the U.S. population is now 14.7 percent. This is triple the share in 1970 and nearly double the share in 1990. Looking at prior censuses and carrying out the percentages two decimal places shows that 1890 (14.77 percent) was the only time the foreign-born population was higher than it is today (14.74 percent).13 When thinking about the impact on American society and the importance of absolute numbers versus percentages, it seems reasonable to assume that both the size of the foreign-born population and its share of the population both matter. Figure 8 projects the foreign-born population to the end of President Biden’s first term using a linear model based on trends in the foreign-born population since January 2021. It shows that the foreign-born share will hit 14.9 percent of the total U.S. population in May 2023 — higher than at any time in American history. This record percentage is five years earlier than what the Census Bureau projected. Figure 8 also shows that the total number of immigrants will reach 52.4 million by the end of President Biden’s first term — a good deal higher than the 49.6 million the Census Bureau had projected for 2024.
Figure 8. If the foreign-born population continues to grow at the current pace, it will reach 15.7 percent of the U.S. population and 52.4 million by the end of Biden's first term, both record highs in American history. |
 |
Source: January 2021 to November 2022 public-use Current Population Survey. |
What’s Causing the Rapid Growth? In our analysis of the data from September of this year we discuss at length the various policies that caused the unprecedented growth in the foreign-born population. In sum, we estimated that since January 2021, 61 percent of the increase in the total foreign-born population is from illegal immigration. We continue to believe this to be correct, which would mean roughly two million of the 3.4 million increase is due to an increase in the number of illegal immigrants. As pointed out in our prior analysis, this surge of illegal immigration is being caused by public statements and, most importantly, policies adopted by the Biden administration at the border and in the interior of the United States that have greatly incentivized illegal immigration. Moreover, the restarting of visa processing at American consulates has allowed many more permanent immigrants (green card holders) and long-term temporary visitors (e.g., guestworkers and students) to arrive from abroad than during the pandemic.
Conclusion
Despite media coverage to the contrary, this analysis shows that the number of immigrant workers in November 2022 was well above what it was in November 2019 before the pandemic. To the extent that workers are in short supply in the American labor market, it is more reasonable to see the decline in the labor force participation rate of the U.S.-born as the cause. The labor force participation rate of the U.S.-born has declined significantly in recent decades, particularly for less-educated men. If the same share of the U.S.-born of working-age (16 to 64) were in the labor force today as in 2000, it would add 6.5 million more people to the labor force. Even if the rate only returned to what it was in 2019, there would be an additional million more Americans in the labor force. Assuming one accepts the idea that there really is a shortage of workers, the key question for policy-makers and the public is whether it makes more sense to try to get more Americans back into the labor force, and lessen the social problems that the decline in labor force participation contributes to, or to allow in more immigrant workers.
The November CPS shows that the total immigrant population (legal and illegal together) was 48.4 million in November of this year — a new record and an increase of 3.4 million since January 2021 when President Biden took office. The most fundamental question when it comes to immigration is whether America can successfully incorporate and assimilate this many people. Proponents of continued large-scale immigration typically do not address this question. This would seem to be an especially important issue given that the foreign-born share of the U.S. population is now 14.7 percent, which roughly matches the high reached 112 years ago in 1910 and is just below the all-time high of 14.8 percent in 1890.
If the current pace of increase in the foreign-born population continues, their share of the total population will surpass the 1890 record percentage sometime next year and presumably continue to head into uncharted territory. The current scale of immigration also raises important questions about the absorption capacity of the nation’s schools, healthcare system, and physical infrastructure. Unfortunately, proponents of more immigration are entirely focused on giving employers access to more workers, but the broader implications for American society are at least as important to consider.
Appendix
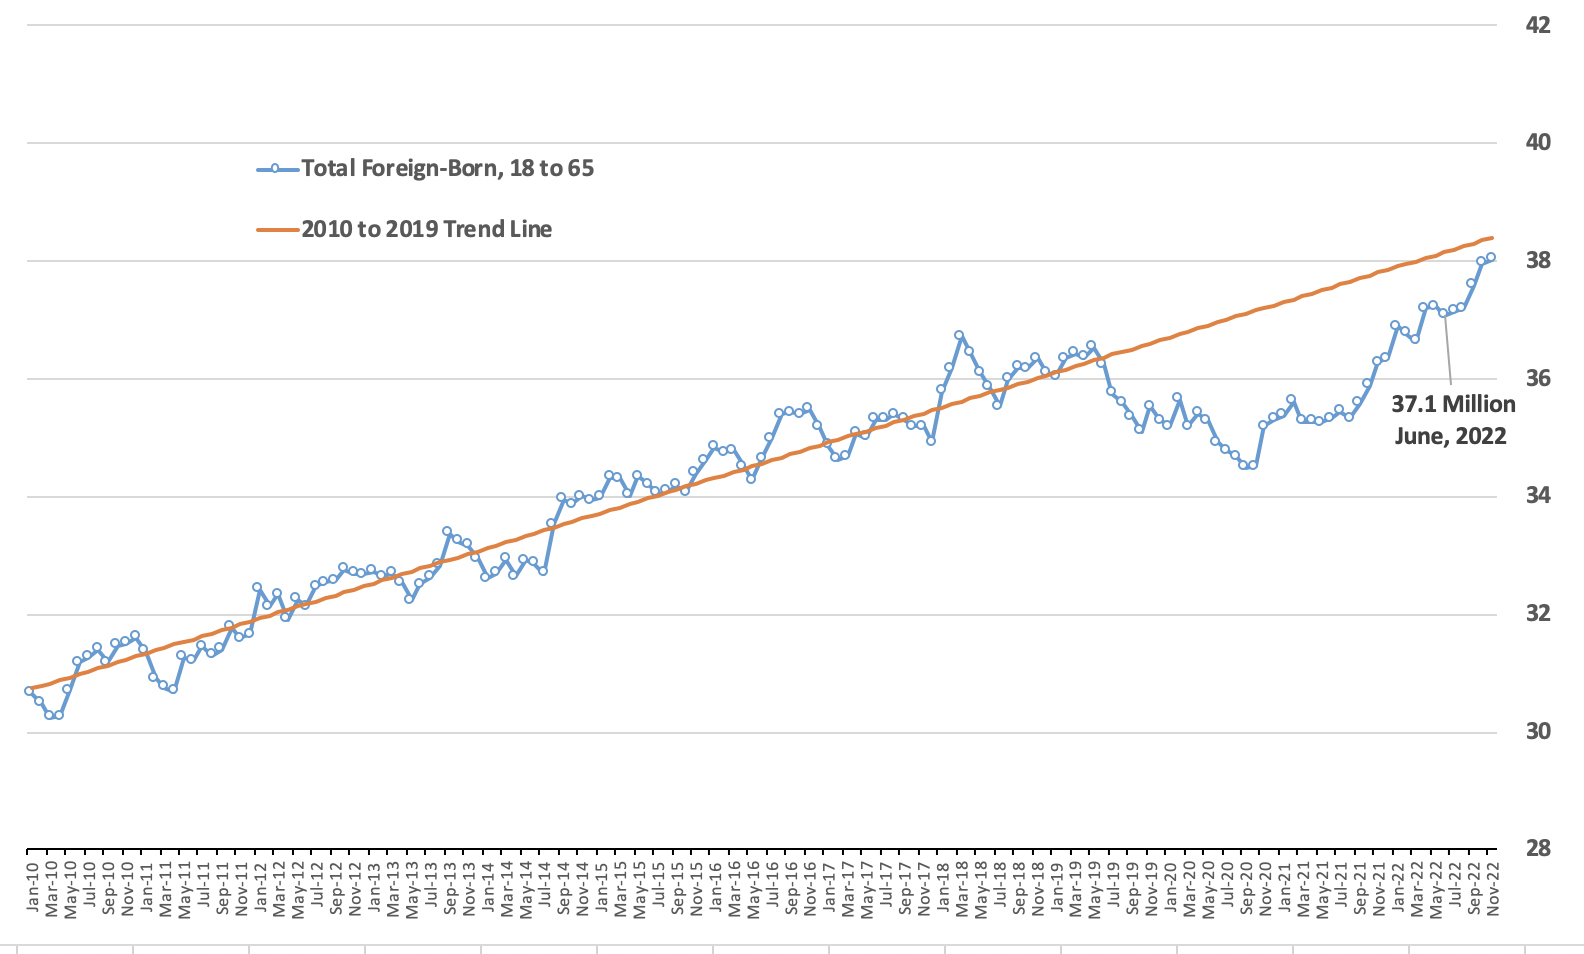
Matching Peri and Zaiour. Figure A1 in this appendix is directly taken from the Bloomberg News article from October 5, 2022, which apparently was generated by Peri and Zaiour. Appendix Figure A2 is our attempt to match that figure using the public-use CPS files from January 2010 through June 2022. For reasons we cannot explain, our figure does not match theirs. To be clear, Figure A2 shows the number of immigrants ages 18 to 65 from January 2010 to June 2022, which is how Peri and Zaiour define the working age. The most obvious difference between Figures A1 and A2 is that in June 2022 we find 37.1 million immigrants ages 18 to 65 in the CPS, yet their figure seems to show more than 38 million. So our attempt to replicate Peri and Zaiour’s analysis shows the number of working-age immigrants is 1.1 million below the trend line. This is not trivial, but still a good deal less than the 1.7 million they report. If we project out to November 2022 using the pre-pandemic trend (2010 to 2019) we get 38.4 million immigrants 18 to 65, which is only 370,000 above the actual number of 18- to 65-year-old immigrants that month. The number of “missing”, to use their term, working-age immigrants is pretty modest by November of 2022 relative to an overall U.S. labor force of 160 million.
Since we cannot match their results and we are not looking at actual workers, it is unclear what to make of Figure A2. We have emailed both authors and asked about the discrepancy between our results and theirs. As of this writing neither has responded. If they do respond, we will update this section of the report. We think the reason for the difference is that they may have used a non-standard definition of the foreign-born, but we are uncertain.14
Figure A1. |
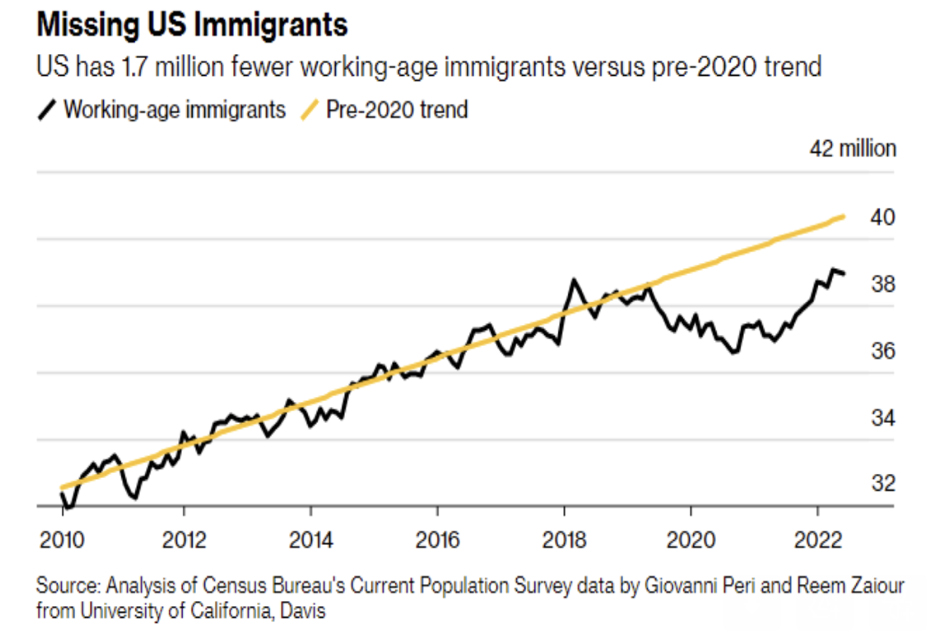 |
Figure A2. Using working-age immigrants (18 to 65), rather than actual workers, still shows that the number almost matches the 2010 to 2019 trend line by November 2022 (in millions). |
 |
Source: January 2010 to 2022 November public-use Current Population Survey. |
End Notes
1 The term “immigrant” has a specific meaning in U.S. immigration law, which is all those inspected and admitted as lawful permanent residents. In this analysis, we use the term “immigrant” in the non-technical sense of the word to mean all those who were not U.S.-citizens at birth.
2 The same figures can be found in Table A-7 of the employment situation report from the Bureau of Labor Statistics.
3 It is certainly possible to use different time periods to generate trend lines in the growth of immigrant workers. Alternative trend lines would, of course, yield different figures for November 2022. If we used the first three years of the Trump administration, 2017 to 2019, then the trend line would produce 29.8 million foreign-born workers, roughly 150,000 above the actual number in November 2022. If we used the five years before Covid-19 (2015 to 2019), we would get 29.68 million immigrant workers, just slightly above the 29.60 million actual workers.
4 We think it is because they wanted to look at every month since 2010 and did not wish to seasonally adjust the figures, which in fairness to them is not easy. In fact, as best we can tell the BLS has not made it entirely clear how they seasonally adjusted the numbers during Covid.
5 The share of the U.S.-born ages 16 to 24 in the labor force declined significantly from 2000 to 2010 and then just never improved, even as the economy recovered from the 2007-2008 Great Recession. In November 2022, just 54.9 percent were in the labor force compared to 65 percent in 2000.
6 It should be noted that the seeming sudden falloff in the size of the U.S.-born population in 2021 and 2022 is likely a statistical artifact of the way the data is weighted by the Census Bureau, which we discuss at length in end note 8. The U.S.-born population ages 16 to 64 almost certainly grew slightly or at least did not decline during this time period. This issue should not impact the percentages reported in this analysis, but it can impact the overall size of the U.S.-born population. A larger U.S.-born population would mean that the number of missing native-born American workers is somewhat larger than the 6.5 million shown in the figure.
7 Some research indicates that emigration in the recent past was even higher.
8 Technically, the monthly CPS also shows that the foreign-born population grew more than twice as fast as the U.S.-born population since the start of the Biden administration. However, given the way the data is weighted it is not really possible to compare the relative growth rates of the two populations, especially within the same year. The CPS shows that the U.S.-born population grew just 0.03 percent (79,000), while the foreign-born population grew 7.6 percent or 3.4 million January 2021 to November 2022. This seeming lack of growth in the U.S.-born is due to the methodology of the CPS. Like all modern surveys, the CPS is weighted to reflect the size and composition of the nation’s population. The survey is controlled to a total target population each month that is basically pre-determined — reflecting what the Census Bureau believes is the actual size and composition of the population across demographic characteristics carried forward each month. Each January, the weights are readjusted to reflect updated information about births, deaths, and net international migration. Though the weighting process is multi-stage and very complex, the key demographic characteristics used to weight the survey are race, Hispanic origin, sex, and age. Nativity is not one of the characteristics used in weighting. This means that the identification of the foreign-born reflects what survey respondents tell interviewers, much like employment status or educational attainment. Given that respondents can only be either U.S.- or foreign-born and the survey is controlled to a target population, an increase in foreign-born respondents makes the U.S.-born population smaller. As a result, it is not really possible to look at the relative growth in the two populations within the same calendar year. This is somewhat resolved in January each year when the weights are readjusted after more information becomes available. In fact, if we want to get some idea of how much the U.S.-born population is growing, we can compare January 2021 to January 2022. Doing so shows a 1.1 million increase in the U.S.-born population and this is probably a more reasonable picture of the growth in this population.
9 The BLS reports that response rates to the CPS after March 2020 were lower than prior to Covid-19, though rates have improved since hitting a low in June 2020. These lower rates increase the sampling error of the survey. It is not known if this problem had any specific impact on estimates of the foreign-born in the data. However, in June 2020, when the problem was most pronounced, BLS stated that “Although the response rate was adversely affected by pandemic-related issues, BLS was still able to obtain estimates that met our standards for accuracy and reliability.” This is in contrast to the 2020 American Community Survey, which is the other large survey collected by the Census Bureau that identifies the foreign-born.
10 We define regions in the following matter: East Asia: China, Japan, Korea, Mongolia, Cambodia, Indonesia, Laos, Malaysia, Philippines, Singapore, Thailand, Vietnam, Burma, Asia NEC/NS (Not elsewhere classified or not specified); Indian Subcontinent: India, Bangladesh, Bhutan, Pakistan, Sri Lanka, Nepal; Middle East: Afghanistan, Iran, Iraq, Israel, Palestine, Jordan, Lebanon, Saudi Arabia, Syria, Turkey, Kuwait, Yemen, United Arab Emirates, Azerbaijan, Uzbekistan, Kazakhstan, Northern Africa, Egypt/United Arab Rep., Morocco, Algeria, Sudan, Libya, and Middle East NS; Sub-Saharan Africa: Ghana, Nigeria, Cameroon, Cape Verde, Liberia, Senegal, Sierra Leone, Guinea, Ivory Coast, Togo, Eritrea, Ethiopia, Kenya, Somalia, Tanzania, Uganda, Zimbabwe, South Africa (Union of), Zaire, Congo, Zambia, and Africa NS/NEC. Unless otherwise specified; Europe: Denmark, Finland, Iceland, Norway, Sweden, United Kingdom, Ireland, Belgium, France, Netherlands, Switzerland, Greece, Italy, Portugal, Azores, Spain, Austria, Czechoslovakia, Slovakia, Czech Republic, Germany, Hungary, Poland, Romania, Bulgaria, Albania, Yugoslavia, Bosnia and Herzegovina, Croatia, Macedonia, Serbia, Kosovo, Montenegro, Estonia, Latvia, Lithuania, Other USSR/Russia, Ukraine, Belarus, Moldova, USSR NS, Cyprus, Armenia, Georgia, and Europe NS; Oceania/Elsewhere: Australia, New Zealand, Pacific Islands, Fiji, Tonga, Samoa, Marshall Islands, Micronesia, Other, NEC, North America NS, Canada, Americas NS/NEC and unknown; Central America: Belize/British Honduras, Costa Rica, El Salvador, Guatemala, Honduras, Nicaragua, Panama, Central America NS.; Caribbean: Cuba, Dominican Republic, Haiti, Jamaica, Bahamas, Barbados, Dominica, Grenada, Trinidad and Tobago, Antigua and Barbuda, St. Kitts-Nevis, St. Lucia, St. Vincent and the Grenadines, and the Caribbean NS; South America: Argentina, Bolivia, Brazil, Chile, Colombia, Ecuador, Guyana/British Guiana, Peru, Uruguay, Venezuela, Paraguay, and South America NS.
11 The margins of error shown in Figure 2 are based on standard errors calculated using parameter estimates, which reflect the survey’s complex design. To the best of our knowledge, neither the BLS nor the Census Bureau has provided parameter estimates for the general population in the monthly CPS, so we use those for the labor force.
12 The average increase for Obama’s first term reflects growth in the foreign-born population between January 2009 and December 2012 of 2.76 million divided by 47 months to reflect the changes that occurred after January 2009 when he took office. (Although each presidential term lasts 48 months, there are only 47 monthly changes in the data in a single term, unless we count the change from the December before an administration begins to January of the next year when they take office.) The average increase for Obama’s second term reflects growth in the foreign-born population between January 2013 and December 2016 of 3.56 million divided by 47 months. For Trump’s term before Covid, the average increase reflects growth in the foreign-born population between January 2017 and February 2020 (before Covid-19) of 1.57 million divided by 37 months. We chose February 2020 to reflect pre-Covid growth in the foreign-born population because Covid arrived in a big way in March of that year. For Biden, the average reflects growth in the foreign-born population between January 2021 and November of 3.4 million divided by 22 months. Of course, dividing by 48 months for each of Obama’s terms, 38 months for Trump’s time in office through February 2020, and for 23 months for President Biden produces very similar monthly averages: 57,000 for Obama’s first term, 74,000 for his second, 41,000 for Trumps first 38 months, and 149,000 for Biden’s first 23 months.
13 The CPS does not include the institutionalized population, which is included in the decennial census and American Community Survey (ACS). The institutionalized are primarily those in nursing homes and prisons. We can gauge the impact of including the institutionalized when calculating the foreign-born percentage by looking at the public-use annual ACS, which does include the institutionalized. At the time of this writing, the 2021 public-use ACS is the most recent ACS available. In 2021, immigrants (legal and illegal) were 13.65 percent of the total population in the ACS if the institutionalized are included and 13.73 percent when they were not included — a .08 percentage-point difference. The distribution of immigrants across the institutionalized and non-institutionalized changes very little from year to year, so the foreign-born share of the population in November 2022 was likely somewhat less than one-tenth of one percentage point lower if the institutionalized were part of the CPS.
14 Almost all research on the foreign-born using Census Bureau data uses the citizenship variable to distinguish the U.S.-born from the foreign-born. The U.S.-born, sometimes referred to as the native-born, in the citizenship variable are: Category 1 native, born in the United States; Category 2 native, born in Puerto Rico or outlying area; Category 3 native, born abroad of American parent or parents. Immigrants or the foreign-born are: Category 4 foreign born, U.S. citizen by naturalization; and Category 5 foreign-born, not a U.S. citizen. A large share of researchers download their data from the University of Minnesota’s IPUMs web site. The citizenship variable at the site can be found here. It is possible that Peri and Zaiour included value 3 (born abroad of American parents) with the foreign-born but we are unsure of this.
