Watch Video Updates from the U.S. - Mexico Border
Steven A. Camarota is the director of research and Karen Zeigler is a demographer at the Center.
This analysis represents our first attempt to estimate the illegal immigrant population, also referred to as the unauthorized or undocumented, using the monthly Current Population Survey (CPS) or “household survey”. We hope to further refine our methods in the future. We estimate that in January of 2022 the illegal immigrant population stood at 11.35 million — a 1.13 million increase over January 2021 when President Biden took office and the ongoing border surge began. Our preliminary estimate for February is 11.46 million. However, our January and February 2022 estimates are not substantially different from our January 2019 estimate of 11.48 million, before the pandemic began. The estimated size and growth of the illegal immigrant population are important because, unlike border apprehension figures, the number of illegal immigrants living in the country is what ultimately determines their impact. The CPS also shows that the total foreign-born population (legal and illegal together), reached 46.7 million in February 2022, a new record high, and an increase of 1.7 million since January 2021.
The Department of Homeland Security, whose methodology we base our analysis on, has illegal estimates only through January 2018. Part of the reason for this is that they, like other researchers, rely on the Census Bureau’s annual American Community Survey (ACS) to generate their estimates of illegal immigrants. The ACS is a larger survey than the CPS, producing more statistically robust estimates; however, it is only released once a year many months after the data is collected. Moreover, the Census Bureau reports the 2020 ACS was not accurate due to the pandemic. Using the monthly CPS allows us to produce timely estimates that reflect current conditions.
Among the findings of our analysis:
- We estimate that in January 2022 there were 11.35 million illegal immigrants in the country — a 1.13 million increase over the 10.22 million in January 2021. Our preliminary estimate for February of this year is 11.46 million.
- The 10.22 million in 2021 represented a significant decline from the 11.48 million illegal immigrants we estimated for January 2019. However, the illegal-immigrant population in January and February 2022 is similar to the number in January 2019.
- While the current number of illegal immigrants in the country has returned to pre-pandemic levels, if current trends are allowed to continue the number will soon surpass the number before Covid-19.
- The statistical margin of error in our illegal immigrant estimates in 2022 is ± 270,000, assuming a 90 percent confidence level. However, as with any estimate of illegal immigrants, there is also non-statistical error in these numbers.
- The monthly CPS also shows that the total foreign-born population (legal and illegal together) grew to 46.7 million in February 2022, a new record high in American history and an increase of 1.7 million since January 2021.
- The margin of error for the total foreign-born population in 2022 is about ±490,000, assuming a 90 percent confidence level.
- To place the 1.7 million growth in the total foreign-born population over the last 13 months in perspective, in the 48 months of the Trump presidency (January 2017 to December 2020), the total foreign-born population increased by 1.5 million.
- Illegal immigrants account for more than one million (about two-thirds) of the increase in the total foreign-born population since January of 2021.
- For the illegal-immigrant population or the foreign-born population in general to grow, new arrivals must exceed emigration and deaths. Births to the foreign-born, legal or illegal, in the U.S. do not add to the illegal immigrant population or the overall foreign-born population as all children born in the U.S. are by definition native-born.
Overview
The Foreign-Born and Illegal Immigrants. In this analysis, we follow the example of most government publications and use the term “foreign-born” to mean all persons residing in the United States who were not U.S. citizens at birth, primarily naturalized citizens, lawful permanent residents, long-term temporary visitors (e.g. guestworkers and foreign students) and illegal immigrants. We use the term “illegal immigrant” to describe people living in the United States without authorization, primarily because they entered without inspection (EWI) or overstayed a temporary visa.1 Illegal immigrants are a sub-population of the total foreign-born and are sometimes referred to as “undocumented”, “unauthorized”, or as “illegal aliens”.
The Current Population Survey. The public-use monthly Current Population Survey (CPS) used in this analysis to measure the total foreign-born and illegal-immigrant population is one of the nation’s largest and oldest surveys.2 It is sometimes referred to as the household survey and is collected by the U.S. Census Bureau for the Bureau of Labor Statistics (BLS), primarily to measure employment every month. The CPS surveys the non-institutionalized civilian population and is weighted by the Census Bureau to reflect the U.S. population.3 The Census Bureau is very clear that illegal immigrants are included in the decennial census and its various surveys. Also, the Bureau of Labor Statistics acknowledges the inclusion of illegal immigrants in the monthly CPS. To be clear, the data the Census Bureau collects does not specifically identify illegal immigrants; rather researchers use the information in the survey, and other information from outside the survey, to estimate the population living in the country without authorization.
Using DHS’s Approach to Estimate the Illegal Population. We explain in detail how we arrive at our estimates in the methodology section, but here it should be understood that we follow the approach of the Department of Homeland Security Office of Immigration Statistics (DHS OIS). DHS estimates of the illegal immigrant population are for January of each year and we do the same through January 2022. We also carry our estimate forward one month to February of 2022 in order to create the most up-to-date estimate possible. This number is preliminary because of the limited availability of administrative data.4 For its estimates of illegal immigrants, DHS uses the legal foreign-born number based on administrative data and then subtracts it from the total foreign-born (legal and illegal together) in the Census Bureau’s annual American Community Survey (ACS). The difference or “residual” represents the baseline illegal population that is then adjusted for undercount. We follow this example, with the exception of using the monthly CPS. This is what allows us to produce much more up-to-date estimates, as the CPS is released only a few weeks after its collection. In contrast, the ACS is released only once a year and the Census Bureau reports it was not accurate for 2020. In our view, the monthly CPS represents the only way of creating estimates of the illegal immigrant population that reflect current conditions.
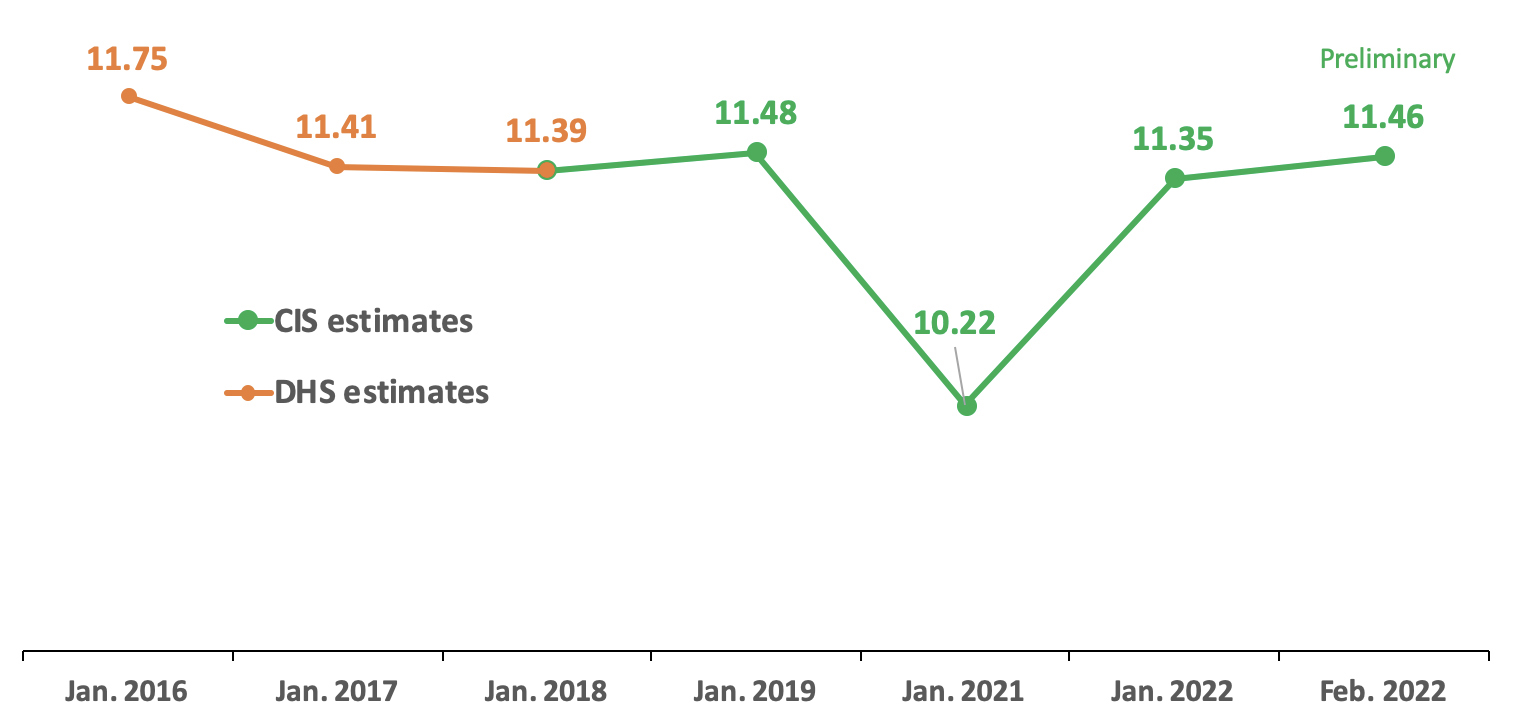
Estimate of Illegal Immigrants. Figure 1 reports our estimates of the illegal immigrant population from 2019 to 2022 and those from DHS for 2016 to 2018. It shows that in January 2019, we estimated that 11.48 million illegal immigrants lived in the United States, little changed from DHS’s 11.39 million for 2018. We are not able to estimate illegal immigrants for 2020 for reasons explained in the methodology section. But we do find that by January 2021 the illegal-immigrant population had fallen substantially to 10.22 million, a decline of nearly 1.26 million compared to 2019. However, we find that the illegal-immigrant population rebounded dramatically to 11.35 million by January 2022, and to 11.46 million if we use our preliminary February estimate. This means that the illegal population grew by over one million in the year since President Biden took office and the ongoing border surge began. However, our results also mean that in January and February 2022 the number of illegal immigrants was not substantially different from our January 2019 estimate. That said, if present trends continue it is very likely that the number of illegal immigrants will grow larger than before Covid-19.
Figure 1. DHS and CIS Estimates of the Illegal Immigrant Population, January 2016 to February 2022 (in millions) |
 |
Source: Department of Homeland Security and Center for Immigration Studies estimates of the illegal immigrant population. |
The statistical margin of error in our illegal immigrant estimate for January and February 2022 is about ±270,000, assuming a 90 percent confidence level.5 In addition to statistical error in our estimate, there are other sources of error that are not associated with using Census Bureau survey data. In the methodology section of this analysis, we discuss several possible areas of non-statistical error in our estimates.
Indirect Evidence that the Illegal Population Grew. One may wonder if the decline and rebound in the illegal immigrant population we report is reasonable. We do find validation for the fall-off and then rapid growth by looking at populations that comprise a large share of illegal immigrants living in the United States. Such simple trends have the advantage of not being dependent on assumptions about the arrival and departure of the legal foreign-born population or the undercount of legal and illegal immigrants in the data. The top line in Figure 2 shows the number of non-citizens in the January CPS living in the United States who indicated they arrived in 1980 or later. The vast majority of illegal immigrants should show up in the data as post-1980 non-citizens.6 Figure 2 shows that this population declined significantly in 2021 and then rebounded dramatically in 2022, which matches what we find for illegal immigrants. The lower line in Figure 2 also shows the same trend for non-citizen Hispanics. In short, populations in the CPS that overlap with illegal immigrants show the same pattern as our estimate for illegal immigrants. While not surprising, it does add support to our results.
Figure 2. Post-1980 non-citizens and non-citizen Hispanics are populations that substantially overlap with illegal immigrants and they both show a decline in 2021 and a rebound in 2022. (in millions) |
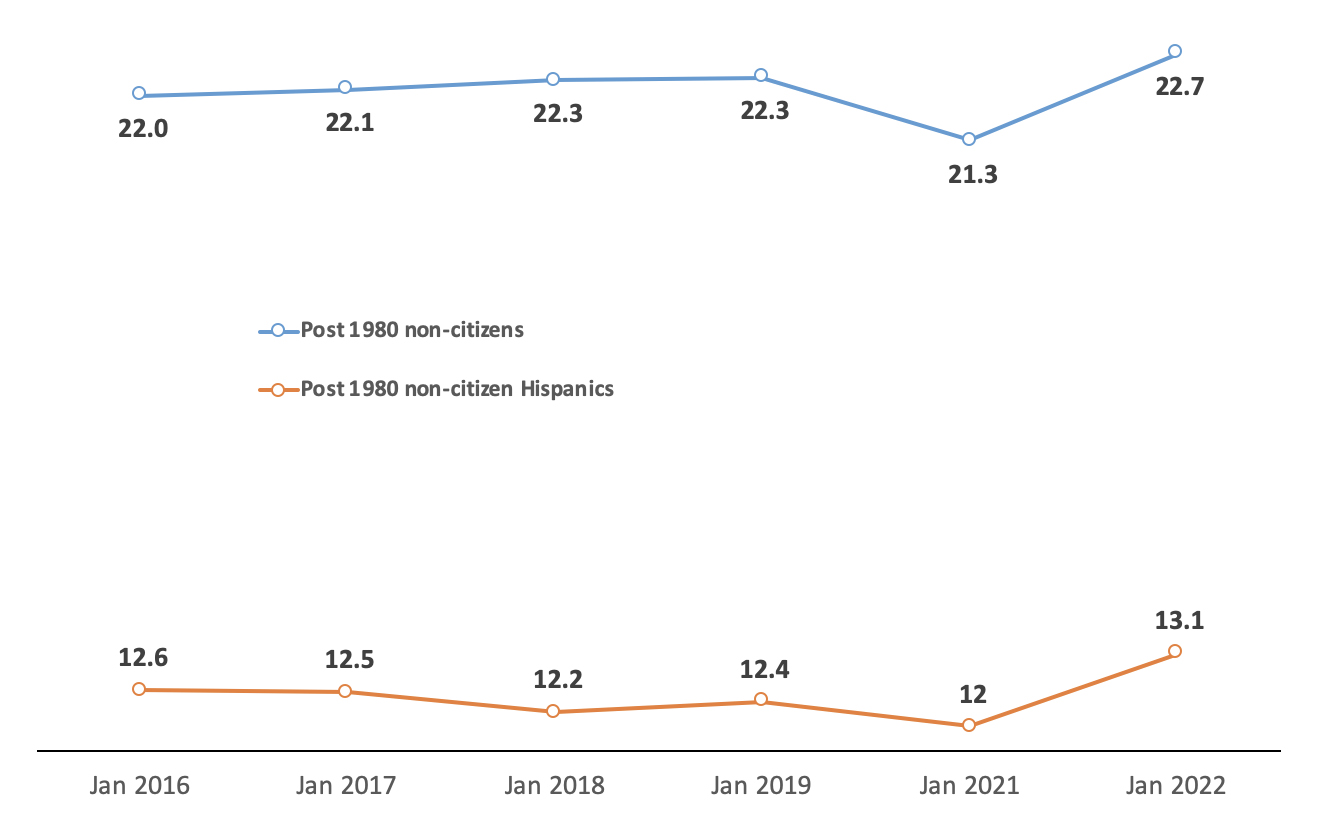 |
Source: Public-use files of the January 2016 to 2022 Current Populaton Survey. We are unable to estimate the illegal population for 2020. See text for details. |
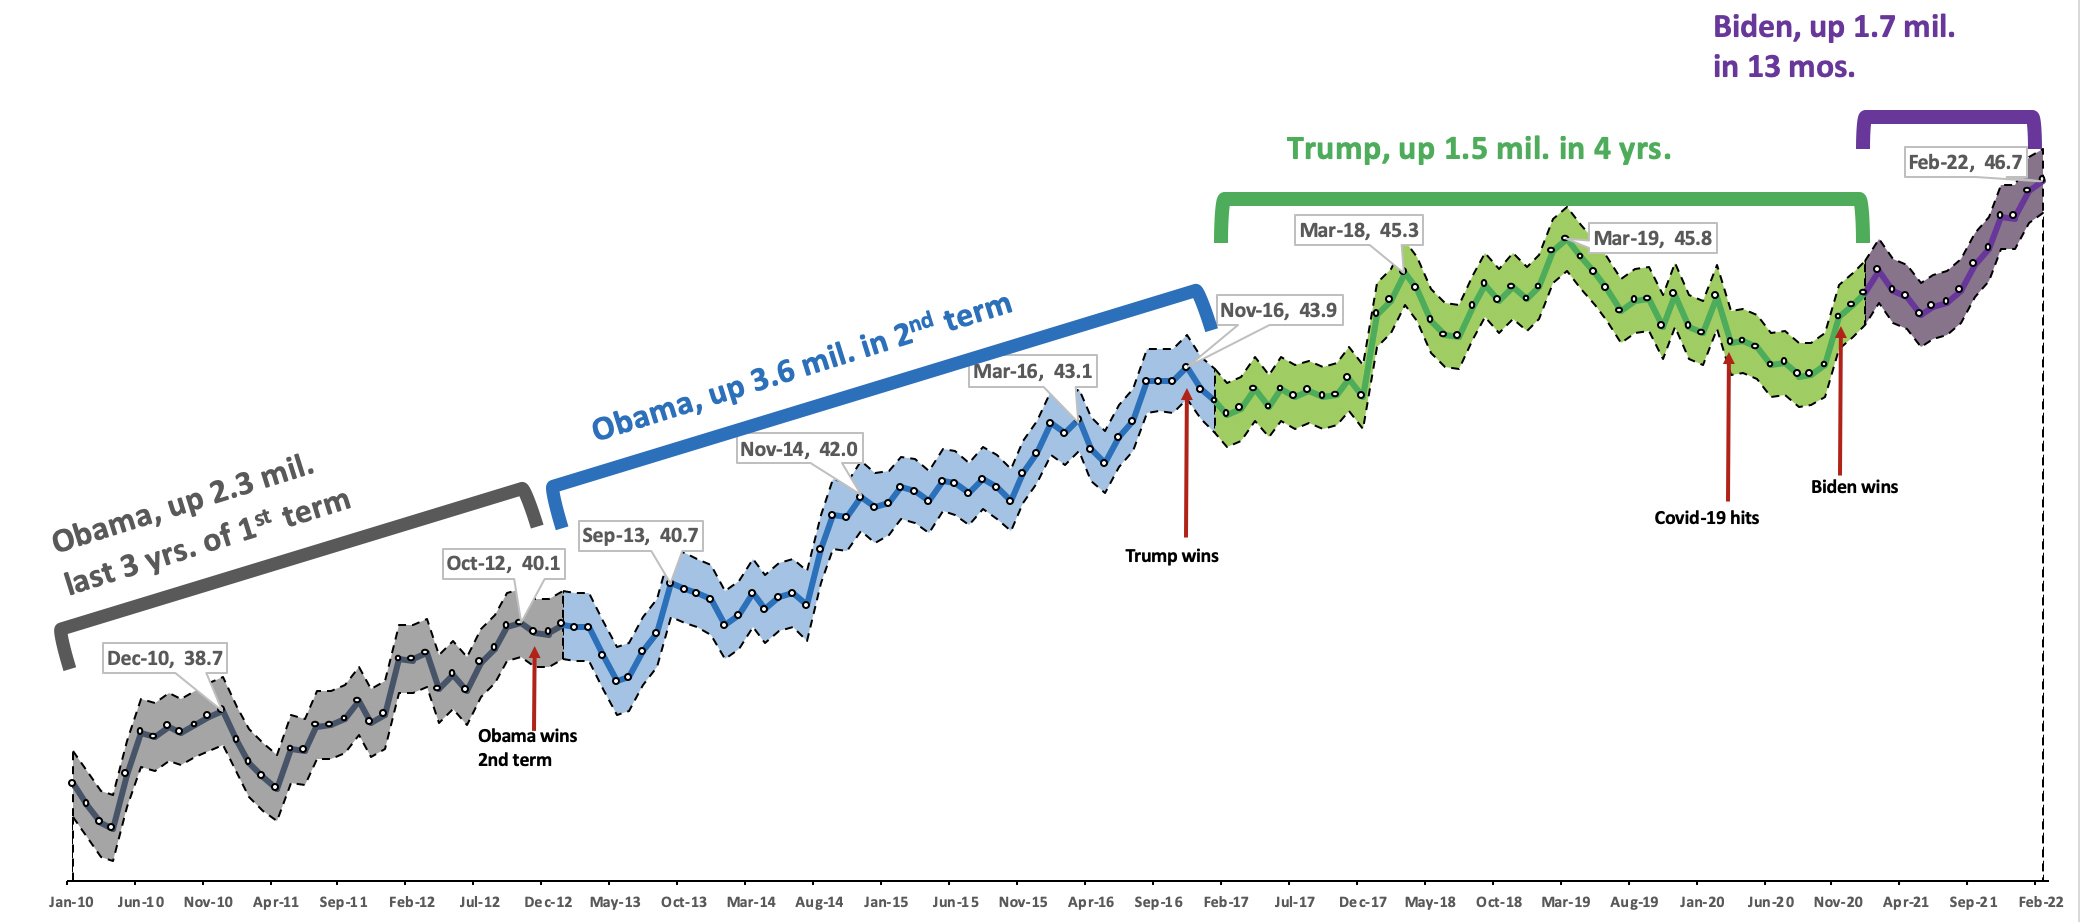
The Overall Foreign-Born Population. Figure 3 shows the total foreign-born population (legal and illegal immigrants together) living in the United States from January 2010 to February 2022, along with margins of error. As the figure shows, there is significant month-to-month variation. For the overall foreign-born population, the margin of error in 2022 is about 490,000, assuming a 90 percent confidence level. This means numerical fluctuations over short periods of time can be quite large, making it necessary to compare changes over longer periods of time when drawing conclusions about trends.
Figure 3. There is a lot of variation from month to month, but the foreign-born population grew much more slowly during Trump's presidency than during Obama's or Biden's. (January 2010 to February 2022, in millions) |
 |
Source: January 2010 to February 2022 Current Population Survey. Shaded area shows the margins of error around the point estimates, assuming a 90% confidence level. |
Figure 3 shows that the foreign-born population grew much less during the four years of the Trump administration than during the four years of Obama’s second term — 1.5 million for Trump and 3.6 million for Obama. The figure also shows that the 1.7 million increase in just the first 13 months of the Biden administration already exceeds the growth in the foreign-born during all 48 months of the Trump administration. Of course, the Trump administration includes the Covid-19 pandemic. But confining the analysis to only the first 36 months of the Trump administration (January 2017 to December 2019), before Covid-19, shows growth of just 1.1 million. This compares to 2.6 million in President Obama’s first 36 months (January 2013 to December 2015).
The dip after Covid hit indicates that the policies adopted at the borders due to the pandemic, coupled with the dramatic slowdown in the processing of visas overseas and a fall-off in international travel caused the total foreign-born population to decline through the middle of 2020, hitting a low of 43.8 million in August and September of 2020. The foreign-born population has since rebounded, increasing by 2.9 million to 46.7 million in February of this year. It may seem strange that the foreign-born number went down simply because fewer legal and illegal immigrants arrived, but it must be remembered that each year natural mortality is roughly 300,000 and some number go home — voluntarily or due to deportation. We have previously estimated out-migration at nearly one million annually for the total foreign-born population. It is also worth mentioning again that all births to the foreign-born add only to the native-born population.
Growth One Year to the Next. Figure 4 shows the change in the total foreign-born population when compared to the same month in the prior year. The figure shows that the immigrant population began to grow, relative to the same month in the prior year, in December 2020, and has continued to increase every month thereafter. As a share of the total U.S. population, the foreign-born represented 14.2 percent in February, the highest percentage in 112 years. Figure 5 shows that when the Census Bureau last projected the foreign-born population in 2017, it estimated it would reach 14.9 percent of the population in 2027, a new record. Based on the latest data from the CPS, it is possible that the share will hit a new record even before 2027.
Figure 4. Change in Total Foreign-Born Population Compared to the Same Month in the Prior Year, January 2011 to February 2022 (in thousands) |
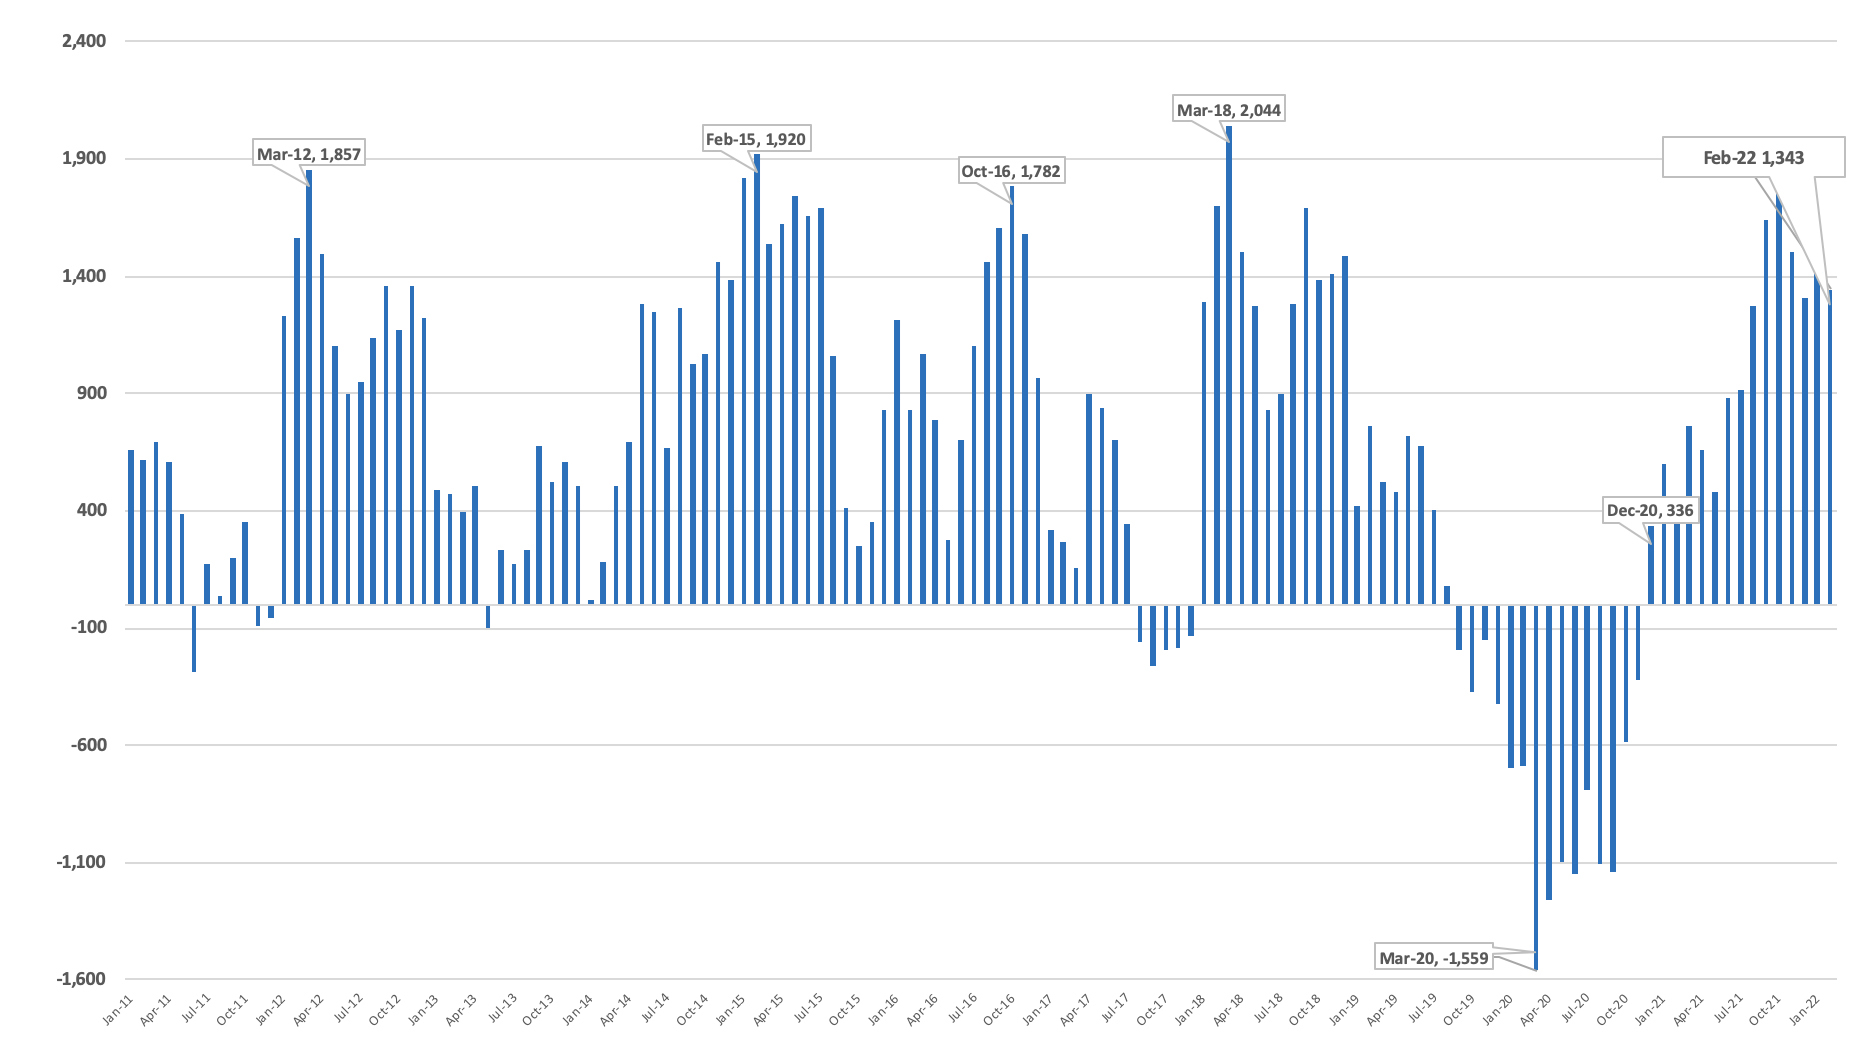 |
Source: January 2010 to February 2022 Current Population Survey. |
Figure 5. Foreign-Born in the U.S., Number and Percent, 1900-2022, plus Census Bureau Projections to 2060 |
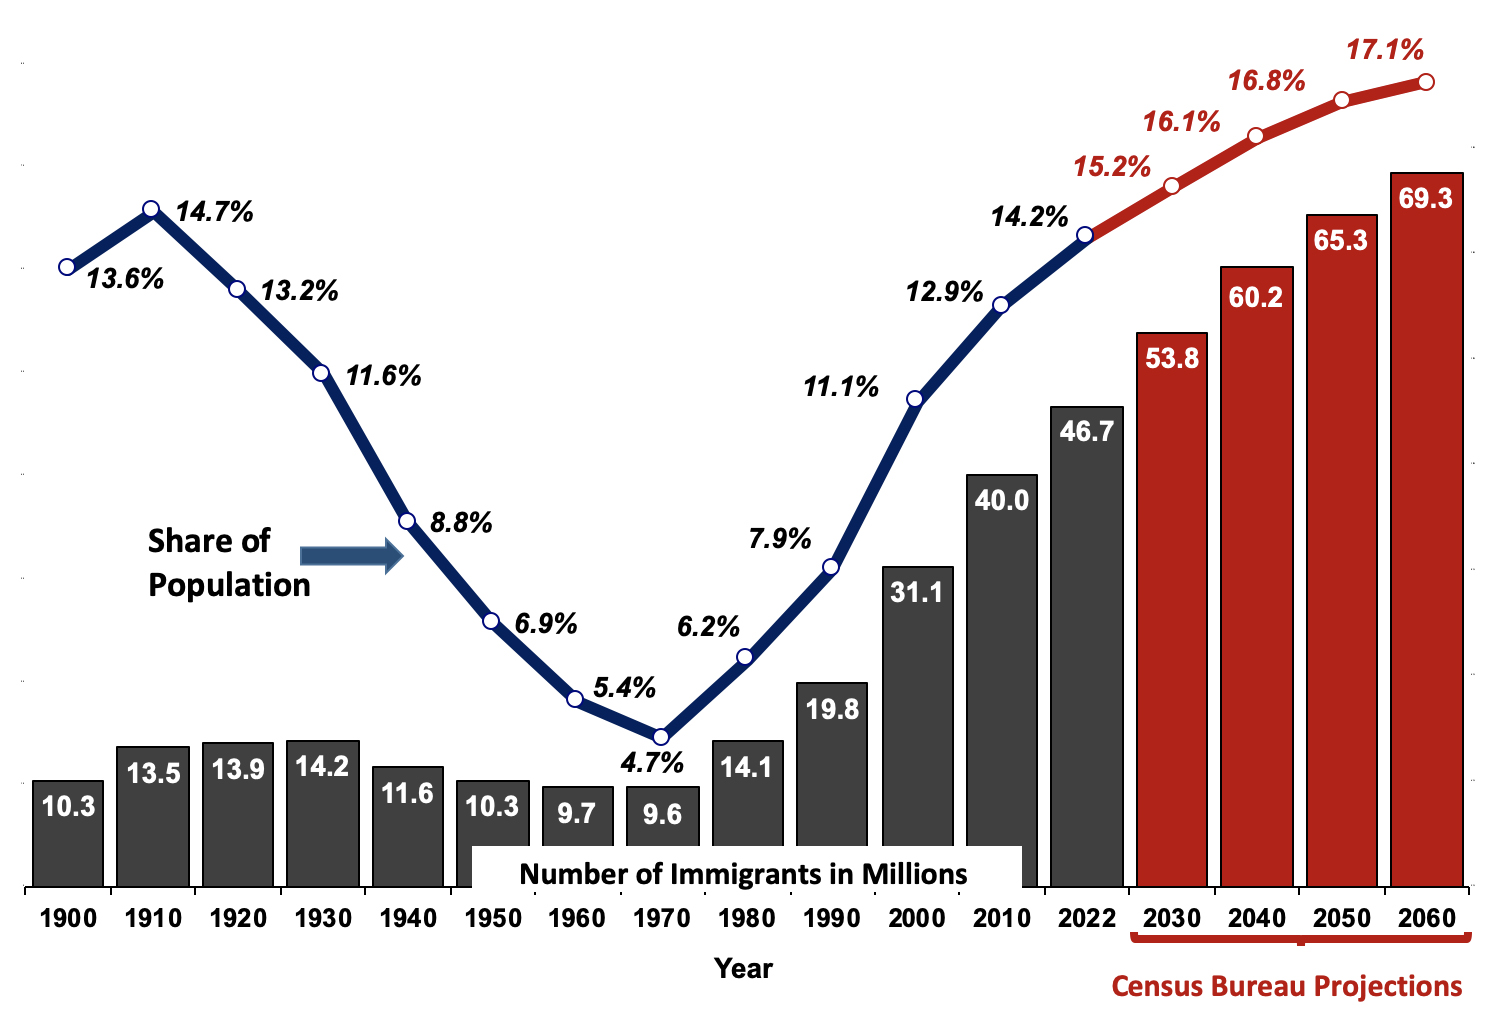 |
Source: Decennial Census for 1900 to 2000, American Community Survey for 2010, February Current Population Survey (CPS) for 2022. The CPS does not include the institutionalized. For 2030 to 2060, see Census Bureau projections through 2060, reissued in September 2018, Table 8. |
What’s Driving the Recent Growth? A number of factors likely contributed to the trends we see in Figures 1 through 4. Turning first to the fall-off in the number of illegal immigrants in the country and then the dramatic rebound, in part this likely reflects the downturn and rebound in the U.S. economy as Covid-19 unfolded. In terms of policy, the decline was likely due to changes that limited the ability of immigrants to enter in response to the pandemic. The recent growth in the illegal immigrant population seems to be primarily driven by the large surge of illegal immigrants at the southern border caused to some extent by the perception, based on his campaign promises, that President Biden would curtail immigration enforcement. The Biden administration’s decision to suspend most interior enforcement and the decline in 2020 and the further fall-off in 2021 of removals and enforcement operations certainly makes it more likely that fewer illegal aliens will go home and more will come. Moreover, the ending of the Remain in Mexico policy for many asylum applicants, the scaling back of Title 42 expulsions in FY 2022, and continuing efforts by the White House and some in Congress to pass a bill legalizing illegal immigrants have all likely made illegal immigrants feel safer, reducing emigration and encouraging more new illegal immigration.
As for the overall foreign-born population shown in Figures 3 and 4, it is clear from our analysis that illegal immigration explains a significant share of the increase. As we have seen, the number of illegal immigrants grew 1.13 million between January 2021 and January 2022, accounting for about two-thirds of the increase in the total foreign-born population. Comparing January 2021 to our preliminary estimate for February 2022 shows illegal immigrants may have accounted for closer to three-fourths of the increase. But legal immigration has also increased due to the restarting of visa processing at American consulates, allowing many more permanent immigrants (green card holders) to arrive from abroad than was true during the pandemic. The same is true of long-term temporary immigration (e.g., guestworkers and students). While illegal immigration seems to account for much of the recent increase in the total foreign-born population, the number of legal immigrants has also increased significantly.
Conclusion
We estimate that in January 2019, the number of illegal immigrants in the country was 11.48 million, similar to DHS’s estimate of 11.39 million for 2018. By January 2021, we estimate the number had dropped to 10.22 million as a result of travel restrictions and other policies imposed as a result of Covid-19 and perhaps the deterioration in the U.S. economy. The number then rebounded to 11.35 million by January 2022 — a 1.13 million increase since President Biden took office at the beginning of 2021. This means that growth in the illegal immigrant population accounted for very roughly two-thirds of the 1.6 million increase in the total foreign-born population (legal and illegal immigrants together) in President Biden’s first year in office (January 2021 to January 2022). The share of growth in the total foreign-born population accounted for by illegal immigrants is even larger if we compare the number in January 2021 to our preliminary February 2022 estimate of 11.46 million. What’s more, the total foreign-born population reached 46.7 million in February of this year, a new record high in American history.
While the large swings in the illegal-immigrant population may seem unlikely, we find indirect evidence in the monthly CPS that the number of illegal immigrants fell between 2019 and 2021 and then grew dramatically by 2022. The number of both non-citizens and non-citizen Hispanics declined then rebounded over this time period. Changes in these populations should be highly correlated with trends in the illegal-immigrant population. We think the recent increase in illegal immigrants reflects policy changes by the Biden administration and the lessening of the Covid-19 pandemic, as well as the recovery of the economy.
Methodology
Methods for Estimating Illegal Immigrants
Using DHS’s Approach. To arrive at an estimate of the illegal immigrant population, we primarily rely on the approach used by the Department of Homeland Security’s Office of Immigration Statistics (DHS OIS). DHS has been estimating and revising its methods for some time, and its most recent estimate is for January 2018. Our reliance on DHS’s approach should not be taken as an indication that we think it is much better than the approaches used by such organizations as the Center for Migration Studies or the Pew Research Center. Rather, we use DHS’s approach because its method is straightforward and is the easiest to replicate based on the information that has been publicly released. Its approach first estimates the legal foreign-born population based on administrative data and then subtracts that number from the more recently arrived foreign-born population in the ACS. The difference or “residual” after the legal immigrant population is removed represents the basis of the estimate, which is then adjusted upward to reflect the undercount of illegal immigrants in the survey. The key difference between our method and that used by DHS is that we use the monthly CPS rather than the ACS.
Why Use the Current Population Survey. As already discussed, the primary advantage of using the monthly CPS is that it allows us to generate timely estimates, potentially in the month immediately after the data is collected because the survey is released so quickly. The Covid-19 pandemic did create significant challenges for the Census Bureau in data collection. The BLS reports that response rates to the CPS after March 2020 were lower than prior to Covid-19, though rates have improved since hitting a low in June 2020.7 Nonetheless, in June 2020 the BLS stated that “Although the response rate was adversely affected by pandemic-related issues, BLS was still able to obtain estimates that met our standards for accuracy and reliability.” The problems with the 2020 ACS are more severe.
Problems with the America Community Survey. In contrast to the monthly CPS, the Census Bureau states that it was “unable to collect information from certain segments of the population” for the ACS in 2020. As a result, it has published relatively little information from that survey. At present, it seems unlikely that the 2020 ACS can be used to estimate illegal immigration. That could change, but it will almost certainly require significant re-weighting and other adjustments to the data that could introduce new issues. At present, the Census Bureau has yet to do so. Prior to the full implementation of the ACS in 2005, some researchers, such as those at the Pew Research Center, used the CPS to measure illegal immigration. But like the Department of Homeland Security, Pew now relies on the ACS to estimate illegal immigrants due to its much larger sample size.
The annual ACS and the monthly CPS are both weighted in a similar fashion, and they both show similarly sized foreign-born populations.8 The ACS is controlled to a July 1 date and the 2019 ACS showed 44.9 million foreign-born individuals in the country, while the July 2019 CPS showed 44.8 million. Which survey better captures this population remains unclear. The key weakness of the CPS is that it has much larger margins of error as a result of its much smaller sample size.9 The ACS samples about 3.5 million households compared to roughly 60,000 for the monthly CPS. This means that the ACS produces more statistically robust estimates and its larger sample also allows for more detailed analyses of the foreign-born, including illegal immigrants. All that said, the lag in the release of ACS data and problems collecting it in 2020 means, in our view, that the monthly CPS is currently the best option for generating estimates of the illegal population that reflect recent conditions.
Administrative Data for New Legal Arrivals. We use several sources to estimate the number of persons added to the legal foreign-born population. Through mid-2021, we use numbers published by the U.S. Census Bureau for new legal permanent resident (LPR) arrivals, those on worker visas, and students.10 After mid-2021 we use data from the DHS OIS from July to September for new LPR arrivals. For new LPRs after September 2021, we use the number of permanent residence visas issued by the State Department. For non-immigrant visa holders, we also use the number issued by the State Department so far in fiscal 2022.11 For refugees through 2019, we use the Yearbook of Immigration Statistics Table 13. After 2019, we use the number of refugee arrivals from Center for Immigration Studies reports in 2020 and 2021, which are both drawn from data released by the Refugee Processing Center. For arrivals in FY 2022 (October 2021 through January 2022), we use data from the Refugee Processing Center. For grants of asylum through 2019, we rely on the Yearbook of Immigration Statistics Table 16. We base the number of asylum grants after 2019 on data published by immigration courts through December 2021.12
Estimating the Legal Foreign-Born Population. The top of Table 1 (line 1) reports the legal permanent foreign-born population in January of each year — primarily naturalized citizens, lawful permanent residents, asylees, and refugees.13 Line 2 is the number of non-immigrants in the country — primarily guestworkers and foreign students. Again, we use January because DHS estimates the illegal population for January of each year. The numbers in green are from the DHS estimate of illegal immigrants for 2018 and from DHS’s 2019 report on the non-immigrant population. The last column in Table 1 carries the figures forward to February 2022.
Table 1. Components of the Estimates of the Illegal | ||||||
| Line | Jan. 2018 | Jan. 2019 | Jan. 2021 | Jan. 2022 | Feb. 2022 | |
| 1 | Legal Permanent Foreign-Born Pop. (green is from DHS)* | 24,390 | 24,833 | 25,867 | 26,425 | 26,499 |
| 2 | Non-Immigrant Pop. (green is from DHS)* | 2,780 | 3,190 | 3,328 | 3,400 | 3,410 |
| 3 | Total (green is from DHS)* | 27,170 | 28,023 | 29,195 | 29,825 | 29,909 |
| 4 | Legal Permanent Foreign-Born Pop. Adjusted for CPS Undercount (#1 x .975) | xxx | 24,212 | 25,220 | 25,765 | 25,837 |
| 5 | Non-Immigrant Pop. Adjusted for CPS Undercount (#2 x .95) | xxx | 3,031 | 3,162 | 3,230 | 3,239 |
| 6 | Total Adjusted for Undercount (#4 + #5) | xxx | 27,242 | 28,382 | 28,995 | 29,076 |
| 7 | Foreign-Born Pop. in CPS Arrived 1980 or Later** | xxx | 38,461 | 38,369 | 40,090 | 40,276 |
| 8 | Estimate of Illegal Pop. in CPS (#7 - #6) | xxx | 11,218 | 9,987 | 11,095 | 11,200 |
| 9 | Adjusted Estimate for Undercount of Illegals (#8 * 1.023) | 11,390 | 11,476 | 10,217 | 11,351 | 11,458 |
* Uses DHS 2018 estimates as a starting point and carries them forward based | ||||||
DHS estimates that in January 2018, the legal foreign-born population (permanent and non-immigrant) that arrived in 1980 or later was 27.17 million (line 3). DHS limits the legal foreign-born to those who arrived in 1980 or later because, as already mentioned, there should not be any (or only a trivial number) of illegal immigrants who arrived before 1980. All illegal immigrants who arrived prior to 1980 should have received legal status with the 1986 Immigration Reform and Control Act (IRCA) or under Section 249 of the Immigration and Nationality Act, which allows very long-term illegal immigrants to receive green cards. We carry the DHS legal foreign-born estimate for 2018 forward using the administrative data discussed above to estimate arrivals, while also factoring in deaths and emigration among the existing legal population. Thus, in January 2022 the legal foreign-born population was 29.83 million and in February it was 29.91 million (line 3).
Undercount of Legal and Illegal Immigrants. The middle of Table 1 (lines 4 through 6) adjusts downward our legal foreign-born population estimates to reflect the undercount in the Current Population Survey of these groups. Line 4 shows the permanent foreign-born population after being adjusted downward.14 Line 5 shows the non-immigrant population after its downward adjustment.15 Line 6 shows the total legal foreign-born population (lines 4 and 5 added together). Line 7 shows the total non-Cuban foreign-born population that arrived in 1980 or later in January (or February 2022 only) using the public-use monthly CPS data.16 Line 8 subtracts the total legal immigrant population in line 6 from the total post-1980 foreign-born population in the public-use monthly CPS. Line 9 adjusts this number upward to reflect the undercount of illegal immigrants in the survey.17 Line 9 reports our illegal immigrant population based on the monthly population from 2019 to 2022. For January 2022, the number is 11.35 million and our preliminary estimate for February is 11.46 million.
Estimates by Other Organizations. In addition to DHS, two of the leading organizations with estimates for the illegal immigrant population are the Center for Migration Studies (CMS) and the Pew Research Center. Like DHS, both organizations base their estimates on the ACS; however, both report lower estimates of illegal immigrants than DHS in recent years.18 Exploring the reasons for these differences between DHS, Pew, and CMS goes well beyond the scope of this analysis. But it is certainly possible to recalibrate our estimates to those of CMS, which has more up-to-date numbers. CMS’s estimate for 2019, which is its most recent, shows an illegal immigrant population that is 90.2 percent as large as our estimate for that year. If we reduce our January 2021 estimate by this amount, it would produce an estimate of 9.21 million. Doing the same for January 2022 would produce an estimate of 10.24 million. The key thing to keep in mind is that adjusting our estimates to match prior CMS results does not change our key finding that the number of illegal immigrants was much lower in 2021 than it was in 2019, while the number in 2022 is much higher than in 2021.
Sources of Non-Statistical Error
Emigration. One of our biggest challenges with estimating the illegal-immigrant population is estimating the legal immigrant population. Assuming DHS’s estimate for this population in 2018 is correct, which is our starting point, there is still the question of how emigration rates may have changed over the intervening four years for the legal foreign-born, particularly as a result of Covid-19. This problem is important and it is acknowledged by DHS in its 2018 report. After discussing the availability of up-to-date mortality data, the report states (on page 11), “but current, nationally representative data necessary to construct similar tables for emigration rates do not exist.” To estimate the emigration of the legal foreign-born population, DHS relies on annual emigration rates of the foreign-born population from 1980 and 1990 as calculated in a 1994 Census Bureau report, which would seem to be quite out of date at this point.19 In our estimates, we assume that the rates used by DHS are essentially correct and that the emigration of the legal population did not change dramatically but instead rose somewhat during the pandemic, and then declined as Covid-19 abated. Clearly, developing emigration rates specifically for the legal foreign-born population that are up to date would be enormously helpful in improving these estimates.
Undercount. The issue of how many foreign-born individuals are missed in Census Bureau data has been debated for a long time. Research showing that the number of illegal immigrants is much higher than the estimates produced by DHS are based on the assumption that a huge share of illegals are simply missed by the Census Bureau so that any estimate based on that data is necessarily too low. As already indicated, we assume that DHS is correct in its estimate of the undercount of the legal, permanent-foreign born population, while we reduce its undercount adjustment for non-immigrants and illegal immigrants because we think the monthly CPS from 2019 to 2022 better captures these populations than the ACS relied on by DHS. DHS states that its undercount adjustment is “based on the overall undercount estimated in the 2000 model”, but it does not provide a citation. This model from 2000 is then applied to the illegal population following an approach developed by Robert Warren that assumes different rates of undercount based on length of stay in the United States. The overall undercount rate is about 4.6 percent for illegal immigrants in DHS’s estimates. Warren is currently the principal researcher estimating illegal immigration for CMS and is a leading expert on estimating illegal immigration.
In an important 2013 article, Warren estimated the undercount of illegal immigrants based in part on a conference paper presented at the 2002 Population Association of America by Marcelli and Ong that looked at foreign-born Mexicans in Los Angeles County in the 2000 census.20 In a more recent April 2021 article, Warren does not indicate that he relied on any new research for his undercount rates. He does make the point that his undercount rate for illegal immigrants is reasonable because it is similar to that of Hispanic males in a 2015 Census Bureau working paper. But that paper is based on a version of the ACS (called the C2SS) collected in 2000. Warren also makes the very reasonable point that he is not underestimating illegal immigrants because his estimate of the number of illegal immigrants eligible for the Deferred Action for Childhood Arrivals (DACA) was actually higher than the number who came forward.21 He makes a similar argument for those covered by Temporary Protected Status. However, it is not clear how representative these populations are. And it is still possible that these populations are larger than implied by the administrative data because fewer of those eligible come forward. All of that said, we know of no alternatives for adjusting the undercount of illegal immigrants in Census Bureau data than those used by DHS or Warren.22 Moreover, as we have written before, we share the perspective that the undercount of illegals in Census Bureau data simply can't be all that large. However, there is no question that this is an area in need of further research.
Administrative Data. In addition to the issues associated with using Census Bureau data, we also have concerns about the availability of administrative data on legal arrivals, especially for the end of 2021 and the beginning of 2022. At present, we have State Department visa issuance data for this time period, but not everyone enters the country soon after getting a visa, though given rules governing use of visas after issuance and pent up demand for entry into the United States, the vast majority of new visa holders almost certainly entered very soon after receiving their visas in recent months. Moreover, we have doubts about the accuracy of the published number of asylum grants by the immigration courts for FY 2022, as mentioned in end note 12. While we do not think these issues would fundamentally change our estimates, they are potential sources of uncertainty.
End Notes
1 Some overstayers or EWIs eventually gain other statuses but are still in the country without authorization. These include, but are not limited to, adjustment of status and suspension of deportation applicants; those granted Temporary Protected Status (TPS), as well as those given withholding of removal and deferred action, including beneficiaries of the Deferred Action for Child Arrivals program (DACA); and parolees. It must be remembered that those with TPS and DACA and other aliens with pending applications, including many released at the border into the country in the last year, are still illegal immigrants and can be described as aliens who are removable, but who are temporarily not subject to removal, under the Immigration and Nationality Act.
2 The “monthly” CPS is the core data used in the CPS and does not include supplemental data collected in March of each year.
3 Each January, the population controls used to weight the CPS are re-adjusted to reflect updated information about births, deaths, and net international migration. The January 2022 adjustment had the effect of increasing the total civilian non-institutionalized population by 973,000. Of course, only a small share of this increase was among immigrants. The adjustments themselves are applied to race, gender, age, and other control variables. Foreign-born is not a control variable and varies based on responses to the survey. The whole point of the adjustments by the Census Bureau is to make the numbers more accurate.
4 Our February estimate is preliminary because administrative data is lacking and we have to project prior trends forward.
5 By statistical margin of error, we mean the interval around our estimate of illegal immigrants based solely on the size of the population in the CPS.
6 We limited the analysis to non-citizens who entered after 1980 as those who came before this date are very unlikely to be illegal immigrants because, as DHS points out in its estimates, Section 249 of the Immigration and Nationality Act and the 1986 Immigration Reform and Control Act (IRCA) of 1986 both should have allowed these very-long-term illegal immigrants to legalize.
7 These lower rates increase the sampling error of the survey. It is not known if this problem had any specific impact on estimates of the foreign-born in the data.
8 In March of each year, the Census Bureau oversamples minorities and asks more questions on a variety of topics such as income and health insurance. The larger March CPS with the additional questions is referred to as the Annual Social and Economic Supplement of the Current Population Survey or ASEC CPS. Like the ACS the ASEC CPS is only released once a year and so cannot be used to produce the most up-to-date estimate of the foreign-born or illegal immigrant populations. Further, prior analysis before the pandemic by the Center for Immigration Studies showed that the ACS and ASEC CPS estimates of the total foreign-born diverged in recent years for reasons that are unclear. However, the monthly July CPS in 2018 and 2019 both produced estimates of the foreign-born that are more similar to the ACS, and well within the survey’s margins of error. Our analysis uses only the core monthly files.
9 In fact, for reasons we cannot explain, the January 2020 CPS shows an extremely small foreign-born population of only 44.4 million. In the 12 months preceding January, the number averaged 45.1 million — about 700,000 more. Even in February 2020, just as Covid hit, the foreign-born population stood at 45 million in the monthly CPS. There is no reason the number should be so low in January of 2020, as Covid-19 should have had no impact on the numbers. Because of this seemingly incongruous value for January 2020, we do not use it to estimate the illegal immigrant population.
10 It should be noted that a large share of new green card holders are not new arrivals but rather individuals adjusting status from within the United States, such as a student who marries an American citizen or a guestworker who is sponsored by an employer for permanent residence.
11 The number of new visas whether temporary or permanent is an imperfect measure of new arrivals as a modest share of all persons issued a new visa do not come to the United States shortly after getting their visa. New immigrant visas are only valid for entry for six months. Students visas are valid for the time period of their study and they are expected to enter shortly before the program starts. If they come later, it should raise big questions on entry. It can be different for guestworkers, but in general, they should enter around the time that their employment starts.
12 Unfortunately, the total number of grants of asylum, which includes both grants from the immigration courts and from asylum officers has not been published for 2020 and 2021. Only the number of grants by the immigration courts is available, but not those by asylum officers. Between 2016 and 2019 the ratio of asylum grants by the immigration courts relative to all grants averaged 2.47 to one. We apply this ratio to grants from the courts to estimate the total number of asylees in 2020 and 2022. It should be noted that there seems to be a discrepancy in the number of grants by the courts reported for the first quarter of FY 2022 in the document linked above. The published information shows the same number of grants from October to December 2021 (Q1 FY 2022), as for all of 2020. This seems highly implausible, but at present we have not been able to find information to determine if these figures are correct so for this analysis we accept them as given.
13 The overwhelming majority of those granted asylum, including all defensive claims, were illegal immigrants. While these individuals are not really new arrivals, they are new additions to the legal immigrant population in the United States and as such need to be included as part of that population.
14 DHS states that its undercount adjustment for the permanent legal foreign-born to account for those missed in Census Bureau data is 2.5 percent. We use this value to adjust our permanent foreign-born population downward from 2019 to 2022.
15 DHS states that it assumes a 10 percent undercount of the non-immigrant population. We could use this percentage, but the monthly CPS in recent years shows a larger post-1980 non-citizen population. From 2015 to 2018, the post-1980 non-citizen (Cubans excluded) population in the July CPS is 441,000 larger than in the ACS on average for those same years. (We compare the ACS to the July CPS because the ACS is controlled to a July total.) In contrast to non-citizens, from 2015 to 2018 the naturalized citizen population is actually larger in the ACS. Based on this, we think that it is likely the non-immigrant foreign-born and the illegal immigrant populations in the monthly CPS are undercounted less relative to the ACS, as both groups should show up in the data as non-citizens. As a result, we adjust downward the non-immigrant population by five percentage points, half of the 10 percent that DHS uses. Part of the reason for the lower undercount of non-citizens in the CPS could be due to differences in the way foreign students are captured in each survey.
16 As DHS points out in its report on illegal immigrants in 2018, “The vast majority of the Cuban-born population living in the United States is excluded from the population estimate since most Cubans who were admitted or paroled into the United States prior to January 2017 were eligible to apply to adjust to LPR status one year after entry. Cubans who entered after the wet-foot/dry-foot policy was discontinued in January 2017 are included in the estimate.” We follow this same approach in our estimates.
17 DHS, for its 2016 to 2018 estimates, assumes a 13 percent undercount for those who arrived in the most recent year that then declines by 7.5 percent with each year of presence. Using the figures reported in Table 1A-1 of its report produces an overall undercount rate of 4.59 percent. As indicated in end note 15, for most years the CPS shows a larger non-citizen population than the ACS. We interpret this as an indication that non-immigrants and illegal immigrants have lower undercount rates in the CPS than in the ACS. Therefore, as is the case with non-immigrants, we cut in half DHS’s estimate of the undercount. This means that once we calculated the illegal immigrant population in the CPS (line 8), we increased it by 2.3 percent in line 9.
18 For 2017, Pew's most recent estimate is 10.5 million illegal immigrants. CMS estimates 10.64 million in 2017, 10.57 million in 2018, and 10.35 million in 2019, its most recent estimate. Pew’s estimate is equal to only 92 percent of DHS’s in 2017, while in 2017 and 2018 CMS’s estimates are equal to 93 percent of DHS’s.
19 Bashir Ahmed and J. Gregory Robinson, "Estimates of Emigration of the Foreign-Born Population: 1980-1990", Technical Working Paper No. 9, Population Division, U.S. Bureau of the Census, 1994.
20 Based on that paper, Warren assumed those illegal immigrants who arrived in the 1990s had an overall undercount rate of 10 percent. He also assumed the average rate was 12.1 percent for those who arrived between 2000 and 2009. It is certainly reasonable to assume that the more recent cohorts have higher undercount rates, but he does not make clear where the rate comes from for the 2000-2009 cohort.
21 Warren estimated in 2013 that there were 1.52 million eligible for the DACA program and about 800,000 ultimately came forward by 2017.
22 There is a 2015 paper by Van Hook et al. that attempts to measure the undercount of the Mexican-born population in the 2000 census and 2001 to 2010 ACS. They find that the coverage of the population, which makes up about half of all illegal immigrants, had improved by 2010.