Introduction
The idea of collecting citizenship or country of birth data through the Census is certainly nothing new. From 1820 to 1950, except for 1840, the decennial census included at least one question on citizenship or place of birth, which allows for the identification of the foreign-born. From 1960 to 2000, a question on citizenship or place of birth was asked to a subset of the population — roughly 10 to 17 million households taking part in the Census.1 Other than 1840, the 2010 Census was the first time since 1820 that neither data on citizenship nor country of birth was collected in the decennial census for at least some share of respondents. On December 12, 2017, the U.S. Department of Justice asked the Department of Commence to add a citizenship question back into the Census for 2020. On March 26, 2018, the Department of Commerce announced that it was going to include the citizenship question currently used in the American Community Survey on the 2020 Census.
In my testimony I will touch on the potential benefits of adding this question. But I will focus on concerns that the current heighted immigration enforcement environment may reduce response rates if a question citizenship is reinstated. In particular, I will discuss response rate and other issues related to the citizenship data currently collected by the Census Bureau in the Current Population Survey and the American Community Survey to see if there has been a change response rates. Overall, these surveys do not show that it has become more difficult in the last two years.
Reasons for the Question
The Census Bureau in its memorandum outlying its decision to put a citizenship question back on the census indicated that citizenship data at the local level would help the Department of Justice better enforce the Voting Rights Act.2 I would add that from the perspective of a researcher it would be very helpful to have citizenship data from the Census in order to evaluate all the other citizenship data currently collected in other Census surveys. In my years working as a contractor for the Census Bureau evaluating the citizenship data in the Bureau's American Community Survey, it was always challenging to find ways of measuring the accuracy of the citizenship question.3 My co-researcher and I would compare the data to other Census Bureau surveys and a limited amount of administrative data. We also looked at the internal consistency of the data. But then as now, there was no definitive government data on the number of U.S. citizens residing in the country. The U.S. government does not know the number of U.S. citizens in the country.
The 2010 ACS showed 17.5 million non-citizens living in the country, and 286.9 million U.S. citizens. Are these numbers correct? We think so. But asking every U.S. resident their citizenship status would certainly answer this question more definitively. Collecting this information every 10 years would be very helpful in evaluating the citizenship data collected on a host of Census Bureau surveys. Having such information might also help us better understand migration patterns, particularly at the local level. It is always better to have more information when doing research or formulating public policy. A citizenship question certainly would give the United States more information.
Concern over Reinstating the Citizenship Question
A number of news stories have discussed concerns that adding a citizenship question may reduce response rates to the 2020 Census.4 Shortly after the Commence Department announced that a citizenship question was reinstated on the Census, at least a dozen states initiated lawsuits to stop it because they fear it might reduce response rates.5
While citizenship was asked in many past censuses, seemingly creating few problems, one of the central concerns with reinstating the question for 2020 is that the election of Donald Trump has changed things. It is argued that the current stepped-up level of immigration enforcement may cause immigrants, particularly illegal immigrants, to skip the 2020 census out of fear of deportation or some other reprisal. The Center for Survey Measurement (CSM), part of the Census Bureau, conducted interviews and focus groups with field representatives and respondents on this potential problem and reported the results in a memo published on the bureau's website.6 CSM did find that there was heightened concern on the part of those who collect Census Bureau surveys and respondents about the possibility that information provided to the Census Bureau could be used to enforce immigration laws, which might be termed a "Trump effect" (my words).
The Census Bureau memo emphasizes that respondents and field personnel often brought up the concern that confidential data provided to the bureau might be shared with immigration enforcement agencies in "the current political climate", or "given how the situation is now". Another respondent did not report information on some renters out of a concern over the "Muslim ban". Overall, the CSM memo offers evidence of a "Trump effect". That is fear on the part of some respondents that confidential information will be used against them by immigration authorities. If this is true, it could reduce response rates for some subpopulations in 2020.
There are several points to keep in mind about these interviews done by CSM. First, the bureau is very clear that the interviews and focus groups were conducted only on a small number of people. Second, the bureau states that the focus groups and interviews were "qualitative studies and as such, unrepresentative of the population as a whole, and none of them were specifically designed to examine confidentiality concerns." So it is not clear what generalizations can be made based on these unrepresentative small samples. Third, even if respondents have become more reluctant to answer Census Bureau surveys or to fill in a particular question, it is not clear if adding one citizenship question on the Census would make any difference to response rates.
This is of course the big question: Would adding a single citizenship question on the 2020 Census reduce response rates in a matter different from all the other surveys currently collected by the government that include a citizenship question? After all, the Census Bureau has asked more detailed immigration-related questions for many years on a number of its surveys.
Citizenship Data Currently Collected
One of the most important surveys the Census Bureau collects is the monthly Current Population Survey (CPS), from which the Bureau of Labor Statistics estimates unemployment and other labor force characteristics. Since 1994, the CPS has asked respondents about their citizenship, country of birth, and year of arrival in the United States. The survey even asks respondents for their mother's and father's birthplaces. The CPS is the basis — and, in many cases, considered the gold-standard source — for official government estimates on everything from the nation's poverty rate to wages and health insurance coverage.
In addition to the CPS, the government also conducts the American Community Survey (ACS) every year for roughly 3.5 million households — by far the largest survey the government collects. The ACS essentially contains the "long-form questions" from the 1990 and 2000 censuses that were asked of one in six households. These questions cover many different topics including several dealing with immigration, such as citizenship, year of arrival, and place of birth. Other Census Bureau surveys, such as the Survey of Income and Program Participation (SIPP), also ask a number of immigration-related questions. In fact the SIPP, after first identifying non-citizens then asks the non-citizens if they came as lawful permanent residents (LPRs); it then goes on to ask those who did not come as LPRs if they have changed their status since they arrived. The results of these questions are considered accurate enough that some researchers use the responses to help estimate the size and characteristics of the illegal alien population.7 If asking about citizenship significantly reduced data quality by lowering response rates, then a good deal of information published monthly and annually by the federal government, based on these surveys, is already be compromised. But that does not seem to be the case.
Looking for a "Trump Effect"
To explore the possibility that the current heightened enforcement environment may reduce responses to the 2020 census, we can examine trends in the surveys currently collected by the Census Bureau that include a citizenship question. The Census Bureau publishes the share of people each year who refuse to take part in the ACS. If more people are refusing to be interviewed by the Census Bureau each year it could indicate a rise in concern about confidentiality. Of course, it may indicate other social trends such as a decline in civic-mindedness as well.
Figure 1 reports the refusal rate for the ACS from 2005 to 2016 nationally; 2016 is the most recent data available and 2005 was the first year the survey was fully implemented.8 Figure 1 also reports the refusal rate in the three states with the largest immigrant populations — California, New York, and Texas. Figure 1 does show a significant increase in refusal rates nationally and in the top immigrant-receiving states. This is certainly a concern, and would seem to indicate that a growing share of U.S. residents are reluctant to participate in the ACS.
Figure 1. Share of persons who refused to be interviewed for the ACS shows an increase well before Trump’s rise.
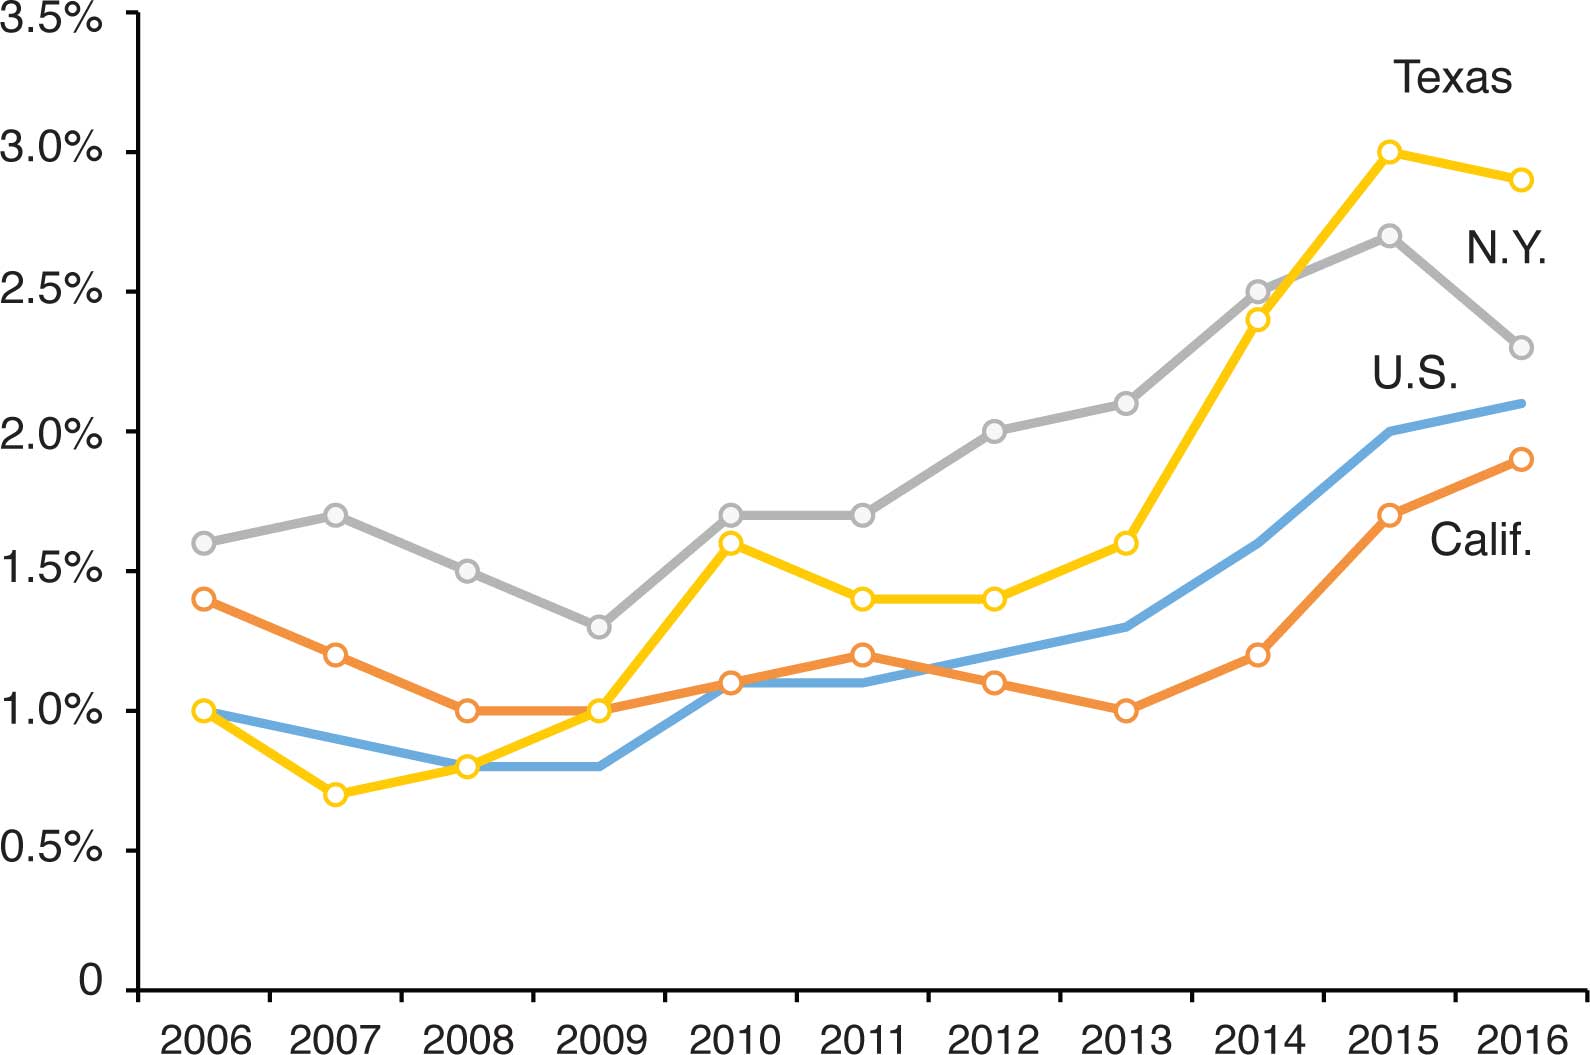
Source: American Community Survey.
However, several things stand out about the figure. First, the share refusing remains very small at just 2.1 percent in 2016. Second, the total increase from 2005 to 2016 was only 1.1 percentage points. Third, it is clear from the figure that refusal rates were rising long before Trump came on the scene. Fourth, the increase in refusal rates for the most recent years available — 2015 to 2016 — was just 0.1 percentage points. If the "Trump effect" was causing immigrants or perhaps others to refuse to take part in the survey, we would expect to see a big jump in refusal rates in 2016. After all, Trump was either running for president or was president-elect during the whole time the 2016 ACS was being collected. His support for stepped-up immigration enforcement certainly received an enormous amount of media coverage.
As for the top immigrant-receiving states, the trend in refusal rates looks very similar to the nation. While these states do have refusal rates that are somewhat higher than the nation as a whole, the increase in refusals was lower in California and New York than the increase nationally between 2006 and 2016. Texas's increase was somewhat larger over the last decade than in the nation as a whole. However, between 2015 and 2016 the rate actually fell slightly in Texas, as it also did in California. Again, if the candidacy and presidency of Donald Trump is creating confidentiality concerns and increasing the unwillingness of the public to answer a survey like the ACS, 2016 should show a large increase in refusal rates, particularly in high-immigration states. But Figure 1 indicates this is not the case.
Figure 2. The share of unweighted responses to the citizenship question on the ACS that are allocated shows a long-term increase well before Trump's rise.
(Allocated responses are those filled in or changed by the Census Bureau because the answer was left blank or did not make sense.)
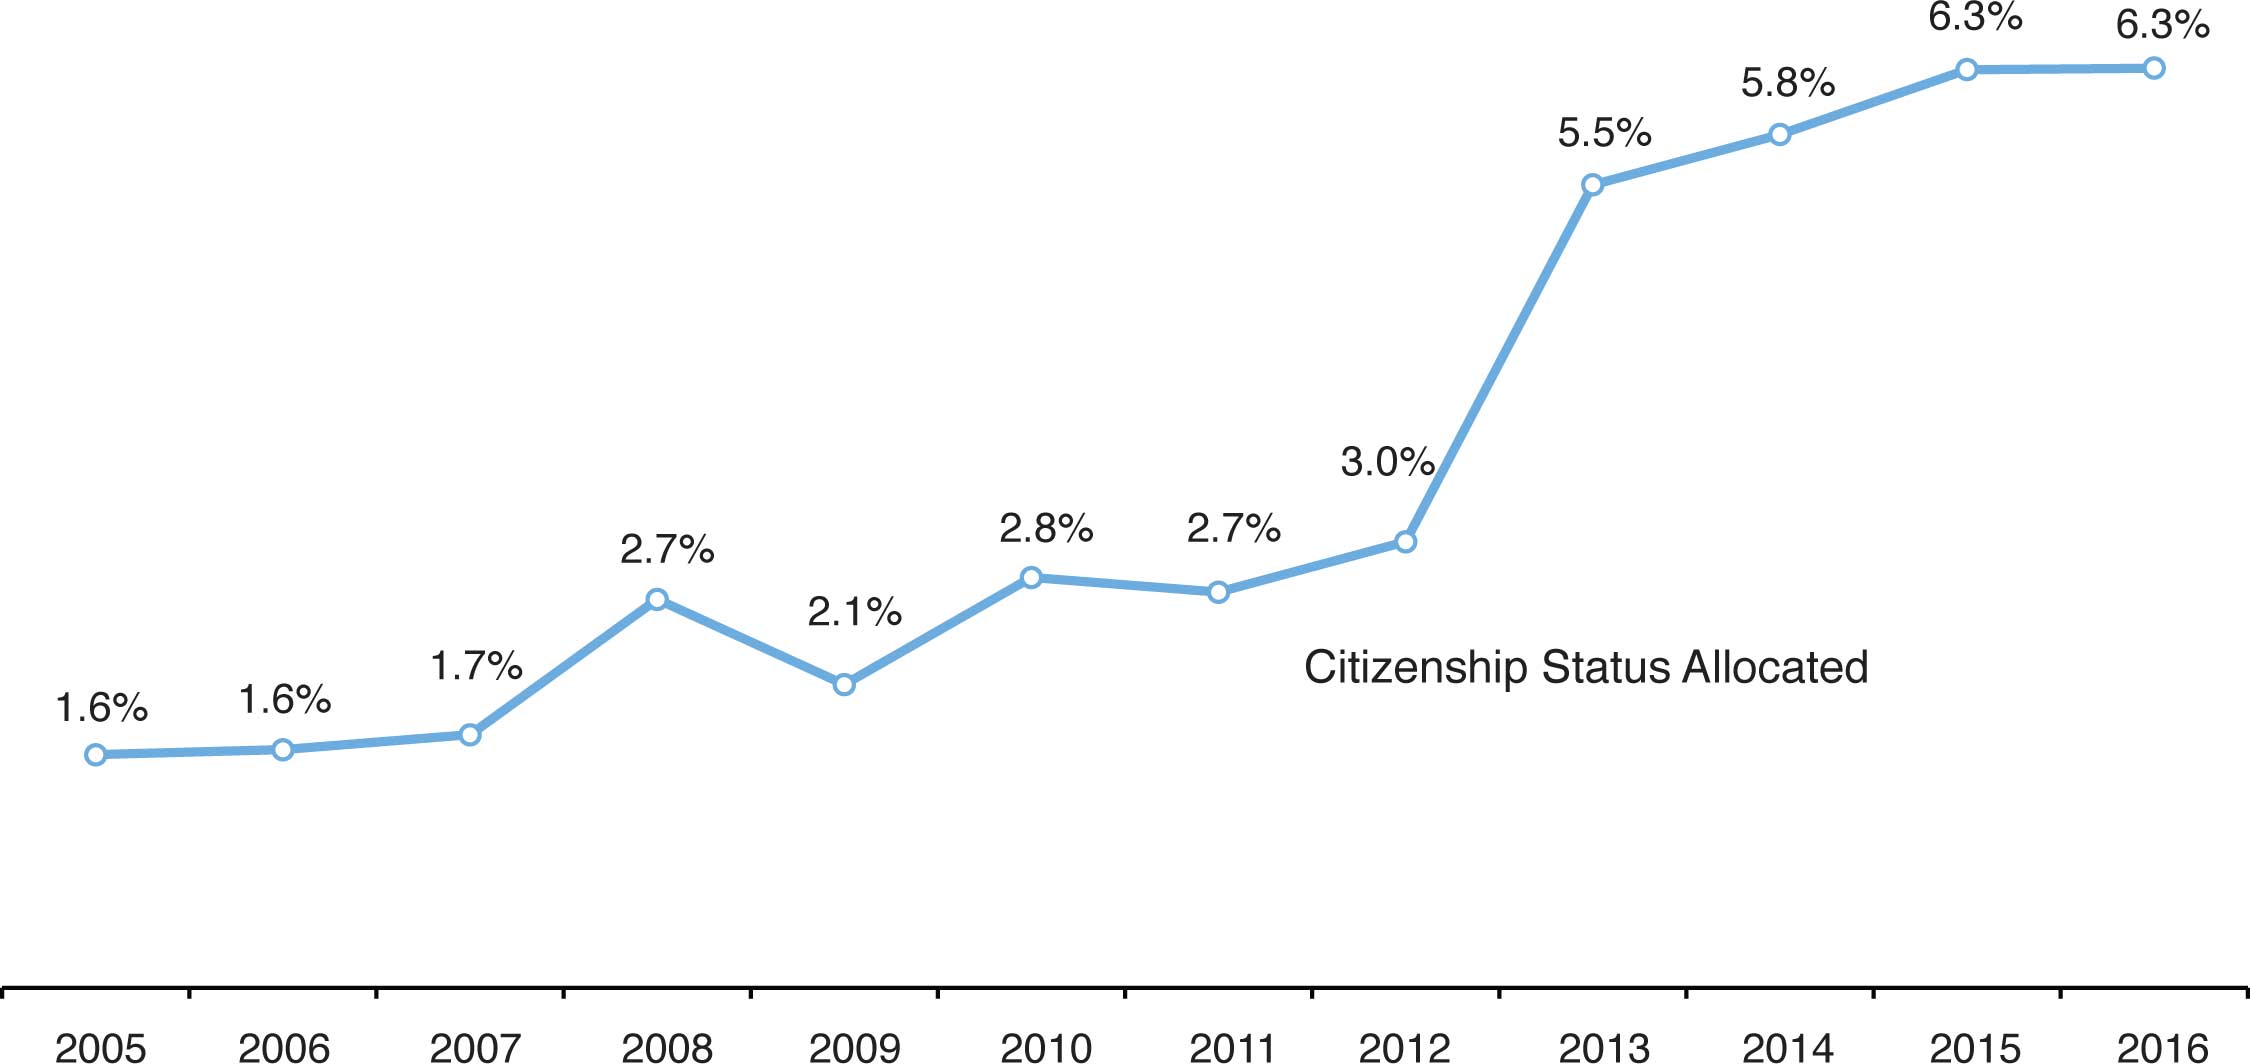
Source: Public-use files of the 2005 to 2016 American Community Survey.
Another way to look for a Trump effect is to examine the ACS internally. Figure 2 looks at the share of responses to the citizenship question in the survey that have to be "allocated" by the Census Bureau. An allocated response means that the respondent left the question blank or gave an answer that did not make sense — for example, someone indicated on the place of birth question that he was born in the United States, but then indicated he is not a U.S. citizen on the citizenship question. Using a complex methodology, the bureau fills in or fixes these problematic responses. Figure 3 shows the same information except that the data is weighted so that the total reflects the actual size and characteristics of the U.S. population. All figures publicly reported from a survey such as the ACS are weighted.
Figure 3. The share of weighted responses to the citizenship question on the ACS that are allocated shows a long-term increase well before Trump's rise.
(Allocated responses are those filled in or changed by the Census Bureau because the answer was left blank or did not make sense.)
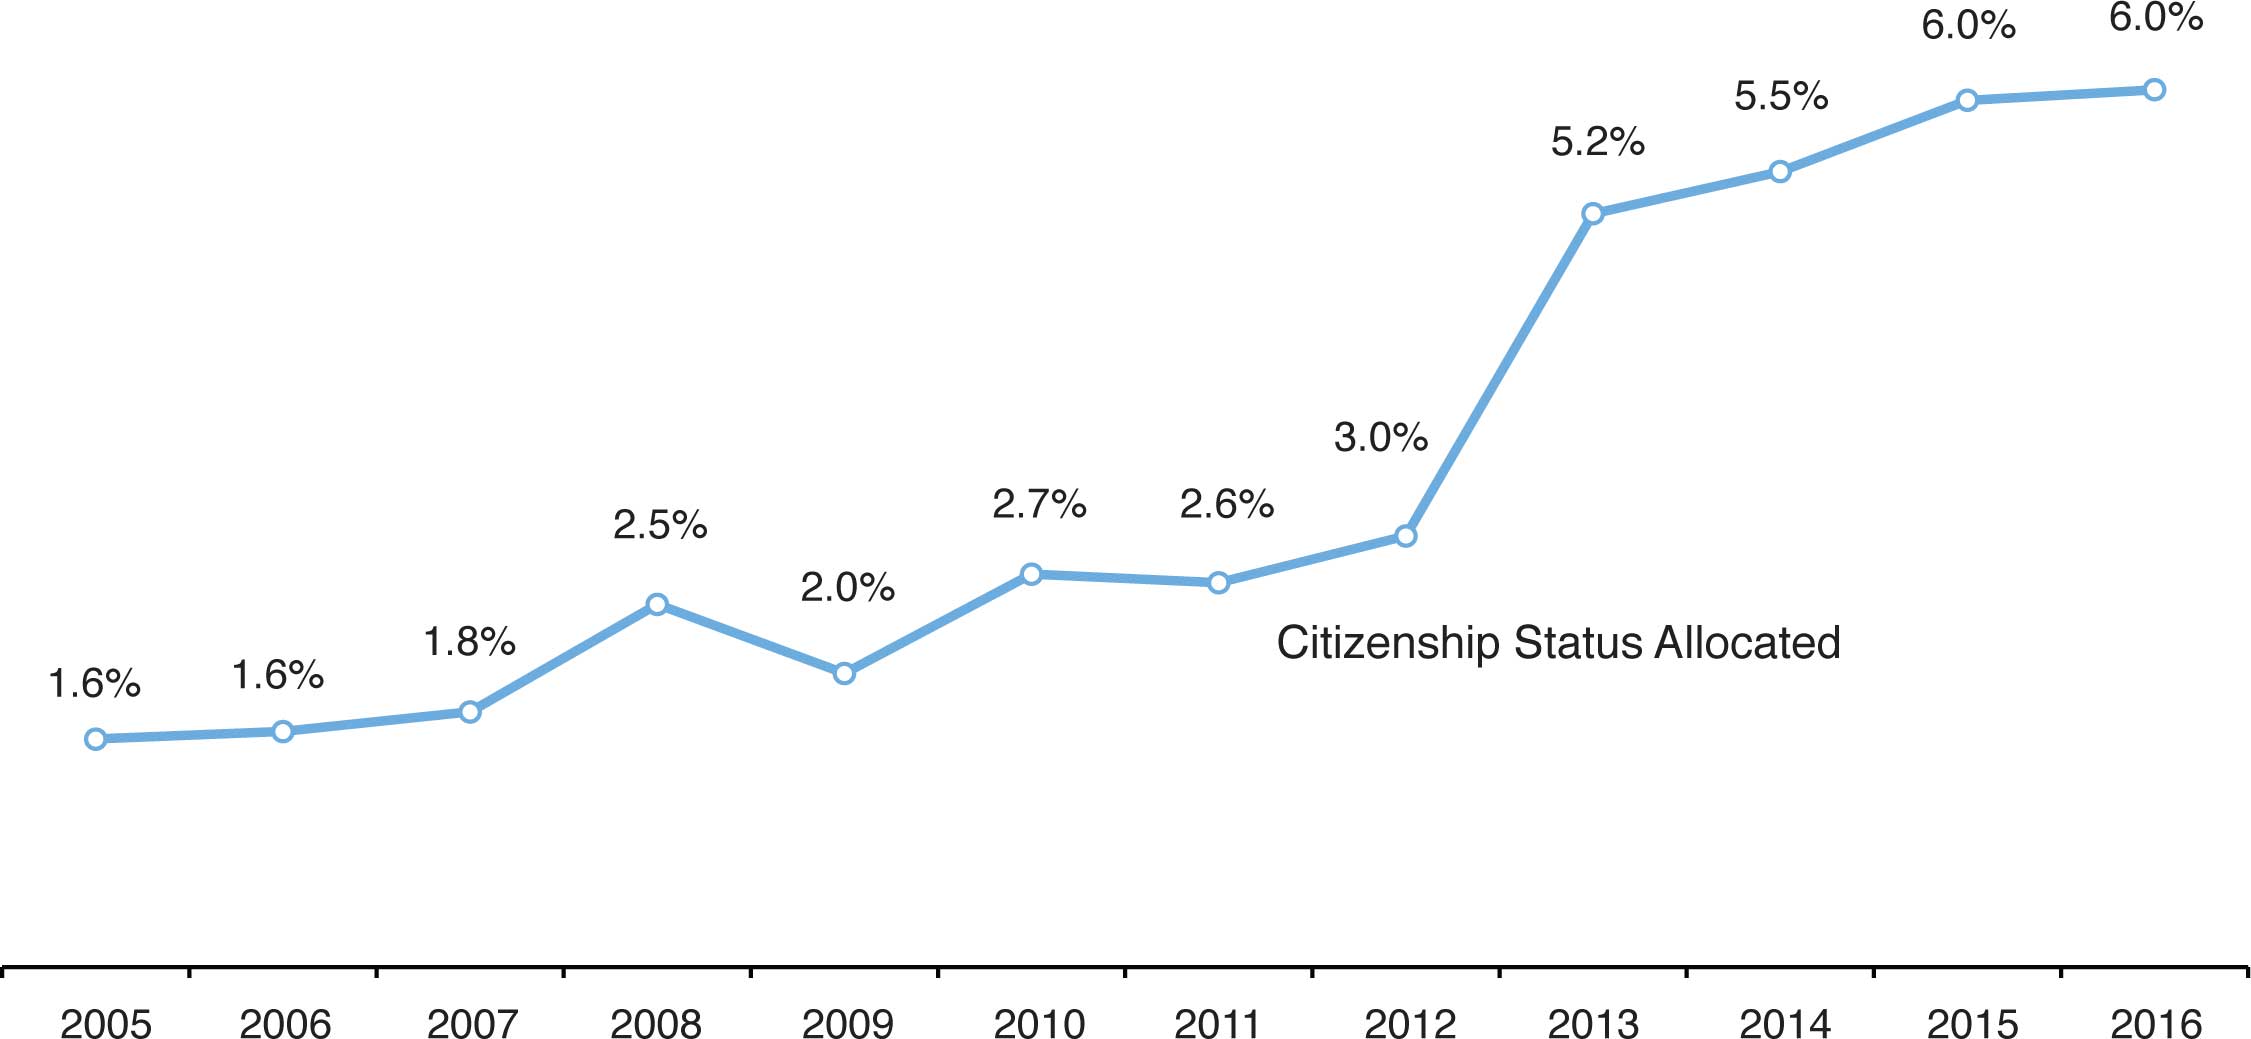
Source: Public-use files of the 2005 to 2016 American Community Survey.
Whether we look at the unweighted data in Figure 2 or the weighted data in Figure 3, we do see a significant increase in the share of people whose responses on the citizenship question had to be allocated by the Census Bureau. This may be a real concern, but it clearly pre-dates the candidacy and presidency of Donald Trump by many years. Perhaps most interestingly, the increase in allocations for the citizenship question actually seems to have stabilized between 2015 and 2016. As already mentioned, if there was going to be a "Trump effect", we would expect it to show up in 2016. But neither Figure 2 nor Figure 3 shows such an increase. Perhaps most important, allocation rates for the ACS put out by the Census Bureau show that allocation rates have increased for almost every question asked in the survey — including but not limited to questions on employment, carpooling, education, income, age, food stamp use, and marital status.9 People seem to have become less likely to answer questions or answer them correctly across the board.
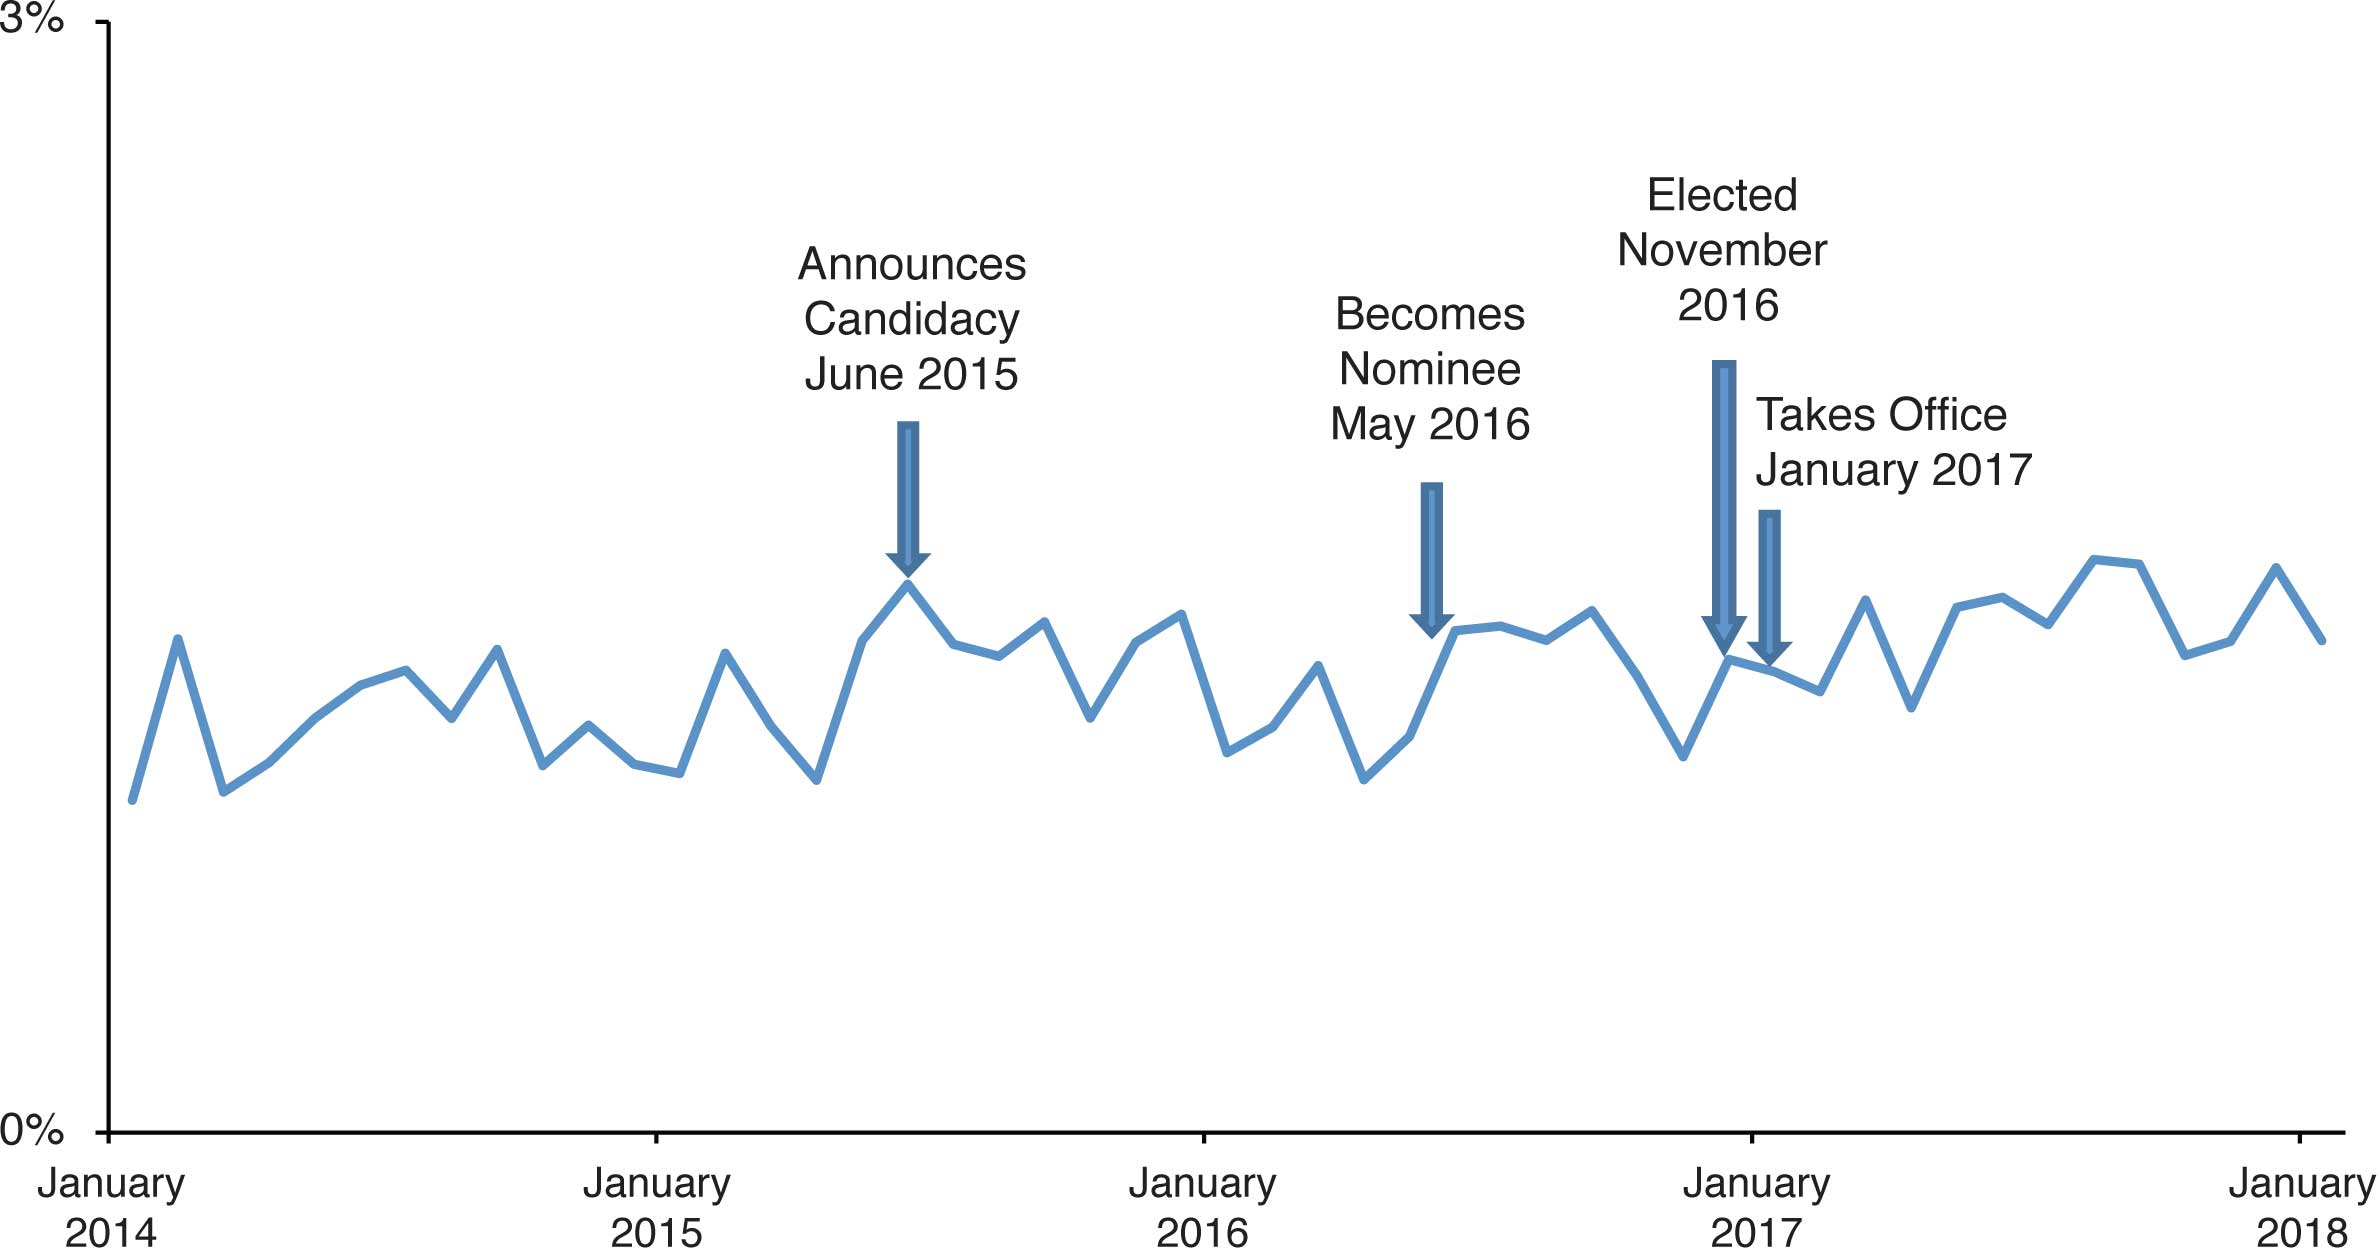
Moving to a different data set, Figure 4 shows the monthly total foreign-born population in the public-use files of the CPS. The arrows show important events in the rise of Donald Trump. If concerns over confidentiality reduced response rates to the survey, we might expect that there would be some fall-off in the share of people who are identified as immigrants (foreign-born). But Figure 4 does not show this is the case. After Trump announced he was running, and even after he secured the Republican nomination for the presidency, there was no statistically significant change in the measured size of the foreign-born population. Between June of 2015, when Trump threw his hat into the ring, and January of this year, when he was one year into his presidency, the CPS shows the foreign-born population grew by 2.5 million.
Figure 4. There has been no significant decline in the size of the foreign-born population in the monthly Current Population Survey associated with the rise of Donald Trump.
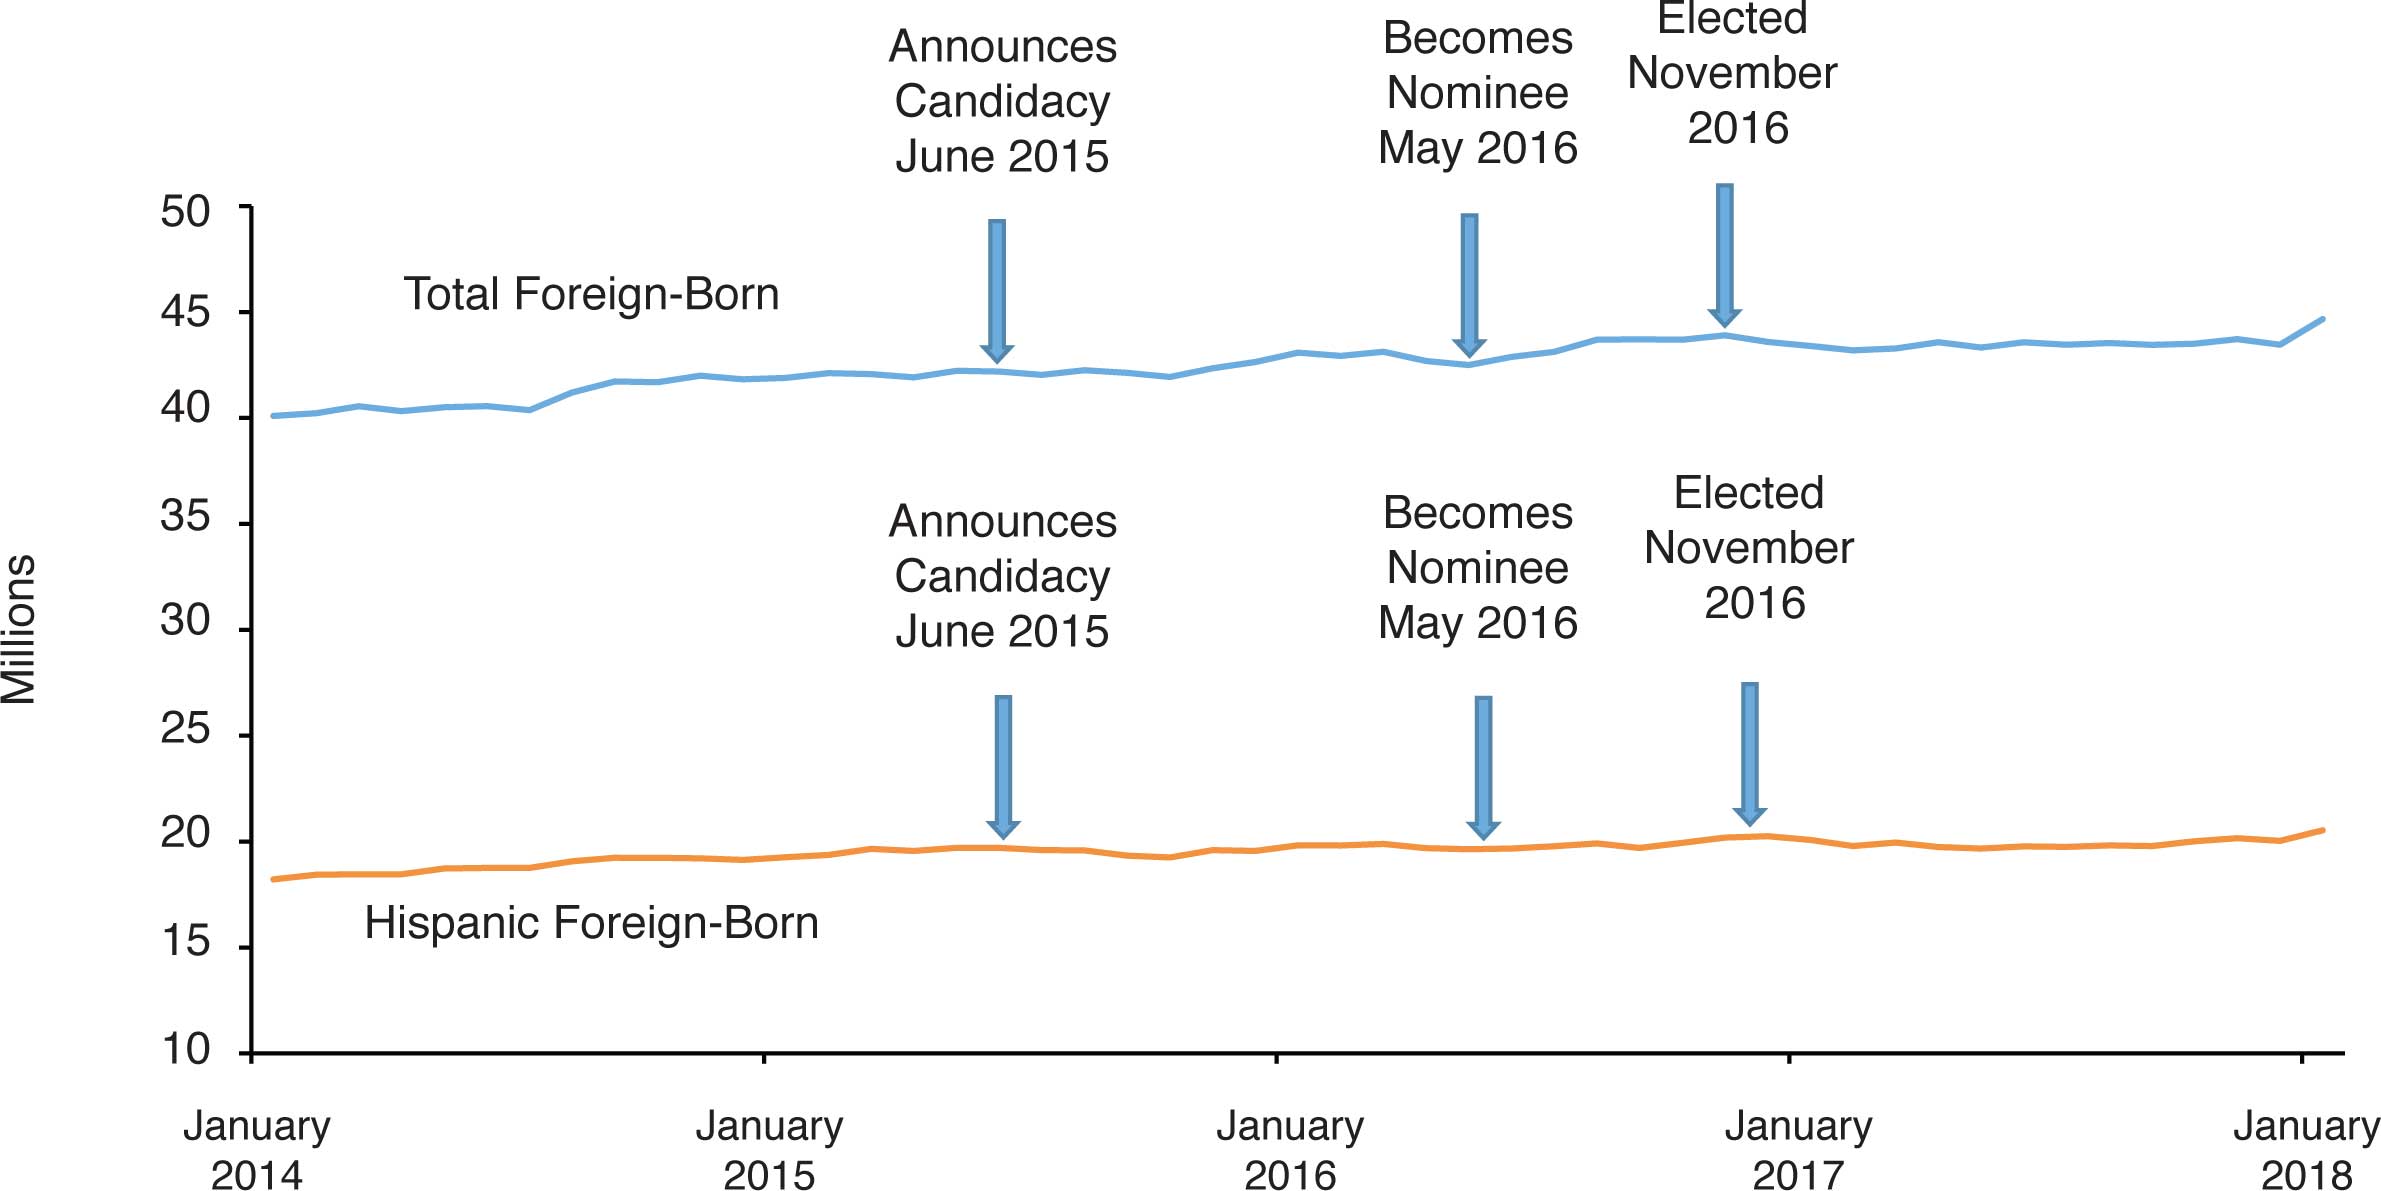
Source: Public-use files of the January 2014 to January 2018 Current Population Survey.
The CPS is weighted to reflect what the bureau thinks is the total U.S.-born population. Characteristics such as race, gender, and age are used to "control" these population totals. However, being foreign-born is not a control variable. As such, it is allowed to fluctuate in the CPS based on responses, in the same way that employment or wages are also allowed to fluctuate. But Figure 4 shows very little fluctuation.
Figure 5 drives a little deeper into the CPS data. The figure reports the share of responses to the CPS citizenship question that had to be "allocated" by the Census Bureau for only the survey's "incoming rotations groups." Each month new people join the survey and remain in it for four months, leave it for four months, and then return for four months. There are a total of eight rotation groups in the survey at any one time, one of which leaves each month while one joins the survey each month. Figure 5 looks only at the incoming group — the people joining the survey for the first time. This means this is the first time they have been asked about their citizenship by the Census Bureau. The allocation rates reported in the public-use data for the incoming rotation group shows no big jumps or shifts upward in allocations associated with Trump's candidacy or election. (If we look at all the people in the survey, not just incoming rotations groups, there is also no discernible "Trump effect".) Events such as the announcement of his candidacy or his winning the nomination or the presidency do not correspond to a significant change in the share of new people joining the survey who gave a response that the bureau had to fill in or change in some way. In sum, neither the CPS or ACS indicate that collecting citizenship data has become more difficult in the Trump era.
Figure 5. There has been no significant change associated with the rise of Donald Trump in the allocation rates for the citizenship question in the monthly Current Population Survey.
(Allocated responses are those filled in or changed by the Census Bureau because the answer was left blank or did not make sense.)
Source: Public-use files of the January 2014 to January 2018 Current Population Survey using weighted response to citizenship question.
Conclusion
The figures reported in this testimony do not represent an exhaustive analysis of a possible "Trump effect". But they do indicate that at least at a basic level when looking at two of the Census Bureau's largest and most important surveys that collect citizenship, there does not seem to be a discernable decline in response rates or allocation rates that are related to Trump's candidacy or presidency. Of course, more detailed analysis would be necessary to confirm these findings. To be sure, people have become somewhat more reluctant to take part in the American Community Survey or to answer specific questions on that survey, but this is not a recent development; it began well before 2016. The lack of evidence that reinstating a citizenship question on the 2020 Census would reduce response rates certainly lends support to the Department of Commerce's decision to include the question. Doing so would be beneficial to voting rights enforcement and to researchers.
End Notes
1 In 1820 and 1830 citizenship was asked of white respondents. In 1840 there was no question related to immigration. From 1850 to 1880, place of birth was asked. In 1870, citizenship was asked of men 21 or older. From 1890 to 1950, place of birth and citizenship was asked. In 1960, place of birth was asked of 25 percent of the population or 13.2 million of nation's 52.8 million households. In 1970, about 12.3 million (20 percent) of the 63.4 million households) were asked the place of birth question and 5 percent were ask about citizenship. From 1980 to 2000, one-sixth of the population was asked about both citizenship and place of birth — 14.8 million in 1980, 15.6 million in 1990, and 17.5 million in 2000.
2 Memo from Commerce Secretary Wilber Ross Regarding "Reinstatement of a Citizenship Question on the 2020 Decennial Census Questionnaire", March 26, 2018,
3 Some of the research I have done with Jeffery Capizzano for the Census Bureau can be found here.
4 Brenden O'Brien, "U.S. to add citizenship question in 2020 Census: Commerce Dept", Reuters, March 26, 2018,; Michael Wines, "Critics Say Questions About Citizenship Could Wreck Chances for an Accurate Census", The New York Times, January 2, 2018.
5 Michael Wines and Emily Baumgaertner, "At Least Twelve States to Sue Trump Administration Over Census Citizenship Question", The New York Times, March 27, 2018.
6 "Respondent Confidentiality Concerns", memo from Center for Survey Measurement (CSM) to Associate Directorate for Research and Methodology (ADRM), September 20, 2017.
7 See James D. Bachmeier, Jennifer Van Hook, and Frank D. Bean, "Can We Measure Immigrants' Legal Status? Lessons from Two U.S. Surveys", International Migration Review, Summer 2014; Jeanne Batalova, Sarah Hooker, and Randy Capps, "DACA at the Two-Year Mark: A National and State Profile of Youth Eligible and Applying for Deferred Action", Migration Policy Institute, August 2014.