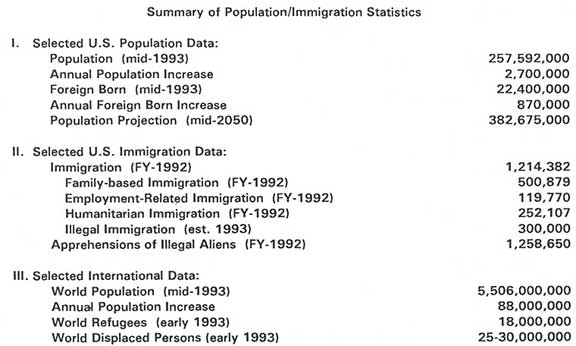
Statistical indicators in 1993 show immigration continuing to increase in total numbers, and the U. S. foreign born similarly increasing in numbers and in their share of the overall U.S. population. The Census Bureau recognized in a December 1992 report that the nation's population will not peak in 2040 and then begin to decline, as it projected for the "middle" scenario in its 1989 report. Rather, U.S. population will still be sharply climbing as it passes 400 million shortly after the year 2050. The Census Bureau clearly identified increased immigration, both legal and illegal, as the major reason for this significantly revised projection.
Overall, immigration jumped 17.6 percent in Fiscal Year 1992 to 1.2 million, with the major increases coming from humanitarian entries and family-related and job-related immigration. The Immigration and Naturalization Service reports that in FY'92 apprehensions of illegal aliens increased by five percent, continuing the upward trend since FY'89. The rise in apprehensions, to over 1.2 million last year, serves also as an indicator that the number of those who elude the INS and succeed in their illegal entry likely is also rising.
The intent of this Backgrounder is to pull together for ready reference the most relevant statistics that define the magnitude of the population/immigration issues facing the United States. For the most part, the data are taken from official sources. In some cases, as in any attempt to quantify illegal immigration, estimates are necessary. Often estimates will vary widely, and in those cases the estimates used are those that appear most consistent with other related data and are generated by the Center for Immigration Studies or by other responsible sources.
It is the hope of the Center for Immigration Studies that this special statistical compendium will prove useful. We welcome comments and suggestions as well as additional statistical information that may be of general interest. Other selected data will be reported in Scope, the quarterly journal of the Center for Immigration Studies, as they become available.
Selected U.S. Population Data
U.S. Population: 257,592,000 (July 1993)
The July 1, 1993 population of the United States is estimated by the Census Bureau to be 257.6 million. This number of persons is about 2.7 million more than the estimated population for 1992 (254.9 million) and 8.2 million higher than the comparable 1990 calculation (249.4 million).
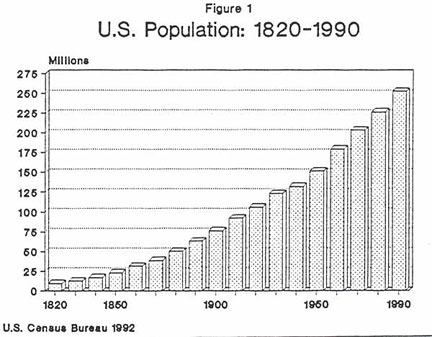
The current annual rate of increase (about one percent), a factor of the nation's birth rate, mortality rate, and net immigration, is proportionate with the historical upward trend in the population growth of the United States (see Figure 1).
U.S. Foreign-Born: 22,400,000 (July 1993)
About one in thirteen persons resident in the United States is foreign born (19.8 million or 7.9%). Two-fifths (8 million) were U.S. citizens, and three-fifths (11.8 million) legal or illegal resident aliens. If the 7.9 percent share held constant, the number of foreign born in 1993 would be 20.5 million. However, the Census Bureau acknowledges that the undercount of the foreign born, especially that part comprised of illegal aliens, is likely to be significantly greater than for the general population (i.e., more likely to have been missed in the census, and therefore higher than the figure reported). In addition, the 1986 and 1990 Immigration Acts, have caused an increase in the level of immigration and, therefore, the share of the foreign-born in the population will be increasing.
One way to use the census data to estimate the current number of foreign born looks at the trend of increase in their numbers. Between the 1980 and 1990 census enumerations, the number of foreign born in the United States rose from 14.1 million to 19.8 (5.7 million, or a 40% increase). That represents an average net increase of 3.5 percent per year over the decade as a result of immigration. If that most recent trend continued between 1990 and 1993, then the current population of the foreign born would be 21.9 million. However, we know that the rate of increase at the end of the 1980s decade was greater than during the period prior to the 1986 IRCA legislation. Therefore, we know that the current rate, bolstered still further by provisions of the 1990 legislation will be higher than the earlier 3.5 percent average.
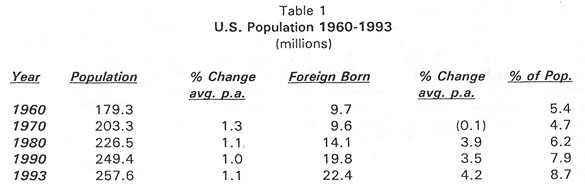
Another approach is to use the Census Bureau's 1992 parameters for its census projection. The Bureau estimates that since 1990 one-third of the annual U.S. population growth results from immigration, i.e., by 880,000 (the net change from immigration of 1,040,000 and emigration of 160,000). The net of new annual immigration minus the annual death rate among the resident foreign born (about 13 per 1000) results in an annual increase of about 870,000. Adding that projected rate of increase to the 19.8 million foreign born in the 1990 census results in a 1993 estimated foreign born population of 22.4 million. This estimate places the U.S. foreign born at 8.7 percent of the population. It should be noted, however, that this number and proportionate share still may be underestimated, because of the relatively greater undercount problems of the 1990 census.
The 5.7 million increase in the foreign born population during the 1980s compares with a rise of 4.5 million during the previous decade, following a slight decline in the foreign born population during the 1960s. The average annual percentage change in the foreign-born population (4.2%) compared with the comparable rate of change for the general population (1.1%) reveals why the foreign born share has been steadily increasing and will grow more rapidly in the future.
U.S. Population Projection: 382,675,000 (July 2050)
The Census Bureau released a projection of U.S. population through the year 2050 in December 1992. This projection depicts the United States with a population of 382.7 million in the year 2050. Even more noteworthy than the projected 54 percent growth in population over the next sixty years was the comparison with a similar projection released by the Census Bureau in 1989. The projection, just three years earlier, portrayed U.S. population peaking just above 300 million in 2040 and then beginning to decline.
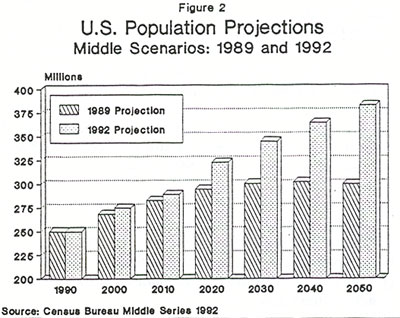
The Census Bureau attributed the enormous change in the population projection to three factors: (1) the 1990 census revealed an increase in the average fertility rate to slightly above replacement level — in part due to the higher fertility of new immigrants; (2) the Bureau also concluded that the IRCA provisions for deterring illegal immigration by a system of employer sanctions against hiring illegal workers was being circumvented; and (3) the 1990 Immigration Act opened the doors wider to legal immigration. The Census Bureau's "middle" scenario in 1989 was for a net annual increase from immigration of 600 thousand, and that level would decline. The "high "scenario projected the net increase at 800 thousand. In the most recent projection. net annual increase from immigration is pegged at 880 thousand in the "middle" scenario. In the current "high "scenario, the net immigration figure is set at 1.37 million per year and it contributes to a 2050 population projection of over 500 million.
One approach to understanding the impact of immigration on U.S. population growth is to project what would be the population size of the United States if there were no further immigration. Leon Bouvier, a well known demographer and author on population and immigration, has projected the difference between U.S. population in the year 2050 based on the current immigration level and a hypothetical halt in immigration beginning in the year 2000 (see Figure 3).

If it were not for immigration, the population of the United States would stabilize at about 310 million persons in 2030. The net effect of immigration after the beginning of the new decade and the offspring of these new immigrants add an additional 85 million people to the projected "middle" scenario population size in 2050.
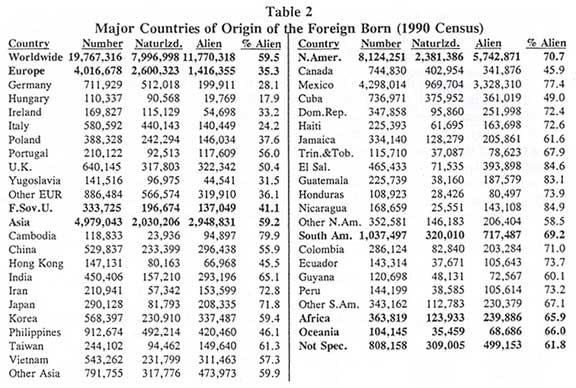
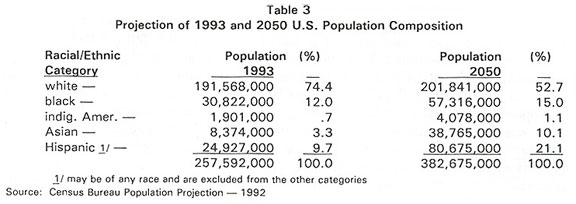
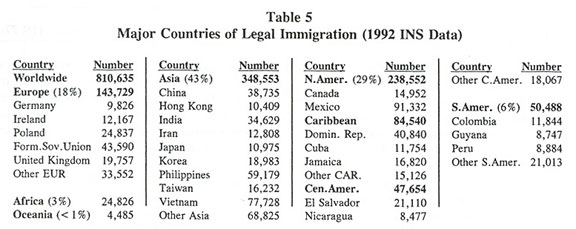
The demographic characteristics of the United States are also rapidly changing in terms of the country's ethnic/racial composition. The major contributing factors for this change are the following: (A) immigration is a major contributor to population growth (as shown in Figure 3 above); (B) the ethnic/racial characteristics of current immigration differ from that of the current population (see Table 2 above — major immigrant sending countries — and Table 5 below — major countries of refugees); and (C) different ethnic/racial groups display differing fertility rates. Those that have a higher rate will grow in their proportionate share of the population. New immigrants generally bring higher fertility rates with them to the United States.
Selected U.S. Immigration Data
U.S. Immigration: 1,214,382 (FY 1992)
Compared with the current Census Bureau estimate of annual immigration of 1,040,000, the preliminary data to be incorporated in the FY'92 INS Yearbook records total immigration at 810.635. The discrepancy is explained in part by the fact that the INS count does not include illegal immigrants. and the INS data on refugees and asylees is of status adjustments rather than newcomers. The Center's figure of 1.2 million cited above substitutes actual refugee entries for refugee adjustments, it adds the share of actual asylum applicants estimated to remain in the United States. and it adds the currently estimated level of illegal immigration (see Table 4).
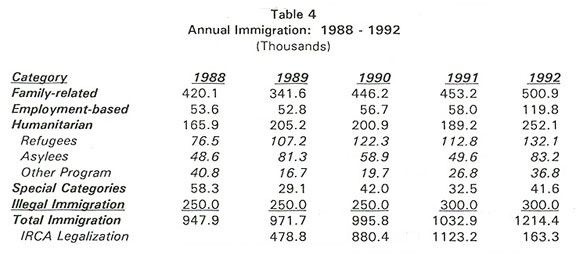
The difference between the Census Bureau estimate of annual immigration and the calculation of the Center (described below) is more than 15 percent for FY'92. The Center's higher figure, and the fact that immigration may be expected to continue to rise rather than remain constant — as the Census Bureau projects, is a further indication that the current Census Bureau middle series projection is probably too low.
Family-based Immigration: 500,879 (FY 1992)
Family-related immigration refers to those immigrants who qualify for entry into the United States based upon their relationship to a U.S. citizen or resident alien. Parents, spouses and children of U.S. citizens are admitted without any numerical limitations. There were 235,484 persons in this category in FY'92. Other relatives of citizens — adult offspring and siblings — and the spouses and children of permanent residents are admitted within a numerical limitation, which was set for FY'92 at 226 thousand (209,525 were admitted).
In addition to this "official" family-based immigration related to the capped preference system and the uncapped immediate relative system, some other family members are admitted under other categories. In 1992 the other categories included 3,598 who qualified on the pre-1992 preference system and 52,272 family members of immigrants legalized under the IRCA amnesty program.
Using the INS total for FY'92 of 811 thousand new immigrants, the largest share is comprised of those who entered on the basis of family relationship (500,879 or 62%). Over half (287,756, or 57%) of the family members were exempt from the numerical limitation of the preference system, 42 percent (209,525) were subject to the family preference ceiling, and the remaining one percent (3,598) were admitted based on an earlier preference system.
When the Center's more inclusive calculation of FY'92 immigration is used, but excluding illegal entrants, the comparable level of family-related entry is 54.8 percent of total FY'92 immigration. If illegal entries are included in the calculation, the share of family-related immigration drops to about two-fifths (41.2 %) of total immigration. Following implementation of the 1986 IRCA, i.e., since FY'88, the share of family-related immigration grew at about two percent per year until FY'92. In FY'92, immigration of family members increased by more than 10% above the comparable level in FY'91. This rate of increase is greater than earlier because of the inclusion for the first time of the family members of legalized aliens.
Employment-based Immigration: 119,770 (FY 1992)
Employment-based immigration to the United States in FY'92 was subject to a numerical limitation under the 1990 Immigration Act of 140 thousand. The number of immigrants charged by INS against this limit in FY'92 was about 115 thousand, and of that number, over 66 thousand (55% ) were accompanying family members. Compared to the INS FY -92 immigration level of 811 thousand, this number and a few thousand in other employment-related categories represent slightly under one-eighth (15%) of the total.
The Center's adjusted immigration level of legal immigration at 914.4 thousand reduces the level of work-related immigration to 13.1 percent. When illegal immigration is included in the total, the percentage of job-related immigration drops to under one in ten (9.9%). Keeping in mind that less than half of those entering under the employment visa category are the workers or professionals per se, this means that their share of total immigration is less than five percent.
The number of immigrants in the employment-related category has more than doubled from the FY 911evel of 58 thousand as a result of the 1990 Immigration Act. However, as a share of total immigration, work-based immigration is still a very minor category; the number of immigrants who qualified on this basis (not including accompanying family members) rose over the past year from 2.3 percent to 4.4 percent.
Humanitarian Immigration: 500,879 (FY 1992)
Humanitarian immigration is comprised of refugee admissions, asylum granted to persons in the United States who fear persecution if they were to return to their homeland, and certain other categories. The FY'92 level of humanitarian entries, at 252,000, increased over FY'91 by one-third. This represents a proportionately greater increase than the rise in overall immigration. As a share of total immigration, including illegal immigration, humanitarian entries increased from 18.3 to 20.8 percent.
Refugees: 132,144
At the time the current system of admission of refugees and asylees was established by the 1980 Refugee Act, it was contemplated that the annual intake of refugees would be less than 50,000. The refugee admission program is limited by an annual ceiling set by the administration in consultation with the Congress. For FY'93 the level decreased from 142,000 to 132,000. This is an increase over the FY'90 and FY'91 levels (see Table 6).
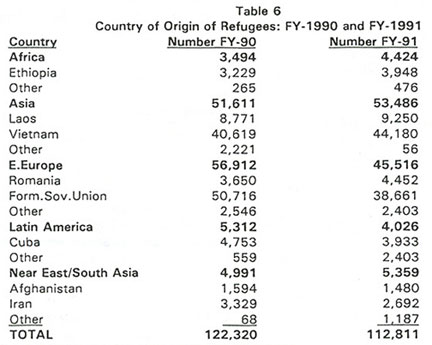
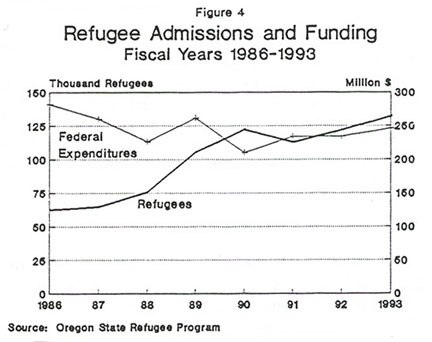
Figure 4 reflects that since 1989 actual annual admissions have been over twice the level contemplated in 1980, and it shows the relationship between the level of admissions and the level of federal funds allocated to support the transition of the refugees to their new life in the United States. The decline in funding, especially relative to the increased admissions level, has been a source of concern to the sponsoring organizations and to the state governments that have been turned to for assistance when the diminished funds have run out sooner.
Asylum: 83,200 (est. 1992)
Asylum admissions, which have no numerical limitation, no screening process prior to entry into the United States, and no federally-funded resettlement program associated with them, have been rising more sharply than refugee admissions. The only limitation is on the number of approved asylum applicants who may be adjusted to permanent residence each year. That limit was five thousand until the 1990 Immigration Act doubled it to 10 thousand and provided for a one-time higher level to deal with the backlog. Approved asylum adjustments in excess of this number will not be forced to leave the United States, but rather will be added to a new backlog.
The number of asylum entries that are included in the number of annual immigrants is an estimate. It is derived from the number of asylum applicants. An unofficial estimate by the INS is that eight of every ten asylum applicants end up staying in the United States, whether or not their applications are approved. The other twenty percent abandon their claims or are found to be mala fide applicants and are deported.
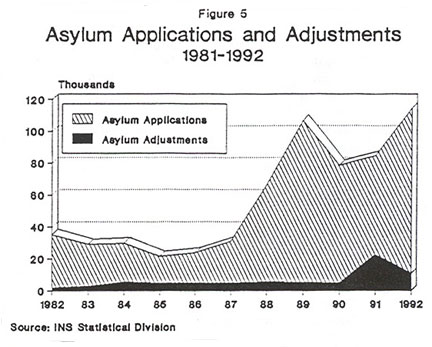
Rather than using the number of asylum adjustments of status reported by the INS, which is a small fraction of total applications, the Center's calculation includes eighty percent of the number of applications. For 1992, this results in more than 83,000 asylees joining other humanitarian entrants into the United States (see Figure 5).
Persons are requesting asylum in the United States in record numbers and then failing to appear for a hearing on their claim and the chance to obtain an adjustment to legal residence. Like persons who enter the United States illegally and those who enter legally but do not depart at the end of their authorized stay, these humanitarian entrants who fail to appear at a hearing to present their case also become illegal immigrants.
Beginning in 1987, the number of applications began a sharp rise from about 30,000 a year to above 100,000 in 1989. In 1992 the number of asylum applications numbered 103,964.
Other Humanitarian Entrants: 36,798 (FY'92)
In addition to the formal refugee program, there are other categories of humanitarian immigration entrants. These other admission categories are based on specific laws for particular classes of people, such as the Amerasian program (nearly half of the other entrants in FY'92), Cubans admitted under a 1966 Act, and Cubans and Haitians paroled into the United States under a 1986 Act. In FY'92, these targeted humanitarian admissions programs accounted for an additional total of nearly 37,000 immigrants.
Quasi-Nonimmigrant Humanitarian Categories
In addition to refugees and asylees, who enter the United States as permanent residents or are granted that status through the asylum process, others aliens who do not qualify for asylum status stay in the United States for protracted periods of time for humanitarian reasons and also eventually may become immigrants through amnesty-type provisions. The original category of this type was Extended Voluntary Departure (EVD). The EVD category was used for persons found to be ineligible for asylum status because they did not meet the test of having a well-founded fear of persecution, but turbulent conditions in their home country led to an executive branch decision to suspend deportation to a certain country until conditions improved.
The 1990 Immigration Act created a new category of Temporary Protected Status (TPS). Under this provision foreigners from specific countries who are in the United States legally or illegally may be allowed to stay on a temporary basis for renewable periods up to eighteen months and to seek employment. When this category was enacted , some refugees who previously had been accorded EVD status, like those from El Salvador, who were specifically made eligible for this new status in the legislation, became eligible to apply for TPS. Over 188,000 Salvadorans did so. Other TPS recipients include aliens from Kuwait, Lebanon, Liberia, Somalia and Bosnia. This process of fine-tuning exceptional categories for non-immigrants who the United States is not prepared to deport has undergone a further change with the adoption of Deferred Enforcement of Departure (DED) status for Salvadorans, whose TPS coverage has expired. Some countries put on the list of DED eligible countries, like Kuwait and Lebanon, have been removed. However, DED status for the Salvadorans who are ineligible for asylum will expire this month, and a further extension appears likely.
Special Categories: 41,634 (FY'92)
"Special categories" is a catchall that is necessary to round out a description of immigration because the U.S. law has so many special provisions. Not all immigrants fit into either job-related, family-based, or humanitarian entry. The largest immigration categories that do not fall into one of the major categories are non-preference immigrants and "lottery" immigrants. Traditionally, the United States immigration system allowed persons who had no job-related or family-tie basis for qualifying for a visa to apply as a non-preference immigrant. However, waiting lists for these visas grew to be many years. As an alternative approach, lottery provisions have been enacted in the 1986 IRCA, 1988 Act, and the 1990 Act. At present (and during the 1987-88 period) it is operated for citizens of "adversely affected countries".
In 1992, the total of 41,634 other entering immigrants consists of 39,194 "diversity transition" immigrants and 2,437 non-preference entrants. However, under the 1990 Act up to 40,000 visas may be awarded per year. At present 40 percent (16,000) of the lottery visas are set aside for the Irish. The diversity category is one of the classes of immigration that is outside of the numerical limitations; but, as noted above, it has its own ceiling (see Scope issue No.10, 1992 for a detailed explanation of the operation of this program).
Illegal Immigration: 300,000 (1992 estimate)
Quantifying annual illegal alien entrants is by its very nature imprecise. The INS reports exclusions at the port of entry and apprehensions and deportations of illegal aliens, but does not make an official estimate of the annual level of illegal entry. Nevertheless, the upward trend in apprehensions suggests a similar trend in non-apprehended illegal entries.
The only official estimate of illegal immigration is provided by the Census Bureau. The current middle scenario population projection, i.e., the one that results in a population of slightly under 400 million in 2050, includes an estimate of net illegal immigration at a constant annual level of 200,000. This projection of illegal immigration was developed in consultation with the INS. In the high scenario, the net annual increase from illegal entries is 300,000. Estimates from nonofficial sources vary widely upwards from the 200,000 level to as much as 500,000. The Federation for American Immigration Reform (FAIR) estimates the annual net increase in permanent illegal immigration as somewhere between 250,000 and 500,000.
The Center for Immigration Studies estimated the number of illegal aliens settling in the United States permanently each year at 250,000 until 1990. The Center's estimate of annual illegal migration estimate was raised to 300,000 aliens in 1991 on the basis of indications that illegal entry was again increasing. This calculation draws on estimates of (A) illegal border crossers — the largest component, (B) persons who continue to stay in the United States after their visa status has expired, (C) persons who become illegal entrants through the asylum process, and (D) those who are granted Temporary Protected Status (TPS) or another form of temporary non-resident status, and at the end of the temporary stay, fail to depart. Adding the estimated 300 thousand illegal aliens to the INS data on annual new immigration yields the total 1992 immigration level of 1.2 million shown in Table 4.
The Center's estimate of 300,000 illegal immigrants per year is a total amount. It does not include an outflow of illegal aliens through deportation or voluntary departure. Thus it differs from the Census Bureau's middle scenario level of 200,000 estimate, which is a net amount. However, it is unlikely that annual outflow and deaths among the illegal alien newcomer population could account for the 100,000 difference. This conclusion, like the calculation of the current level of the foreign born in the United States, indicates that the Census Bureau's current middle level projection is overly conservative.
Apprehensions of Illegal Aliens: 1,258,650 (FY 1992)
The trend in illegal entries over the past two decades has been one of steady increase from 1961-1976, then leveling off at about one million until beginning a sharp climb again from 1983 to 1986. This climb was reversed in 1987, after implementation of IRCA (see Figure 6).
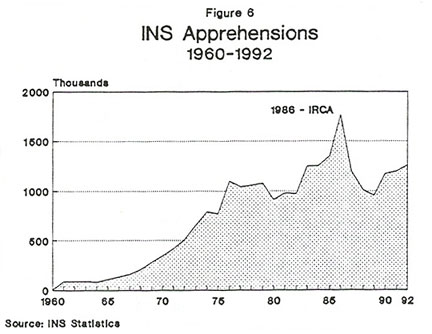
The data reflect a clear correlation between the adoption of the employer sanctions provision of IRCA and decreased apprehensions. This correlation indicates the deterrent effect for illegal aliens of the prospect of difficulty in finding employment. However, as ways to circumvent the documentary requirements of IRCA have been found, principally through forged documents, the trend in apprehensions has resumed its climb.
Selected Global Data
World Population: 5,506,000,000 (1993 estimate)
Population growth in the United States is related to population growth and economic and political conditions elsewhere, because of immigration. Although the population size and growth rate in the United States seem high, world population growth is even higher, and the population sizes of China and India, the two largest populations in the world, are much greater than in the United States (see Table 7).
The United States is the third largest country in population size (it was the fourth largest before the breakup of the former Soviet Union). China is four and one-half times larger, and India is three and one-half times larger, according to the Population Reference Bureau. In addition, the population growth rate in those countries is higher than in the United States (this 0.8 percent rate is lower than the Census Bureau estimate used in the population projection section). China, by adopting a severe one-child per family policy, has succeeded in reducing its growth rate to 1.2 percent per year, but this still is greater than the U.S. rate of growth. India is growing at 2.1 percent per year, a rate more than double that of the United States.
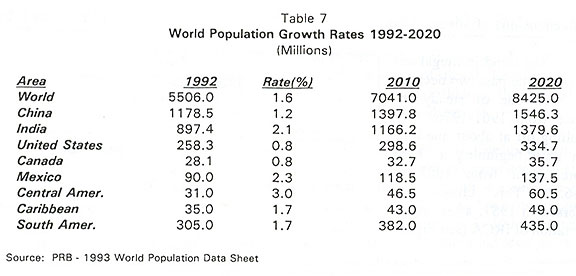
Relative international rates of growth, as projected by the Population Reference Bureau, are based on current demographic trends that include net immigration. This means, for example, that Mexico's population growth rate — nearly three times that of the United States — would be still greater if it were not for the net immigration from Mexico to the United States. If there were no immigration, the population growth of the U.S. in FY'92 would have been lower by 91,300 legal Mexican immigrants and perhaps as many as four-fifths of the 300,000 illegal immigrants. And, the corresponding population growth rate for Mexico would be significantly higher.
To illustrate the difference between these rates of population growth, Figure 7 depicts population growth over a thirty year period at different rates. At the .8 percent growth rate of the United States and Canada, a population of 100 grows to 127, or a 27 percent of its original size. India, at a 2.1 percent rate of growth, increases to 187 percent of its size.
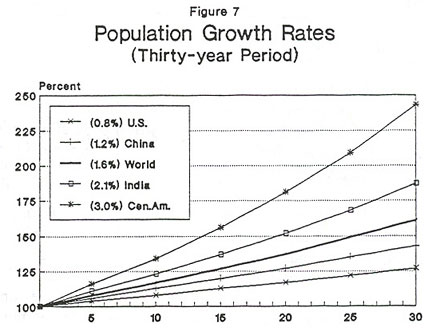
Turning closer to home, Mexico's rate is slightly higher than India's, and the Central American rate of growth, at three percent, more than doubles over the same thirty year period. That region increases to 243 percent of its original size!
The Population Reference Bureau estimates that world population grew by about 88-90 million over the past year. Nearly one-third (32%) of that increase occurred in India (14.8 million) and China (12.7 million). The current estimated rate of growth is decreasing slightly from 1.7 percent in 1992 to 1.6 percent. This reduced rate of growth results in a projected world population in 2020 of 8,425 million, over half again today's population.
This current rate of world population growth is double the 0.8 percent rate in the United States and in Canada (the PRB rate does not include immigration, and is, therefore, understated for the U.S. and Canada). It is fueled by the higher rates of population growth in areas such as Central America (2.5% if Mexico is included, or 3.0% if Mexico's lower 2.3% rate is not included), the Caribbean (1.7%), and South America (1.7%).
A different view of relative population sizes and growth rates is to compare the United States and the southern neighbors of Mexico, Central America and the Caribbean. With 60 percent of the U. S. population size, these countries are projected to experience a population growth over the next year by 175 percent of the population growth in the United States. If South America is added to the other southern neighbors, their combined population is nearly double ours (178%), and their annual population growth is projected to be over four times (426%) that of the United States.
World Refugees: 18,000,000 (1993)
World Displaced Persons: 25,000,000-30,000,000 (1993)
The United Nations High Commissioner for Refugees (UNHCR) currently estimates the number of refugees at above 18 million and the displaced within their own country at 25-30 million. This is a combined total of slightly less than one percent of world population (0.8-9%).
The size of the refugee population has steadily increased over the last several years (see Figure 8). With the United States receiving about half of the refugees who are resettled each year, the worldwide total amount of refugee resettlement represents only slightly over one percent of the total number of refugees.
Sources of Data
- Population Reference Bureau, Inc., 1993 World Population Data Sheet, WDC, April 1993.
- U.S. Bureau of the Census, Current Population Reports, P-25-1092, "Population Projection of the United States...," by Jennifer Day, GPO, WDC, 1992.
- U.S. Bureau of the Census, Current Population Reports, P-25-1018, "Projections of the Population of the United States...," by Gregory Spencer, GPO, WDC, 1989.
- U.S. Bureau of the Census, Population Division, The Foreign-Born Population in the United States: 1990, Pub. CPH-L-98, by Susan Lapham, WDC, 1993.
- U.S. Department of Justice, Immigration and Naturalization Service, 1991 Statistical Yearbook, NTIS order No. PB 92-205699, WDC, September 1992.
- U.S. Department of Justice, Immigration and Naturalization Service, preliminary statistics for FY-1992 covering Table 4 data and Detail Run 401, WDC, 1993.
- U.S. Department of State, Bureau of Refugee Programs, World Refugee Report, WDC, June 1992.