Summary
The fertility of Americans, well below the replacement level of 2.1 births per woman since 1972, has risen markedly since 1988. Some small portion of the increase may represent a statistical quirk or increased childbearing among American women who have delayed maternity and are now "catching up." But powerful and enduring factors in this trend are rising fertility among immigrants and the increasing proportion of high fertility ethnic groups in the U.S. population. Asians' and Hispanics' share of the overall population is rising because of their greater fertility, high immigration from Asia and Latin America, and continued low fertility among the largest ethnic group, non-Hispanic whites ("Anglos").
California, which receives a third of all immigrants and has large minority populations and rapidly rising fertility, may well be the precursor of a lasting rise in national fertility. Fertility in the Golden State rose 20% between 1982 and 1988, reaching 2.3 statewide. Hispanic fertility, already the state's highest, grew by 10% to 3.5. Fertility of Asians rose to nearly 2.5, and that of Blacks to 2.4. Fertility of Anglos rose modestly to 1.7, still well below replacement level.
Between 1982 and 1988 the Hispanic and Asian shares of California's population grew considerably through immigration. Higher fertility among those groups, along with their expanded proportional shares, accounted for 39% of California's increase in fertility. Within the Hispanic and Asian populations, the rising proportion of those ethnic groups that are higher fertility immigrants —and the corresponding decline in the proportion of less fertile native-born — was a major cause of higher group fertility.
These trends have important implications for the population future of California and eventually the nation:
- California's fertility will continue rising, reaching 2.6 by 2020, when the state's population will near 40 million. California will become a state with no ethnic majority by 2010.
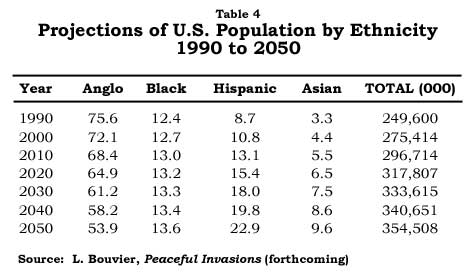
- Nationally, Anglos' share of the population will fall from 75.6 percent in 1990 to 54 percent in 2050. Hispanics will increase their share from 8.7 percent now to 23 percent in 60 years; Asians from 3.3 percent now to 10 percent. The proportion of Black Americans will grown modestly from 12.4 percent to 13.6 percent.
- High immigration coupled with persisting high fertility among the foreign born portends higher U.S. population growth than now projected under prevailing assumptions. The "high scenario" of the Census Bureau's 1989 projections — fertility of 2.2 and yearly immigration of 800,000 — has now become the most plausible. The result would be a u. s. population of 471 million in 90 years.
An important condition for reaching zero population growth in the next century has been an assumed rapid decline of fertility among the foreign born. Recent fertility trends make that outcome seems increasingly remote. Persistent high fertility rates among the foreign born, and the prospect of continuing immigration and refugee flows of a million yearly, virtually rule out attainment of a stationary U.S. population in the 21st century.
Since 1988, U.S. fertility has been on the rise. After hovering around 1.8 for some 15 years, the total fertility rate (the average number of births per woman) rose to 1.93 in 1988 and to 2.00 in 1989. Considering the increase in births in 1990, when all the data is in, the total fertility rate for 1990 will probably reach the once magic figure of "2.1." — the rate at which the population just replaces itself in the long run.
Explanations For Rising Fertility
What explains this recent spurt in fertility? Why this sudden switch in behavior among Americans after 18 years of fertility well below replacement level? Three possible explanations come to mind:
- Overall fertility is in fact rising, driven by more childbearing among older women;
- A statistical quirk, in that the denominator upon which the rates are based is faulty;
- The proportional shares of ethnic subgroups in the population is shifting in favor of groups with higher fertility.
The evidence shows that a significant portion of the fertility rise is real, not a quirk of computation. Gains are apparent in all female age groups, in particular, among women in their late twenties and early thirties as well as among women over 40. The long foreseen "catching up" by those baby boom women who delayed having children for many years after marriage is happening. However, apart from women in their late twenties and over thirty, increases in fertility are modest. Once this "catching up" phase runs its course, fertility levels could again decline.
Incomplete Population Estimates and Inflated Fertility Bates
Use of an inaccurate denominator could also account for some of the statistical change. Total fertility rates are derived from age-specific rates which, in turn, are calculated by dividing the number of births to women of a specific age by the total number of women of that age. The numerator (the number of births) is very accurate. united States vital statistics are excellent. It is difficult even to imagine an unregistered birth. But the denominator (the at-risk population) is derived from decennial censuses and, between censuses, from population estimates. These are sometimes inaccurate.
In the 1980 census 227 million Americans were counted, although earlier projections of the population for that year were only 222 million. Throughout the 19705, the denominator used to calculate birth rates has been based on these intercensal estimates and thus were too low, resulting in inflated rates. These rates were later adjusted to take into account the larger population base. As a result the final fertility rates fell slightly. In addition, post-censal enumeration surveys subsequently discovered that about five million people were not counted in 1980.1
According to the U.S. Census Bureau, the population for 1990 was 249.6 million. Throughout the 19805, the denominator for women of childbearing age based on these estimates appears to have been accurate. Thus, the problem noted in 1980 may not be absent in 1990. However as many as 5 million Americans may not have been counted in 1990. To illustrate the impact of such a difference in the denominator, assume 4 million births (about the number for 1990). If the denominator is 250 million, the crude birth rate is 16.0; but if the denominator is 255 million, that rate is 15.68. While the impact may be slight, at least a small portion of the gain in fertility since 1988 may be spurious. While the total fertility rate of 2.1 may be reached in 1990, this may reflect a slight deflation of the total population used in the denominator.
Shifting Shares: The Growth of High Fertility Groups
A third factor in the rise in fertility might be labeled "shifting shares." Different sub-groups of the population exhibit different levels of fertility. Hispanics have the highest rates — around 3.0. On the other extreme, "Anglos" (that is, non-Hispanic Whites ) have the lowest rate — about 1.8. Between these two extremes are Blacks (about 2.2) and Asians (2.3).2 If the Hispanic share of the national population increases while that of Anglos decreases, that alone will yield a gain in fertility, even if the fertility of each ethnic group remains constant.
Such a shift in shares of. the population is in fact taking place because of considerable immigration from Latin America and Asia and continued low fertility among non-Hispanic whites. These "shifting shares" may well account for a portion of the increase in fertility among American women.
It is not possible to give precise weights to these various factors underlying recent fertility growth. Nothing can be done about any undercount of the population that might result in an overestimation of the fertility rate, as such adjustments are not made by the National Center for Health Statistics. Much more important is that, while Black and White (including some Hispanics) fertility rates are available on the national level, Hispanic and Asian rates can only be estimated.3 Not enough is known about the changes in fertility that may be occurring within these ethnic groups. Unless the fertility of each group is known with precision, pinpointing their contribution to changing overall fertility is difficult.
California's Changing Fertility: A Harbinger
To estimate the recent rise in fertility nationally, it is useful to look at states that have needed information, using them as surrogate sources. While California's large proportion of minorities makes it less than an ideal model for the entire nation, it is often in the vanguard for social developments that ultimately reach most of the remaining 49 states. Fertility trends in California today may presage change in the rest of the nation.
Recent data from the Demographic unit of the California Department of Finance point to a substantial increase in fertility in that state during the 1980s. In 1982 the total fertility rate was 1.947. By 1988, it had reached 2.329 — an increase of 20 percent. Was this increase real or spurious? If real, what were the causes of this substantial gain?
The denominators used in the preparation of these rates were derived from state estimates prepared by the Demographic Unit. In 1988, the state's estimated population was 27,847,200. The population then estimated for 1990 was 28,771,200, lower than the count (29,760,021) announced by the Bureau of the Census in early 1991. The difference is too small to be a contributing factor in explaining fertility increases, though the possibility of an undercount can not be ruled out.
As Table 1 and Figure 1 illustrate, fertility in California has risen among all ethnic groups since 1982:
- for Blacks, from 2.095 to 2.421;
- for Asians and Others (including Pacific Islanders and Native Americans), from 2.189 to 2.467;
- for Hispanics, from 3.169 to 3.527;
- for non-Hispanic Whites, from 1.450 to 1.697.
Fertility also rose in almost all age categories for all four groups. Increases were particularly marked among Anglo and Black women over age 30, suggesting that those baby boom women may have been "catching up" in their fertility behavior during the 1980s.
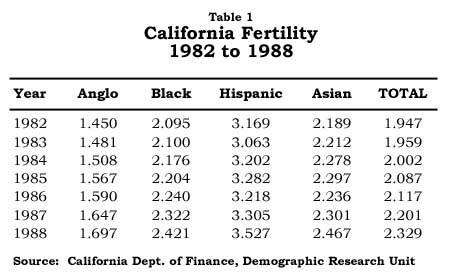
Such large increases were not as sharp among Hispanic and Asian women, suggesting that fertility came earlier for many of these women.
California's increase in fertility was real. Of that there can be little doubt. But what remains unexplained is how much shifting ethnic shares in the population contributed to the state's in overall increase?
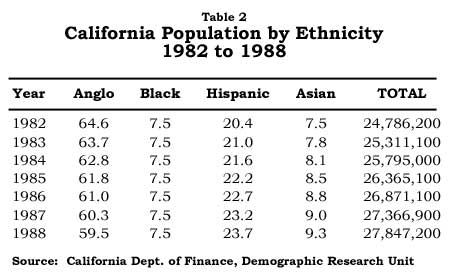
Over that seven-year period, the proportion of Californians who are Hispanic or Asian grew considerably through immigration. The significant gain in overall fertility is due, at least in part, to the fact that California's Hispanic and Asian minorities increased their shares of the population and at the same time increased their fertility. According to estimates of the Demographic Research Unit, between 1982 and 1988 the Hispanic share of California's population rose from 20.4 to 23.7 percent. Asians' share rose from 7.5 to 9.3 percent. The proportion of Anglos in the population fell from 64.6 percent to 59.5 percent. The Black proportion remained constant at 7.5 percent.
If the total fertility rates of each ethnic group for 1998 are applied to the 1982 population distribution, the resulting rate is 2.179 as compared to the actual 1988 rate of 2.329. In 1982, the actual rate was 1.947. Thus, the "shifting share" phenomenon accounted for 39 percent of the increase ~n fertility over that seven-year period. In other words, if the ethnic composition of the state's population had remained constant since 1982, the 1988 rate would have been 2.179 rather than 2.329, even if the fertility of each group had increased as indicated.
Surprising Growth in Hispanic Fertility
The growth in Hispanic fertility — to a high 3.5 births per woman — was unexpected. Study after study has shown that Hispanic-American fertility is likely to fall in the second and third generations (e.g. Bean and Stephen, 1990) .This is particularly true if assimilation occurs, as indicated by increasing reliance on English rather than Spanish in every day conversation. For example, a study of women of Mexican origin, age 20-44 based on the 1980 census found:
"Women who speak only English have two children on average as compared with more than three and one/third children for women speaking no English at all. In fact, the cumulative fertility of women in the total sample monotonically decreases with rising levels of English proficiency, and, in general, this pattern is observed with each age cohort." (Swicegood, et al, 1988, 25)
Because of persistent high levels of immigration (legal and illegal) , first generation Hispanics who have not assimilated have increasing weight in the Hispanic population of California. If levels of immigration remain high, declines in Hispanic fertility may not be forthcoming because of "shifting shares" within that population. Among first generation Hispanics, the share exhibiting higher fertility grows at the expense of those of the second and third generations, who are likely to have lower fertility.
"Shifting Shares" Among Asians
Similarly, Asian fertility in the 1980s was higher than anticipated. For all years between 1982 and 1938 the rate was higher for Asians than for Blacks. Since both the Chinese and Japanese have had low fertility for many years, fertility among the newer Asian immigrant groups — especially Southeast Asians — must be fairly high. continued immigration — or secondary migration to California — from relatively new source countries such as Vietnam, Laos, and Cambodia, and rising immigration from the Philippines, may postpone any decline in Asian fertility in California. Once again, the "shifting shares" phenomenon helps explain this rise in fertility. The proportion Filipino and Southeast Asians in the Asian population is growing at the expense of the less fertile Chinese and Japanese.
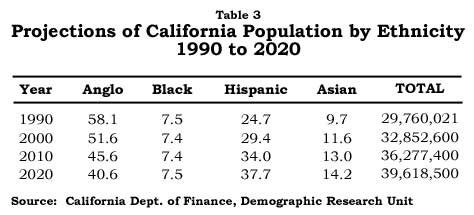
Total California fertility should thus remain well above the level needed to replace the population for the foreseeable future. If the fertility of each ethnic group remains at its 1983 level, California fertility will reach 2.4 in 2000, 2.5 in 2010, and 2.6 in 2020, largely because of the growing proportion of Hispanics and Asians in the state's population. According to the Demographic Research Unit projections, by the year 2000:
- the Anglo share of the population will be down to 51.6 percent;
- that for Hispanics will climb to 29.4;
- Blacks will comprise 7.4 and Asians 11.6 percent of the state's population;
- by 2010, these shares of California's projected population of nearly 40 million will be 45.6, 34.0, 7.4; and 13.0 respectively (Table 3)
Thus, future increases in the overall total fertility rate of California are virtually assured. This upward trend will occur despite the fact that Anglo fertility will remain well below the replacement level. Much has been written in recent years about California soon becoming a state with no single ethnic majority. The Golden State will comprise a medley of minorities. According to state projections, this will happen before 2010. With the current fertility behavior of Californians, such a shift in population composition would happen, though much later, without any in-migration — domestic or international. And the state's population would continue to grow indefinitely. The below replacement level fertility of Anglos is more than offset by persistent rates of other groups well above replacement level.
Shifting Ethnic Shares and Future U.S. Population Trends
These California data suggest that a portion of the increase in national fertility may arise from the changing ethnic proportions of the U.S. population, though less dramatically than in California. As long as the shares of higher fertility groups continue to grow, overall fertility will rise. As long as the fertility of minority groups surpasses that of the current majority population, the growing numbers in the minorities will boost the nation's overall fertility.
Assume that the current total fertility rates for the four principal ethnic groups are as estimated earlier: Anglo 1.8; Black 2.2; Hispanic 3.0; Asian and Others 2.3. These rates, while not final, are probably quite close to the eventual figures for 1990. The estimated total fertility rate that results is 1.996, very close to the anticipated rate for 1990. Let us also assume that shifts in the ethnic composition of the population will be as described in Table 4. For example, the Anglo share will fall from 75 percent in 1990 to 65 in 2020 and 54 in 2050 while that for Hispanics will rise from 9 percent to 15 and 23 percent. Table 4 shows approximately what will happen to the population composition of the nation if net immigration levels remain around 750,000.
Given these assumptions, the total fertility rate would rise from 2.0 in 1990 to 2.1 in 2020 and 2.2 in 2050 —without any actual increases in the fertility of anyone ethnic group. If, on the other hand, ethnic fertility climbs as it did in California, even higher total fertility rates can be expected. Such "small" increases of .01 every thirty years may seem inconsequential. They are not. According to recent Census Bureau projections, the difference between fertility remaining constant at 1.8 and fertility gradually rising to 2.2 by 2050 (while holding mortality and migration constant) amounts to over 63 million more people by that year! (1989, p. 16) The low fertility scenario would result in a population of 300 million; the high fertility scenario 363 million. A very slight increase in fertility yields massive increases in population size decades later. These numbers portend no foreseeable end to population growth in the United States.
Is Zero Population Growth In The Nation's Future?
The "zero population growth" (ZPG) movement was born in the middle 19605 in reaction to the baby boom that was then tapering off and partly in response to the best selling book by Paul Ehrlich, The Population Bomb (1965). ZPG's goal was a total fertility rate of 2.1, the rate at that time being still above 3.0. The goal was attained in 1972, and U.S. fertility has remained below that magic number since then. The nation appeared to be on its way toward "zero population growth."
However, as fertility was reaching new lows, levels of immigration were increasing rapidly due to the 1965 changes in immigration legislation and rising illegal immigration fueled by surging population growth in the Caribbean Basin. Even with fertility below 2.1, population was destined to grow indefinitely because of high immigration numbers. What then would be the desired fertility level to bring about zero growth given continued immigration of well over 500,000 annually?
In a 1982 article, Espenshade, Bouvier and Arthur demonstrated that:
"As long as fertility is below replacement, a stationary population [i.e. zero population growth] results by combining fixed fertility and mortality schedules with a constant number and age distribution for immigrants. Neither the level of the net reproduction rate nor the size of the annual immigration qualitatively affects this conclusion; a stationary population eventually emerges." (1982, p. 130)
In other words, as long as fertility remains below replacement level (2.1) and immigration is constant at any level, zero population growth situation will result eventually. In the United States, if fertility remained constant at 1.8 and net immigration leveled off at 800,000, the ultimate stationary population would approximate 240 million. But before attaining that stationary level after about 200 years, population size would rise to about 350 million before beginning a long descent to 240 million.
These projections of ultimate population stability assume that new immigrants immediately take on the fertility of the resident population, something that is most certainly not happening at this time. Because of these two inter-linked factors, continued immigration and higher fertility among immigrants, zero population growth, a goal once thought to have been within reach, is receding into the far future.
Altered Projections: 470 Million Americans in a Century
The higher fertility of new immigrant groups, as well as the shifting shares of the population as a result of continued high levels of immigration, bring a new and inadequately studied accelerating effect to fertility, and thus to future population size. These trends force a reexamination of projections of the nation's population in the 21st century. The projections now receiving most credence were those published by the Census Bureau projections in 1989. As is often the case, public attention focused on the Bureau's medium projection — one of 27 possible scenarios offered, but the one emphasized by the Bureau itself in its publication.
This medium scenario assumes that:
- life expectancy will rise gradually to 81.2 years;
- net immigration will level off at 500,000; and
- the total fertility rate will remain constant at 1.8.
Thus, the population would peak at 302 million in 2040 and drop slightly to 292 million by 2080.
Not surprisingly, these assumptions have been challenged. Bouvier has questioned the assumption that immigrants bear children at the same rate as their equivalent age and racial group in the U.S. population, and that yearly immigration will remain around 500,000. (1990, p. 193) Ahlburg and Vaupel point out that the medium scenario "discounts the possibility of future baby booms and assumes slow rates of mortality decline and low levels of immigration." (1990, p. 639) The Census Bureau's high scenario, based on fertility gradually increasing to 2.2 and net immigration remaining at about 800,000 per year, may prove to be more accurate. The resulting American population would reach 372 million in 2040 and 471 million in 2080 or almost 180 million more than under the widely-cited medium scenario.
As immigrants become an ever expanding proportion of the nation's population, fertility levels could rise to least 2.2. Any hope of attaining zero population growth at any time in the 21st century depends almost entirely on rapid fertility declines among these new minorities. However, with rising refugee inflows and the recent passage of legislation augmenting levels of immigration to perhaps 1 million annually, any hope of' attaining an end to population growth within the next century becomes an illusion, even with reduced fertility among all groups of Americans.
References
Ahlburg, D., and J. Vaupel (1990) "Alternative Projections of the U.S. Population," Demography, 27 (4) .
Bean, F. D., and E.H. Stephen (1990), "Assimilation, Disruption and the Fertility of Mexican Origin Women in the United States." Population Studies Center, Washington: Urban Institute.
Bouvier; L. F. (1990) ."U.S. Population in the 21st Century: Which Scenario is Reasonable?" Population and Environment, 11 (3).
Bouvier, L. F. (1991) Peaceful Invasions: Immigration and Changing America. Washington: Center for Immigration Studies.
Bouvier, L. F. and P. Martin (1985). Population Change and California's Future. Population Reference Bureau, Washington, D.C.
Ehrlich, Paul. (1968). The Population Bomb. New York: Ballantine Books.
Espenshade, T., L. Bouvier, and B. Arthur (1982). "Immigration and the Stable Model." Demography, 19 (1).
Swicegood, Cray, et al. (1988). "Language Usage and Fertility in the Mexican-origin Population of the U.S." Demography, 25 (1) .
U.S. Bureau of the Census. (1989)."Projections of the Population of the United States by Age, Race, and Sex: 1988 to 2080." Current Population Reports (Series P-25, No.1018) Washington, D.C: U.S. Government Printing Office.
End Notes
1 The vital statistics rates were not adjusted to account for such under-enumeration.
2 It should be emphasized that these are approximations. As will be noted later, data are not as yet available that would allow the examination of ethnic fertility rates at the national level.
3 Only in 1990 have all states (except New Hampshire) agreed to include an Hispanic and Asian identifier on their birth certificates. According to the National Center for Health Statistics, birth rates for all ethnic groups should be available by 1992.
Dr. Leon Bouvier, a demographer, is a former Vice President of Population Reference Bureau. Currently Visiting Professor at the Tulane University School of Public Health, he is author of the forthcoming book, Peaceful Invasions: Immigration and Changing America, to be published by the Center for Immigration Studies.